
Currency
 Let’s see…a heavily-indebted country can’t pay its bills, engages in a long series of failed attempts to manage a partial, controlled default, sees most of its capital flee to safer venues, and then, in a final act of desperation, imposes capital controls.
But it quickly realizes that it’s too late. Capital controls, to the extent that they ever work, have to be imposed by surprise, while there’s still some capital to control. If you wait until everyone expects them, the banks empty out in anticipation and you’ve locked a barn sans horses.
That’s pretty much what Greece is looking at in the next couple of weeks. Though a bailout remains possible, the markets have decided that it’s no longer a sure thing and capital is streaming towards the exit:
Greece bonds, stocks collapsing as the market re-panics
(MarketWatch) – This time we’re really panicking. That’s what some markets seem to be saying this morning on the heels of failed talks over the weekend between Greece and its European creditors.
Those discussions lasted anywhere between 45 minutes to an hour, with the breakdown a painful reminder of the fact that the International Monetary Fund bailed on its own talks with Greece last week. The can has now been kicked all the way to the last-stand June 25 European Union leaders summit in Brussels, where some say Prime Minister Alexis Tsipras has all his hopes riding.
But there’s also a meeting of Eurogroup finance ministers on Thursday, and many are looking anxiously for Athens to come up with new reform proposals ahead of that. June 30 remains the big line in the sand as Greece has a 1.6-billion-euro ($1.8 billion) payment to the IMF looming, after it bundled all its four June repayments into one.
The question is, what will markets do in the meantime? At least as far as Greek bonds and stocks are concerned, maybe just keep panicking. The yield on the 10-year Greek bond pushed above 12% in Europe’s morning, on track for its highest close since late April. It was up 90 basis points at 12.72%, according to electronic trading platform Tradeweb. The yield on 2-year bonds surged 3.9 percentage points to 28.66%.
Let this continue for just a few more days and Greece will be, financially as well as socially, a smoking ruin. It will also be a glimpse of the future for the rest of the developed world. The fact that the US, Great Britain and Japan can create their own currency allows them a bit of flexibility that Greece doesn’t have. But just a bit. As debt continues to rise faster than GDP, the gap between what’s owed and what can be repaid is becoming a chasm, with consequences that are both inevitable and inescapable.
Viewed this way the difference between Greece and the rest of us is cosmetic and very temporary. Where Greece negotiates with the IMF and ECB, the big debtor nations negotiate with the financial markets via QE and other kinds of debt monetization. The goal in both cases is to placate creditors without changing the behaviors that caused the problem. In both cases it has worked, for a time.
The fact that Greece is blowing up while the printing-press-endowed countries are not just means that the stock and bond markets are easier to fool than the ECB and IMF. But no one is permanently credulous. Everyone catches on eventually, and the soaring volatility in stocks and bonds around the world imply that Greece isn’t the only con artist about to be exposed. In bonds, for example:
Bond crash is so crazy BlackRock Inc is ripping up its risk models
(Financial Post) – With US$4.8 trillion in assets — or about the size of Japan’s economy — no one manages more money than BlackRock Inc. So, it’s worth paying attention when the firm says it’s time to cast aside its trusted models for assessing risk in bonds.
The $1.2 trillion meltdown in just three months is an early sign that it will not be easy to wean the world off six years of zero rates — and central banks have used up their arsenal. The gyrations gripping the world’s fixed-income market are so great that it’s almost impossible to make sense of them on a historical basis. In Germany, for example, yields on 10-year securities have surged from almost nothing in late April to about 1 per cent last week — a move so swift that some strategists are likening it to a once-in-a-generation event.
“The German bund market is incalculably volatile,” said Scott Thiel, BlackRock’s deputy chief investment officer for fundamental fixed income in London. “It doesn’t make sense to measure it in traditional respects.”
Across Europe, investors are ripping up their old models to analyze the US$100 trillion global bond market that dictates how much consumers and companies pay to borrow. Volatility is soaring as central-bank policies diverge, whiffs of inflation emerge and new regulations cause big banks to back away from their traditional role facilitating buying and selling. Continue reading here.

USDCAD Overnight Range 1.2310-1.2358
USDCAD edged higher in a thin overnight market, caught up in a combination of general US dollar strength and a small decline in oil prices.News that Canada’s Hudson’s Bay Corporation (HBC) was buying a German retailer for EUR2.38 billion, may have contributed to the USDCAD demand although that conclusion is a bit of a stretch.
The weekend news that the Greece/EU negotiations appeared to have collapsed drove the US dollar higher across the board in a thin Asian session. The move wasn’t sustained in Europe and the US dollar has given back most of its gains. This morning’s US data has been mixed. The NAHB housing starts index beat forecasts (Actual 59 vs. forecast 56) while both Industrial Production and Capacity utilization missed. All in all, it was a slow start to the week.
Canadian and US data is scarce until Wednesday’s FOMC meeting leaving headlines and oil prices to drive USDCAD direction. El
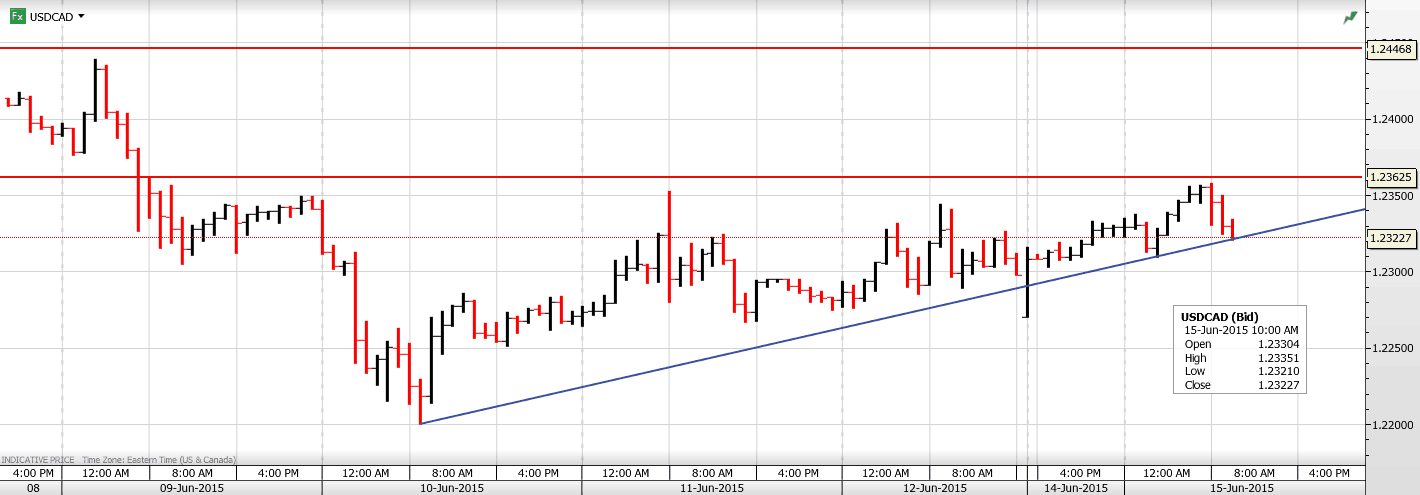
USDCAD technical outlook
The intraday technicals are bullish while trading above 1.2320 looking for a break of resistance at 1.2360 to extend gains to1.2440. A move below 1.2320 will lead to another test of 1.2280 and possibly back to 1.2240.
Today’s Range 1.2310-60
Chart: USDCAD hourly Larger Chart
 About 100 years ago, in his testimony before Congress, banking giant J.P. Morgan famously stated: “Gold is money, and nothing else.”
At the time, this was true in every sense of the word “money,” as the U.S. was still on the gold standard.
Of course, that’s no longer the case. Despite the fact that previous attempts in other countries to adopt fiat currency systems wreaked havoc on their economies, the U.S., under President Richard Nixon, cut all ties between the dollar and gold in 1971. Gold rose 2,330 percent during the decade, from $35 per ounce to $850.
Today, money supply continues to expand while federal gold reserves remain at the same levels.
Many people still view the yellow metal as something more than just another asset. They also contend that it’s grossly undervalued. In a recent interview with Hard Assets Investor, author and veteran gold investing expert James Turk explained that the money we use now in transactions is not real money at all but a substitute for gold—real money—which he sees fundamentally valued at $12,000 per ounce.
That is to say, if the U.S. government decided tomorrow to return to the gold standard, one ounce of the metal could be valued as high as $12,000, according to Turk’s model.
The current fiat currency system in the U.S. is more than 40 years old. That’s much longer than many in the past lasted, including two of the earliest attempts by central bankers Johan Palmstruch and John Law, both of which I summarize below. Some readers might identify more than a few parallels between then and now.
 Johan Palmstruch, the Dutchman Who Started a Paper Ponzi Scheme in 1661
In the mid-1600s, a Dutch merchant named Johan Palmstruch founded the Stockholms Banco in Sweden, the first bank in Europe to print paper money. The Swedish currency at the time was the daler, essentially a copper plate. Palmstruch’s bank began holding these and issuing banknotes, which were exchangeable in any transaction and fully backed by the physical metal.
At least, that’s what customers were told.
As you might imagine, people found these notes to be much more convenient than copper plates, and their popularity soared. But there was one (huge) problem. Palmstruch had been doling out so many paper bills, that their collective value soon exceeded the amount of metal on reserve. When customers heard the news, a major bank run occurred, but Palmstruch was unable to honor the rapidly-weakening notes.
By 1664, a mere three years into his monetary experiment, the Stockholms Banco was ruined and Palmstruch was jailed—just as Bernie Madoff would be three and a half centuries later.
John Law, the Infamous Scottish Gambler Who Defrauded the French with Worthless Paper
A little over 50 years later, in the early 1700s, a similar experiment was conducted in France, with even more disastrous consequences. This time, the perpetrator was a Scottish gambler and womanizer named John Law, who as a young man had been forced to flee Britain after he killed a man in a duel over a love interest—and bribed his way out of prison. After escaping jail time, Law spent 10 years or so gallivanting about Europe and developing his economic theories, which he outlined in an academic paper.
It was the Age of Enlightenment, when great iconoclastic thinkers such as Descartes, Locke and Newton emerged, changing our understanding of consciousness, politics and physics. Baroque music was all the rage in Europe, as were composers like Bach, Handel and Vivaldi. It was also a golden age of get-rich-quick schemes, and as investors, it’s important that we be aware of the history of human behavior.
In 1715, France was insolvent. It had just lost its king, Louis XIV, and the Duke d’Orléans was named regent until the late monarch’s great-grandson came of age to rule. Familiar with Law and his unorthodox ideas, the duke established him as head of the Banque Générale in hopes that he might reduce the massive debt Louis XIV left behind.
To this end, Law began printing banknotes—lots of them—and flooding the economy with easy money. Doing so, he believed, would expand employment, boost production and increase exports.
 It indeed had those effects—for a time. Paris was booming. The number of millionaires multiplied.
Unlike Palmstruch, Law made no claims that the notes could be converted back into gold or any other metal. He believed that a currency, whether gold or paper, had no intrinsic value other than as a government-sanctioned medium of exchange. Instead, his notes were “secured,” vaguely, by French land, including its colonies in the Americas. There was also no limit to the amount of money that could be pumped into the French economy. Like many of today’s central bankers, Law was of the opinion that if 500 million notes were good, a billion were even better.
But to make it all work according to plan, he had to take extreme measures. Law outlawed the hoarding of money, the use of coins and the possession of more than the minimalist amount of gold and silver.
The system turned out to be untenable and the paper money became worthless. After only four short years, the currency bubble burst. Law was not only removed from office but exiled from the country. Until his death in 1729, he roamed Europe heavily in debt, making his way by his former occupation, gambling.
The incident had long-lasting effects. It sustained the country’s economic woes for years and contributed to the start of the French Revolution later in the century, as it stoked working class disenfranchisement.
Lessons Learned?
Just as we still read Locke and listen to Bach, we should remember what Palmstruch, Law and other reckless central bankers did—which was essentially pull the rug out from under their countries’ monetary systems. It would be extreme to suggest that a similar collapse in currency might one day happen in the U.S., but it’s worth repeating that the gold supply has not kept pace with the money supply.
This could have huge implications.
As James Turk points out:
Eventually people are going to understand that all of this fiat currency that is backed by nothing but IOUs is only as good as the IOUs are good. And in the current environment, the IOUs are so big, a lot of promises are going to be broken.
Should those IOUs one day become as worthless as Palmstruch’s or Law’s paper—however unlikely that might be—I suspect many readers would feel relieved to know that they had had the prudence to invest in gold.
I always advise investors to hold 10 percent of their portfolios in gold—5 percent in bullion, 5 percent in gold stocks, then rebalance every year.

USDCAD Overnight Range 1.2207-1.2350
The US dollar went “Splat” overnight. The greenback dropped against the majors as Bunds and central banker’s combined to deliver a “one-two” punch to dollar bulls in a move that may have been exaggerated by poor liquidity.
The RBA governor started the Asian session telling traders that the RBA would ease further. The AUDUSD dropped, but not for long buoyed by general US dollar weakness. The Bank of Japan Governor, Kuroda, in an address to the Diet, warned against additional JPY weakness which was followed up by further headlines stating that QE won’t last forever. USDJPY traders got spooked and USDJPY plunged from 124.60 to 122.49.
The US dollar remained wobbly in Europe and then toppled when German Bund yields topped 1%. EURUSD has since returned back to yesterday’s New York closing level.
USDCAD bounced in early New York trading, but that move didn’t last and it is now flirting with the next level of minor support at 1.2210. The Loonie is continuing to benefit from the positive domestic data in addition to the bounce in WTI to $61.66/bbl
The US dollar and USDCAD will likely consolidate within the bottom area of the overnight ranges ahead of tomorrow’s US Retail Sales Data.
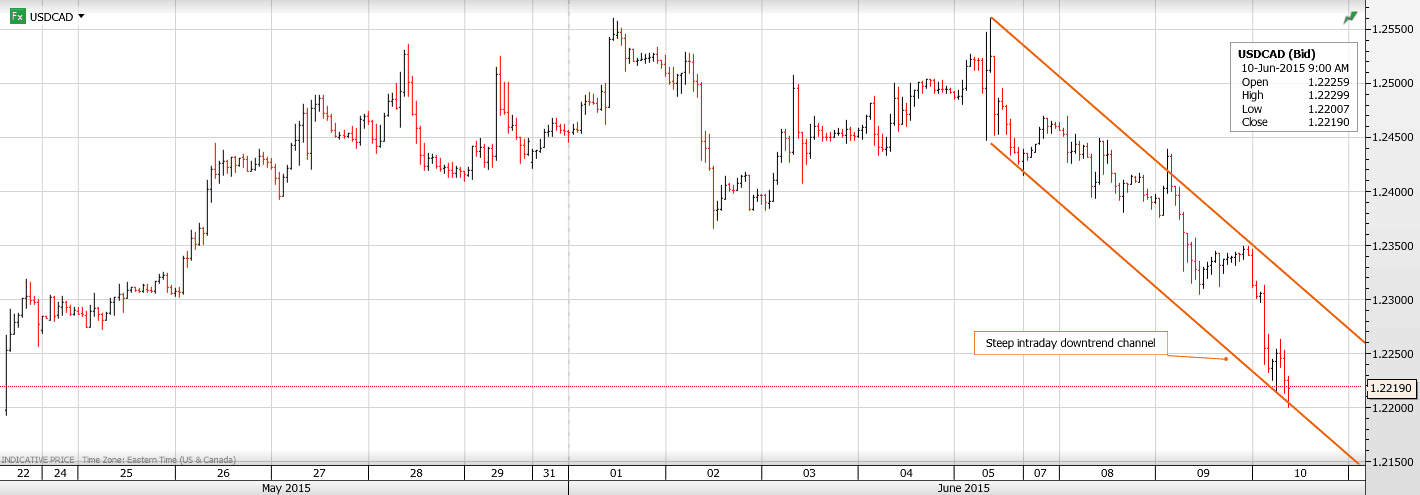
USDCAD technical outlook
The intraday USDCAD technicals are bearish. The break of support at 1.2360 points to further losses to 1.2165, supported by the overnight move below the intraday 50% Fibonacci retracement level of the May-June range (1.2240). In addition USDCAD is in a steep downtrend channel, between 1.2210 and 1.2340. For today, USDCAD support is at 1.2210 and 1.2180. Resistance is at 1.2260 and 1.2290.
Today’s Range 1.2180-1.2260
Chart: USDCAD hourly with downtrend channel Larger Chart
The beginning of May brought a new 2015 high of $62.58 in crude oil, but we didn’t see a fresh high in case of oil stocks. In the following weeks, crude oil has been trading in a narrow range and erased less than 38.2% of earlier rally. What happened at the same time with the XOI? The index declined sharply and approached the 61.8% Fibonacci retracement in the recent days, showing its weakness in relation to light crude. Are there any factors on the horizon that could drive oil stocks higher or lower in the near future? Is it possible that the stocks-to-oil stocks ratio give us valuable clues about future moves?
Looking at the oil market from today’s point of view, we can say with full conviction that April was the best month for oil bulls since last June. Back then, oil stocks climbed to the 38.2% Fibonacci retracement, while crude oil erased almost 30% of the June-March declines. Although the XOI seemed to be stronger than the WTI, the beginning of May brought a new 2015 high of $62.58 in crude oil, but we didn’t see a fresh high in case of oil stocks. In the following weeks, crude oil has been trading in a narrow range and erased less than 38.2% of earlier rally. What happened at the same time with the XOI? The index declined sharply and approached the 61.8% Fibonacci retracement in the recent days, showing its weakness in relation to light crude.
Will the proximity to this important retracement encourage oil bulls to act? Or maybe we’ll see further deterioration? Before we try to answer these questions, we’ll examine the NYSE Arca Oil Index (XOI) in different time horizons and find out if there’s something else on the horizon that could drive oil stocks higher or lower in the near future. On top of that, we also decided to focus on the connection between the XOI and the general stock market to find out what impact the S&P500 index could have on the oil stock index’s future moves (charts courtesy by http://stockcharts.com).

From today’s point of view we see that oil bears not only took the XOI to around 1,360, where the previously-broken medium-term declining red line was, but also managed to push the index lower. With this downward move, oil stocks declined below the 200-week moving average once again, which in combination with sell signals generated by the indicators suggests that further deterioration is still ahead us. If this is the case, and the XOI moves lower from here, the initial downside target would be around 1,270, where currently the green support line based on the Dec and Jan lows is.
Are there any short-term factors that could hinder the realization of the above scenario? Let’s examine the daily chart and find out.

Looking at the daily chart, we see that the combination of the upper border of the gap (between the Nov 25 low and the Nov 28 high), the 200-day moving average and the 50% Fibonacci retracement level stopped further improvement, triggering a correction of the previous rally. With this downward move, the XOI reached the green support line (based on the Jan 14, and Mar13 lows), which in combination with the proximity to the 61.8% Fibonacci retracement (based on the entire Dec-Apr upward move) triggered a rebound.
At this point, it is also worth noting that the RSI bounced off the level of 30, generating a buy signal, while the CCI and Stochastic Oscillator are oversold and very close to do the same in the coming days. If we see such price action, the XOI will likely moves higher from here and climb to the 38.2% Fibonacci retracement based on the entire recent decline (around 1,360) in the coming days.
Before we summarize today’s article, let’s take a look at the relation between the general stock market an oil stocks. Will it confirm the above pro-growth scenario?

As you see on the above chart, the ratio reached the resistance zone created by the 2002 low and the 200-month moving average, which could pause (or even stop) further improvement. When we take a closer look at the chart, we notice that we saw such situation in the previous years and also in Jan and then in March (we marked these periods of time with red rectangles). In all these cases, lower values of the ratio translated to an increase in the XOI. Therefore, another pullback from here will likely trigger an improvement in oil stocks in the coming week(s).
Summing up, oil stocks extended losses and reached the green support line based on the Jan and Mar lows, which in combination with the proximity to the 61.8% Fibonacci retracement, the position of the daily indicators and the current situation in the SPX:XOI ratio suggests that we could see a rebound from here to around 1,360 in the coming week(s).
Thank you.

-
I know Mike is a very solid investor and respect his opinions very much. So if he says pay attention to this or that - I will.
~ Dale G.
-
I've started managing my own investments so view Michael's site as a one-stop shop from which to get information and perspectives.
~ Dave E.
-
Michael offers easy reading, honest, common sense information that anyone can use in a practical manner.
~ der_al.
-
A sane voice in a scrambled investment world.
~ Ed R.
Inside Edge Pro Contributors

Greg Weldon

Josef Schachter

Tyler Bollhorn

Ryan Irvine

Paul Beattie

Martin Straith

Patrick Ceresna

Mark Leibovit

James Thorne

Victor Adair