
Currency
The US dollar has been the world’s reserve currency since Bretton Woods – about 70 years. The power and importance of Middle-East oil and the US economy and military have supported the dollar for about 40 years. Quick story:
- The world buys oil in dollars. (Thank you Saudi Arabia and Kissinger.)
- Therefore the world must purchase (support) dollars to obtain oil.
- The US supports the oil producing nations with military might.
- The oil producing nations collect dollars in exchange for oil and recycle those petrodollars back into US T-bonds and equities thereby supporting the dollar and the US stock and bond markets.
The process works exceedingly well for the US since, as Bernanke noted, we have a printing press and can “print” the dollars to pay for oil and other imported goods.
But how much longer can the US maintain this dollar support process? Consider:
FUNDAMENTAL ISSUES:
- AIIB: The Asian Infrastructure Investment Bank is clearly a threat to dollar dominance. Over 50 nations joined, including the UK, France, Germany, and Australia. This will weaken the dollar’s importance in world trade.
- China has purchased and imported a massive amount of gold bars in the past 5 years. The magnitude of the gold migration from the west to Asia has been obscured intentionally. Clearly the western central banks and governments do not want the world to know how much gold they have sold to China. China does not want to announce how much gold they have purchased, which might panic the gold market and elevate prices, making additional purchases more expensive. China’s gold hoard will become a threat to the reserve currency status of the dollar, a fiat currency backed only by “faith and trust.”
- China will announce their gold holdings when it is convenient and beneficial to China. They might even tell the truth. Worse, they might demand the US and the UK tell the truth and produce auditable reports on their remaining gold. An audit could be catastrophic for the relative value of the dollar. Since consequences might be destructive to all parties, a “trust me” solution will probably be found unless China is ready for an all-out assault on the dollar. The dollar is clearly in danger if China announces total gold holdings close to or larger (likely) than the official US gold stockpile.
- Reasonable analysis by many individuals and organizations suggests that much of the gold supposedly held by the US and UK is gone. Do not expect official confirmation. Regardless of denials and obfuscation, gold is important for confidence in all currencies. Admitting most of the US gold has been “leased,” sold, or stolen will create a danger zone for the dollar.
- “He who has the gold makes the rules.”
- We no longer hear, “The dollar is as good as gold.” Could that change in the next decade to “The yuan is as good as gold?”
CHART ANALYSIS
For a long term perspective, examine the monthly chart of the dollar index.

For an intermediate term perspective, examine the weekly chart.

What I see in the charts:
The dollar index made major turns in 1995, 2001, 2008 and 2015, about every 6.5 years. Note the vertical blue lines on the chart and the following comments regarding changes in the S&P 500 Index:
- 1995: The S&P began a major move from about 470 to about 1,570.
- 2001: The S&P peaked in 2000 above 1,500 and corrected from there.
- 2008: The S&P crashed in 2008 and bottomed in early 2009.
- 2015: The S&P made a new all-time high in early 2015.
The monthly dollar index has moved too far and too fast. Further, major turns in the dollar are often associated with turns in the S&P and general economic activity. Be cautious.
The weekly chart of the dollar index (April 29) has broken the up trending red support line, as I have drawn it. This could be the start of a major dollar index downturn. Be cautious.
Could the dollar index strengthen and rally further? Almost anything is possible in central bank managed currency, bond, and equity bubbles, but this looks like a danger zone for the dollar.
HEADLINES – More Danger Zone Concerns:
“Boston Fed Admits There is No Exit” If the Fed can’t exit QE and has to “print” to infinity (“QEfinity”) that indicates long-term weakness ahead for the dollar.
“Going the Way of the Mayans – End Game of Global Debt Addiction” (Blame the policy makers.)
“$3 Trillion in negative-yielding Eurobonds are a time bomb so buy gold”
“World Faces New Collapse Under Strong Dollar: ‘We’re Going to Have Another Financial Crisis’”
“Correction Ahead? Investors Exit Stocks”
Gary Christenson
The Deviant Investor

USDCAD Overnight Range 1.2048-1.2142
The highly anticipated US (and Canadian) employment reports were greeted with a resounding “meh”. NFP was right on consensus and the unemployment rate is 5.4%. EURUSD rose and fell and is currently back to its pre-release level.The Canadian report was worse than expected, which was actually expected, shedding 19,700 jobs. The details revealed that the data isn’t as bad as it looks with full-time gaining 46,900 jobs. All the losses were part-time. USDCAD trading was erratic but has settled close to where it was before the news.
The overnight session ahead of the US non-farm payrolls release is usually quiet and for most currency pairs, that was the case. But not for Sterling.The Conservative party surprised pollsters and squeaked out a majority win. GBPUSD rallied from 1.5265 to over 1.5500 before drifting lower on profit taking. EURUSD dropped as EURGBP trades were reversed.
In Asia, the RBA Monetary Policy Report contrasted with Tuesday’s RBA statement. On Tuesday, the bias toward cutting rates was omitted while some forecasts and statements in the MPR heightened rate cut risks. AUDUSD fell and then weak Chinese trade data added to its woes.
USDCAD technical outlook
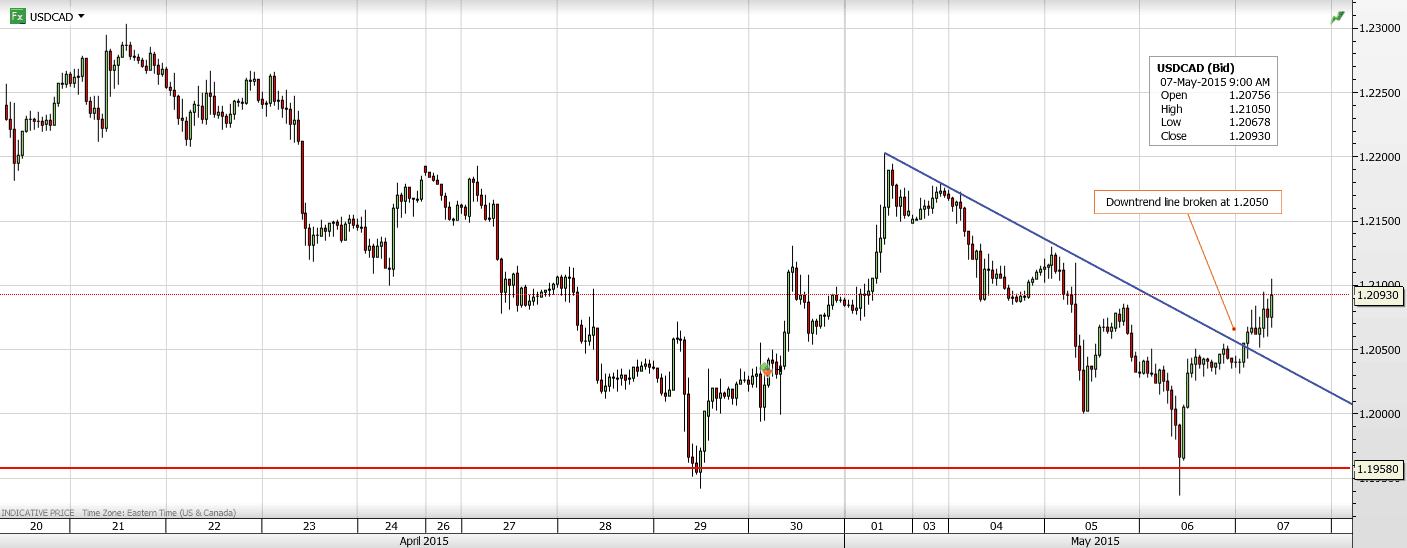
The intraday technicals are modestly bullish while trading above 1.2090 supported by yesterday’s breach of resistance at 1.2050 looking for a break of the April downtrend line (Currently 1.2160) to extend gains to 1.2270. If 1.2160 caps the upside, expect additional 1.1960-1.2160 consolidation.
Today’s Range 1.2080-1.2160
Chart: USDCAD 4 hour with intraday downtrend shown

 Quotable
“Only those who will risk going too far can possibly find out how far one can go.”
T. S. Eliot
Commentary & Analysis
The Greeks used to call it “hubris”
Proudly spending other people’s money with little in the way of accountability might be considered hubris by those of a more conservative bent. It seems socialists think that represents “justice.” From the Financial Times this morning:
The Greek parliament has approved a law proposed by the leftwing Syriza-led governmentoverturning civil service reforms by the previous government aimed at streamlining the country’s inefficient public sector.
The legislation, which was passed on Tuesday night, called for the rehiring of about 13,000 civil servants whose jobs were cut in an overhaul of the public administration agreed with bailout lenders. It also eliminated annual evaluations for civil servants and promotions based on merit.
I just love that last part—let’s forget about that “merit” thing. Is this supposed to instill confidence for anyone willing to lend Greece money?
The euro remains supported on rising German yields, as you can see in the chart below. But one wonders just how much more Eurozone grownups can stand. If German yields start to fall again, it likely means Greek risk is intensifying, i.e. players moving back into German paper to hide…
In anticipation of higher U.S. rates and lower rates elsewhere, the greenback had enjoyed a dramatic rally. Has the tide turned, or is the dollar merely taking a breather? We believe there are threats and opportunities hidden underneath recent market action. Below is a closer look in an effort to allow investors to better understand the dynamics that might be unfolding.

Is the world flat? At 0%…
Although we have had a ‘taper tantrum’ before, it was European Central Bank (ECB) President Mario Draghi that kicked the theme of rate divergence into high gear. As the Fed was contemplating an “exit”, the ECB was contemplating QE. What was interesting at the time is that the glass was perceived to be half full in the U.S., while half empty in the Eurozone. What we mean to say with that is that while there are clearly differences in the regions, they weren’t as dramatic as they were made out to be. Consider the following two charts on forward inflation expectations in the U.S. and Eurozone:


In the Eurozone, Draghi raised alarm bells as some measures of future inflation expectations dipped below the ECB’s target of “close to, but below 2%.” The plunge in commodity prices exacerbated this decline. However, it was what I would call a convenient excuse to announce QE. The context in which Draghi presented it suggested he targeted the exchange rate as a way to induce inflation. The logic he presented last summer stipulated that weaker Eurozone countries must become more competitive; as achieving greater competitiveness through lower wages has a tremendous political cost, the better alternative may be to increase competitiveness through a weaker euro which – incidentally – may also help boost inflation.
However, I would like to point out that the chart for the U.S. above shows a picture that isn’t all that different. When Bernanke was at the helm of the Fed, he would announce another round of QE when forward inflation expectations on the chart above were coming down towards the 2% target. But instead of talking about QE, we were told to be patient, as the recovery must surely be under way. In fact, for those that haven’t noticed, the U.S. has not raised rates as of yet. But we have been told over and over again that the U.S. is on its way of raising rates.
I’m not suggesting that policies haven’t diverged in the U.S. and Eurozone, but I am suggesting that the market may have gotten way ahead of itself. Consider the following chart that adds up the number of speculative positions betting on the dollar rising based on CFTC data:

This chart shows that we reached extremes, with the market suggesting a meteoric rise of the U.S. economy while the Eurozone and the rest of the world crash and burn. In many ways, this is a symptom of the types of markets we have experienced with ever more people jumping on the same trade. In fact, in just about any market class, it appears that investing based on momentum has been one of the more profitable strategies. However, be warned: in our analysis, asset bubbles tend to be popped after too many people have piled into the same trade. In this context we think stocks, bonds and the dollar are all vulnerable.
Let’s look at what’s happening underneath the surface. Consider the Citi Economic Surprise Indices for the U.S. and the Eurozone that are measures of how economic measures have come in versus what had been expected:


With regard to the U.S., this index suggests things might be developing worse than anticipated. Conversely, in the Eurozone, the economy may be developing better than anticipated, although that drop in the last data point is a reminder that one has to be cautious in interpreting too much into shorter term trends. Still, to us, it drives home the point that the market got way ahead of itself. As such, the sharp bounce in the euro off its lows can be explained by profit taking, a short squeeze, and a re-pricing of expectations. But is it a dead cat bounce for the euro, or is it a sign of other changes to come?
A messy world
Many say Europe is pretty messed up. That may well be, but isn’t much of the world messed up? Even back in the U.S., don’t we have our share of a “mess”? Furthermore, does anyone really believe Greece, or, for that matter, that China, Japan or the U.S. would jump over its own shadow and adopt a different culture? Our view is that changes will happen, but always in the respective cultural and political context. As such, to continue using the eloquent term: Europe has always been a mess and will likely continue to be a mess. And in the U.S., we are unlikely to address the sustainability of our entitlement obligations anytime soon. And Japan won’t be able to find a way to move towards what we may deem sustainable deficits anytime soon, either.
In our assessment, the real question investors should ask themselves is: what is the relationship between a company, or currency, versus the market value/price. There are great businesses, but they might be overvalued; similarly, the greenback may have a few things going for it, but is what appears to be an ever-stronger dollar justified?
Looking at the Eurozone, Greece disappeared from the headlines for a few days. But as I write this, the IMF warns it will only give Greece more money if other creditors take a haircut on their sovereign debt. The argument being that as Greece has moved away from a credible path towards delivering primary surpluses, it may not be warranted to throw good money after bad. The creditors may now be faced with the unpleasant choice of agreeing to a voluntary haircut; or to let Greece go bust, upon which a haircut will be imposed on the creditors. Yet the euro’s recent rally has – at least as of this writing – not been broken. In our assessment, there are two key dynamics playing out here:
- First, the euro is unfazed by what’s happening in Greece because the threat of contagion due to a Greek default has diminished. That’s because outside of Greece, Greece’s creditors, to a large extent, are no longer financial institutions, but the ECB, the European Union and the IMF. As a result, a Greek default is a political problem, but no longer risks the toppling of large financial institutions. Any losses will be “socialized.”
- The force acting against this is speculators that continue to have dramatic short positions in the euro. Those bears are unlikely to leave without a fight.
Note that I carefully wrote that the “threat of contagion due to a Greek default has diminished.” As such, I consider a Greek default one of the better outcomes for the euro. At the other end of the spectrum would be significant debt forgiveness without anything in return. This “easy” path out would encourage other weak countries to follow suit and may cause havoc in the respective bond markets that, in turn, could make the euro the favorite place once again for investors to express their dismay. As such, it is important to continue monitoring how peripheral Eurozone debt trades for any spillover effects.
Commodities 101
While much attention has focused on the euro, commodity currencies, such as the Canadian Dollar, Australian Dollar and Norwegian Krone suffered rather substantially as the price of oil was plunging. Similarly, they’ve had a bit of a comeback since oil prices have rebounded. Just about anyone who has tried to forecast oil has been wrong over the past year, so I’m not going to throw out a price target. However, what we do know is that access to credit to smaller players (the fracking industry mostly has small players) has become far more challenging. Similarly, anyone with a high cost of doing business (this includes the oil sands) may continue to face significant challenges. We also know that storage bottleneck has not been fully resolved. As such, challenges remain.
Of the currencies mentioned, the Australian dollar may be least dependent on the price of oil; Australia’s economy is very much dependent on copper and other hard commodities, notably exporting those to China. As such, the Aussie has often been considered a proxy for the health of China’s economy. What we see when we look at the Aussie is a central bank that has been desperate to weaken its currency. In its most recent statement, the Reserve Bank of Australia (RBA) tried to talk down the Aussie yet again, writing: “Further depreciation seems both likely and necessary…” Yet the currency rallied on the RBA’s decision to cut interest rates to 2% (yes, there’s a central bank that’s not at zero!).
Back to Reality?
If market prices are distorted, what will get them back? As just mentioned, the RBA has been keen on weakening its currency. But the RBA is not alone. The most egregious example may well be the Swedish Riksbank: next to the Norwegian Krone, the Swedish Krona was the worst performing major currency in 2014, the central bank says it’s most concerned about currency appreciation versus the euro. It then says that it must drive rates to negative territory and engage in QE because inflation has come down too much. While other central banks have similar narratives, what’s different in Sweden is that, according to the Riksbank’s own press release from their most recent meeting:
- “GDP growth in Sweden is good and the labour market is continuing to improve.”
- “The recovery in the euro area appears to be on firmer ground.”
- “Inflation is rising from low levels.”
- “Inflation expectations have increased”
And yet, they decide that more QE is going to be undertaken. On April 29, when the above press release was issued, the Swedish Krona surged over 2% versus the dollar (and almost 1% versus the euro). The reason? This much hogwash was too much: those “low” inflation numbers are based on headline inflation that includes energy prices. And while those have plunged, the year-over-year drops are going to phase out starting late summer. That is, the one excuse, low inflation, will be dropping by the wayside. As such, we believe the Swedish Riksbank, more so than many others whom might still have the excuse of a weak underlying economy, will have to do a U-turn on policy.
So where does that leave us? Later this summer, various central banks may have to start back-peddling on their ultra-loose policy as inflation is inching up yet again. At this stage, the ECB is shrugging off calls for a premature ending of QE; the reason is obvious: QE is less aimed at inflation, and more at inflation expectations. As such, if there wasn’t an “absolute” commitment to printing money, the fear may be that inflation expectations plunge right back down. As such, expect mostly dovish talk, then a change of heart that might come rather suddenly. We haven’t talked about the UK today, but Bank of England chief Carney is the master at turning on a dime, pardon, penny. Except that in the UK, economic headwinds are actually increasing; their economy, very much dependent on housing, is also vulnerable due to Russian sanctions as oligarchs are no longer gobbling up London real estate (London real estate was long considered a ‘safe haven’ for Russian money).
In the U.S., we might see our first rate hike later this year. But the question will be how much is priced in already and what will be the rate path?
In the context of major revisions that in our assessment may be necessary in much of the world – some to the upside (such as Sweden), some to the downside (such as the UK), it will create opportunities, but also threats. On the threat side, given that positioning in the markets continues to be extreme, two words of caution:
- First, the old adage that markets can stay irrational longer than investors can stay solvent still applies. Momentum based bubbles can take on a life of their own, as the tech bubbles in the 90s and housing bubble last decade showed. I would add to that the 35-year rise in bonds; and also what appears to be a relentless rise in stock prices currently.
- When the tide turns, don’t think you can time it right. Don’t count on a government bailout, either.
Investors may want to consider true diversification to be ready when the tide turns. But that’s not so easy when lots of asset classes have been rising in tandem. Even in the currency space, where we so often praise the merits of diversification, be careful: some of the more successful currency strategies in recent months have been based on momentum. Should risk sentiment change violently in the markets, many of these strategies that appear to provide diversification on paper may all falter at once.
USDCAD Overnight Range 1.2035 -1.2128
USDCAD shrugged off the worst Canadian Trade deficit on record (a $3.0 deficit) and moved lower in tandem with rising WTI prices that broke strong resistance at $60.00/bbl. The oil price rally is occurring despite no evidence of a respite in the glut that precipitated the November collapse. It remains to be seen if the current USDCAD weakness will be maintained in the face of a potentially poor Canadian employment report on Friday, especially if NFP is strong.
Greece was the focus in Europe and is still the focus now. A Reuters report quotes the Greek PM as stating that the May 11 deadline may not be met. The Financial Times says that the IMF may bail on providing more bail-out funds unless European lenders write off a significant chunk of Greece debt. The EU cut its forecast for Greek growth to 0.5% from 2.5% for 2015. EURUSD was sold but it has since bounced.
USDCAD technical outlook
The intraday technicals are bearish. The break of the minor uptrend line at 1.2090, stemming from the April 29th low has shifted the focus to a retest of 1.1960-80. There will be minor support seen at 1.2015. A move above 1.2130 argues for additional 1.2000-1.2200 consolidation
Today’s Range 1.2010-1.2090
Chart: USDCAD 1 hour-Intraday uptrend broken


-
I know Mike is a very solid investor and respect his opinions very much. So if he says pay attention to this or that - I will.
~ Dale G.
-
I've started managing my own investments so view Michael's site as a one-stop shop from which to get information and perspectives.
~ Dave E.
-
Michael offers easy reading, honest, common sense information that anyone can use in a practical manner.
~ der_al.
-
A sane voice in a scrambled investment world.
~ Ed R.
Inside Edge Pro Contributors

Greg Weldon

Josef Schachter

Tyler Bollhorn

Ryan Irvine

Paul Beattie

Martin Straith

Patrick Ceresna

Mark Leibovit

James Thorne

Victor Adair