
Currency
Forex Trading Alert originally published on Apr 16, 2015, 10:39 AM
Yesterday, the Bank of Canada left its monetary policy unchanged (the overnight cash rate at 0.75%), which in combination with a sharp increase in crude oil pushed the Canadian dollar higher against its U.S. counterpart. As a result, USD/CAD broke below important support levels, confirming a bearish formation. How low could the exchange rate go?
In our opinion, the following forex trading positions are justified – summary:
EUR/USD: none
GBP/USD: none
USD/JPY: none
USD/CAD: short (stop loss order at 1.2876)
USD/CHF: none
AUD/USD: none
EUR/USD
The medium-term picture hasn’t changed much as EUR/USD is still trading in a narrow range between the lower border of the declining trend channel and the long-term resistance line, which means that as long as there is no breakout/breakdown, a sizable upward/downward move is not likely to be seen.
Will the daily chart give us clues about future moves? Let’s check. 
Quoting our previous Forex Trading Alert:
(…) the pair invalidated the breakdown under the upper border of the blue declining trend channel and the lower line of the consolidation, which is a positive sign. Additionally, buy signals generated by the indicators remain in place, supporting further improvement.
Yesterday, EUR/USD moved lower and verified the above-mentioned breakout, which was a positive sign that triggered a rebound. Although the pair moved lower earlier today, the exchange rate is still trading above the upper border of the blue declining trend channel (and buy signals remain in place), which suggests another attempt to move higher in the coming days (even if EUR/USD tests its nearest support once again). If this is the case, the initial from our last commentary will be in play:
If (…) the exchange rate moves higher from here, the initial upside target would be the previously-broken orange resistance line (currently around 1.0854).
Very short-term outlook: mixed
Short-term outlook: mixed
MT outlook: mixed
LT outlook: mixed
Trading position (short-term; our opinion): No positions are justified from the risk/reward perspective at the moment.
USD/JPY
The medium-term outlook remains mixed as USD/JPY is still trading in a consolidation (between the Dec high and low) around the 61.8% Fibonacci retracement level (based on the entire 1998-2011 declines). Today, we’ll focus on the very short-term changes.

On Tuesday, we wrote the following:
(…) the green line is still in play and keeps gains in check. Taking this fact into account, and combining it with sell signals generated by the CCI and Stochastic Oscillator, we think that further deterioration is just around the corner. If this is the case, and USD/JPY moves lower from here, the initial downside target would be the previously-broken red declining support line (currently around 119.36). If it is broken, we might see a decline even to 118.71-118.85, where the bottom of the previous pullback is.
Looking at the daily chart, we see that the situation developed in line with above scenario and USD/JPY reached our downside target. Earlier today, the green support zone triggered a rebound, which took the exchange rate above the declining red line. Despite this improvement, sell signals generated by the indicators remain in place, supporting the bearish case. Therefore, in our opinion, today’s increase will be more reliable if we see a daily close above the resistance line.
Very short-term outlook: mixed
Short-term outlook: mixed
MT outlook: mixed
LT outlook: bullish
Trading position (short-term; our opinion): No positions are justified from the risk/reward perspective at the moment.
USD/CAD

In our yesterday’s commentary we wrote:
(…) when we take a closer look at the chart we can see a potential head and shoulders formation. Therefore, if USD/CAD declines below the neck line (the blue support line around 1.2428), it would be a bearish signal, which will likely trigger further deterioration.
As you see on the weekly chart, USD/CAD moved sharply lower and broke below the neck line, which suggests further correction and a drop to around 1.2000, where the size of the downward move will correspond to the height of the formation and where the 38.2% Fibonacci retracement level is.
Are there any short-term support levels that could hinder the realization of the above scenario? Let’s examine the daily chart and find out.

Quoting our last Forex Trading Alert:
(…) the exchange reversed and declined not only below the blue line, but also under the green support line, which suggests further deterioration and another test of the green support zone or even a drop to the lower border of the declining trend channel (currently around 1.2326) in the coming day(s). Please note that this scenario is also reinforced by the sell signal generated by the Stochastic Oscillator at the moment.
On the above chart we see that currency bears pushed USD/CAD lower as we expected. With this downswing the exchange rate broke not only below the green support zone, but also under the lower border of the declining trend channel. Taking the above into account, and combining it with sell signals generated by the indicators and the medium-term picture, we think that further deterioration s more likely than not. Please note that the pair verified yesterday’s breakdown earlier today, which is an additional negative signal. Therefore, in our opinion, the initial downside target for currency bears would be around 1.2040, where the size of the downward move will correspond to the height of the consolidation (on Tuesday, the pair broke below the lower line of the formation, triggering a bearish scenario).
Before we summarize today’s alert we would like to draw your attention to the relationship between the exchange rate and the oil market. The reason? In January, the Bank of Canada surprised markets with an unexpected rate cut, which was “insurance” (in the words of the Governor Stephen Poloz) against the effects of lower oil prices. Meanwhile, since the beginning of the month, the commodity gained almost 18%, which was supportive for the Canadian dollar (in this period of time USD/CAD lost 3%). Therefore, we think that the pair’s further moves will continue to strongly linked to the price of crude oil (if you want to keep up with the changes taking place every day and receive trading signals, we encourage you to read our daily Oil Trading Alerts).
Very short-term outlook: bearish
Short-term outlook: bearish
MT outlook: bearish
LT outlook: mixed
Trading position (short-term; our opinion): Short positions (which are already profitable) with a stop loss order at 1.2876 are still justified from the risk/reward perspective. We will keep you informed should anything change, or should we see a confirmation/invalidation of the above.
Thank you.
Nadia Simmons
Forex & Oil Trading Strategist
Przemyslaw Radomski
Founder, Editor-in-chief
Sunshine Profits: Gold Investment & Silver Investment
Sunshine Profits: Forex Trading
* * * * *
Disclaimer
All essays, research and information found above represent analyses and opinions of Nadia Simmons and Przemyslaw Radomski, CFA and Sunshine Profits’ associates only. As such, it may prove wrong and be a subject to change without notice. Opinions and analyses were based on data available to authors of respective essays at the time of writing. Although the information provided above is based on careful research and sources that are believed to be accurate, Nadia Simmons, Przemyslaw Radomski, CFA and their associates do not guarantee the accuracy or thoroughness of the data or information reported. The opinions published above are neither an offer nor a recommendation to purchase or sell any securities. Nadia Simmons and Przemyslaw Radomski, CFA are not Registered Securities Advisors. By reading Nadia Simmons’s and Przemyslaw Radomski’s, CFA reports you fully agree that they will not be held responsible or liable for any decisions you make regarding any information provided in these reports. Investing, trading and speculation in any financial markets may involve high risk of loss. Nadia Simmons, Przemyslaw Radomski, CFA, Sunshine Profits’ employees and affiliates as well as members of their families may have a short or long position in any securities, including those mentioned in any of the reports or essays, and may make additional purchases and/or sales of those securities without notice.

USDCAD Overnight Range 1.2223-1.2323
The US dollar is Mr.Toad and it has been on a wild ride this morning. Another bout of weak US economic data (Jobless Claims rose, Housing Starts and Building Permits fell) revered hard won US dollar gains in Europe. USDCAD which had scraped back above 1.2310 prior to the data plunged and is now 1.2228, below the overnight low. The break of major support at 1.2330 combined with a re-evaluation of the Canadian economic landscape and the prospect of higher oil prices have triggered a wholesale bail-out of stale Long USDCAD positions.
The overnight session was entertaining. AUDUSD took over where Canada left off in a lively Asian session. Short AUDUSD traders scrambled to cover positions when Australia announced a whopping 37,700 jobs increase and a drop in the unemployment rate to 6.1% from 6.3% and AUDUSD soared. Kiwi followed AUDUSD higher. USDJPY traders saw the carnage in AUDUSD and USDCAD and sold dollars as well. In Europe, EURUSD traders bought dollars and then reversed course just ahead of the New York opening. The US dollar has been offered ever since.
USDCAD technical outlook
The intraday USDCAD technicals are bearish while trading below 1.2270 with the break of the overnight low at 1.2257 pointing to further losses toward 1.2050. Only a move back above 1.2360 would negate the short term downside pressure. For today, USDCAD support is at 1.2220 and 1.2180. Resistance is at 1.2280 and 1.2310
Today’s Range


Falling oil prices might have been last year’s big story. But 2015 is all about the greenback.
After all, the U.S. dollar’s reach is bigger than just the commodity markets. (But we will look at its impact on gold and oil in just a few moments.)
The thing is, you can’t talk about global growth, inflation, interest rates or corporate earnings without taking the buck into account.
And with the U.S. Dollar Index up 25% since last summer, we have about 9 trillion reasons why the “almighty dollar” affects everything we do … and how we invest.
Since 2009, roughly $9 trillion in dollar-denominated debt has been issued in foreign branches of U.S. banks or in foreign banks.
With a dollar that is worth about 25% more, those loans and interest rates have also increased by 25%.
Think about this …
A $1 million loan at 10% has increased to about $1.25 million. And the interest rate has essentially increased to about 12.5%.
These loans have to be paid back in full. But if slow economic growth around the world would result in a global recession, we could see a rise in defaults.
After all, other currencies haven’t risen in tandem with the dollar. Nor has the dollar increased 25% against these currencies.
The dollar has risen relative to most of them.
The U.S. Dollar Index reflects the dollar’s exchange value against a basket of our trading partners’ currencies — the euro, British pound, Canadian dollar, Mexican peso, Chinese yuan, Australian dollar and others.

It’s important to note that the dollar has appreciated against some currencies more than others.
For example, according to the map above, the greenback is up 31% against the euro, but down 0.08% against the Chinese yuan.
Why the Greenback Has Gained
The dollar has rallied more than 40% off its low of 70 made in 2008.
The greenback was range-bound between 2008 and 2014. The rally picked up speed last December.
It consolidated the move in February before accelerating again.
Take a look at the PowerShares DB U.S. Dollar Bullish ETF (UUP):

There are plenty of reasons for the dollar’s rise: QE ending, stronger economic growth and speculation about rising interest rates.
On top of that, we are attracting foreign capital because of better economic growth than many other countries. This adds to the safety and liquidity of the dollar.
However, there is one other factor.
As we saw when oil was falling, it looks like the futures market is driving prices.
Only in the greenback’s case, it appears to be driving them higher.
Big Bets on the Buck
Keep in mind that the $9 trillion in dollar-denominated debt is held by borrowers outside the United States.
Dollar-denominated deposits at banks outside the U.S. are known as Eurodollars. That’s because many are held in Europe, where they are generally free of regulation.
Below is a table from Barron’s that shows the activity of the Eurodollar futures market.

The Eurodollar saw the most contracts traded during the last week of March, compared to gold and oil.
I’ve circled where large speculators were long 1.7 million contracts. At the same time, small traderswere short nearly 1.3 million.
But that’s not where the biggest action is.
Before we get to it, keep in mind that the futures market has a couple of key functions:
• To shift the risk from producers to risk-takers
• To set asset prices for buyers and sellers
If you look at the above table, most of the contracts belong to commercial hedgers, as they try to reduce their price and currency risk.
Here, we can see 6 million long and 6 million short contracts.
How Much Higher Could the Dollar Go?
Here’s a quick lesson on dollar futures. If the price of the U.S. Dollar Index is at 100, then the futures contract is worth about $100,000.
The Dollar Index traded at 98.7 yesterday. So that would put it at roughly $98,700. (Simply multiply $1,000 times the index value.)
The margin requirement is only about $1,950. So, this tremendous leverage attracts speculators.
Large speculators, deemed as the “smart money,” have more long contracts. Also long contracts have increased, and the shorts decreased.
Speculators and traders dominate the rest of the futures markets due to significant leverage in that area.
So, these aren’t investors driving the prices. Rather, traders are taking advantage of the large leverage that the futures market offers.

On the charts, there is overhead resistance at 100.
If the dollar can break above it, we could see it rally to 105. This would match its highs in the 1990s.
It’s possible that speculators could drive the dollar above 105, but my research tells me that the dollar would be overvalued if this happens.
The Benefits of a Strong U.S. Dollar
A strong dollar is a good thing for consumers as it makes foreign goods and services cheaper.
For example, if you want to take a vacation to Europe, now might be a good time. That’s because it’s about 30% cheaper to do now than it was in 2013.
However, you probably don’t have to rush to book that trip.
That’s because domestic producers and service providers will have to keep prices lower to compete against cheaper foreign goods and services.
This should keep a lid on U.S. inflation and, therefore, interest rates.
In fact, studying the Fed’s every word isn’t the only way to determine its direction on raising interest rates.
In their last news conference, Federal Open Market Committee members said they would be cautious about raising rates.
They understand the potential disruptions the strong dollar could have on the global economy, including dollar-denominated loans.
Why a Strong Buck is Bad for Blue-Chips
However, a strong dollar can be bad news for U.S. blue-chips that do big business overseas.
After all, foreign buyers will need more of their home currency to buy U.S. goods and services.
The stronger dollar and higher-priced U.S. goods and services should lead to weaker sales.
What’s more, U.S.-international companies face a currency conversion loss that happens when a weaker foreign currency sale needs to be converted into a stronger dollar.
With Q1 earnings season starting to pick up momentum, we will soon start to see the effects of the stronger dollar on U.S. multinationals.
What a Strong Dollar Does to Gold
Last but not least, a strong dollar could hurt gold and oil recovery in the short run.

In the Yahoo! Finance chart above, year-to-date UUP (the top pink line) has gained 8.45%. Meanwhile the SPDR Gold Trust (GLD), center blue line, has only added 0.78%. And the U.S. Oil Fund (USO), the bottom red line, is down 7.39%.
When it comes to the dollar-oil relationship, it is an overstated one. Even though the dollar is stronger than the euro by about 30%, oil prices are down about 50%.
In other words, the drop in oil prices is greater than the appreciation of the dollar. So, the dollar shouldn’t affect demand.
As for gold, if the dollar moves above 105, gold could make new lows.
Remember, the all-in cost for gold is about $1,100. Below that price, producers will probably cut production and supply and demand can eventually achieve equilibrium and price stability.
As for the dollar, the futures market and many others suggest it can head higher from here.
My take is that the latest rally has been almost parabolic. This type of move is generally not sustainable when the U.S. doesn’t have a major economic trend like the Internet boom to boost growth and wealth.
However, I’m going to keep a close eye on the futures markets. If the “smart money” is going long the dollar here in the short term, it may be a good bet that other money is going to follow.
Good Investing,
Dan Hassey

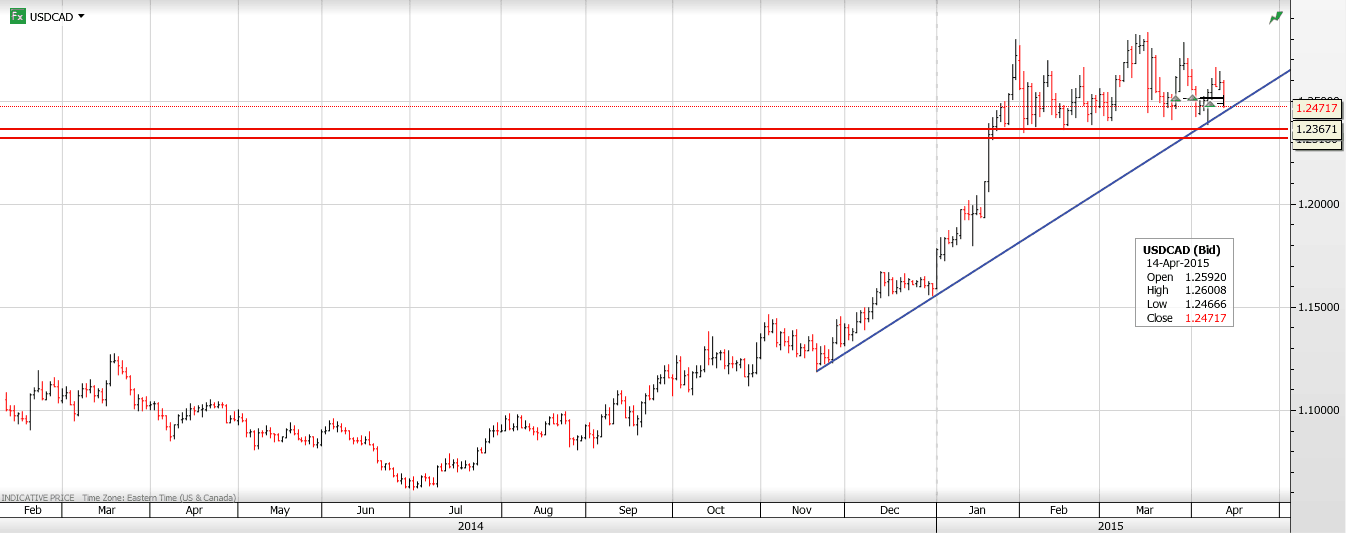
USDCAD Overnight Range 1.2472-1.2600
US Retail Sales in March substantially outpaced those in February but FX traders were not amused. In fact, judging by the plunge in the US dollar against the majors, they were rather irked. It wasn’t that the data was bad, but rather it was because it missed the forecasts. For those keeping score, two big pieces of data (NFP, Retail Sales) and two big misses equals rates on hold for a lot longer than anticipated. Having said that, there is still a lot of wood to chop before September, which is still a viable rate hike month.
Overnight markets were rather subdued awaiting this morning’s release of US Retail Sales. Koichi Hamada, the advisor to Japan’s President Abe, who caused a minor kerfuffle in USDJPY yesterday by suggesting 105.00 was an appropriate level has backtracked. He now says that the level may be appropriate but that USDJPY is going lower and has returned to obscurity.
Traders in Europe mostly ignored a large amount of data from the Eurozone while UK traders briefly sold GBPUSD on the inflation report.
Once again USDCAD bulls are being squeezed with stop losses triggered on the break of 1.2540 and again at 1.2510. The soft US dollar vs. the majors, steady and firm WTI prices and a bit of position adjustment ahead of the BoC meeting tomorrow are behind the move.
USDCAD technical outlook
Today’s drop in USDCAD from 1.2600 to 1.2470 is approaching the short term uptrend line from November in the 1.2430-50 area. A break below 1.2440 risks a retest of major support in the 1.2330-50 area. If that level breaks it is a straight drop to 1.2050. Only a bounce above 1.2510 negates the downward pressure.
Today’s Range 1.2450-1.2510
 Here’s one for the “seriously, you’re surprised?” file: China pegs its currency, the yuan, to the dollar, the dollar soars, taking the yuan with it…and fewer foreigners buy suddenly-much-more-expensive Chinese products. Duh.
China’s Export Engine Loses Steam, Adding to Growth Pressure
“China’s exports unexpectedly slumped last month, eroding the outlook for one of the economy’s better performing areas in recent months.
Overseas shipments fell 14.6 percent in March from a year earlier in yuan value, the customs administration said in Beijing on Monday. That compared with the median estimate for an 8.2 percent rise in a Bloomberg News survey of analysts. Imports slid 12.3 percent, leaving a trade surplus of 18.16 billion yuan ($3 billion).
The export declines come as China grapples with overcapacity and a property slump. The country’s central bank has relaxed rules on home purchasing, cut interest rates twice and reduced the ratio of reserves banks are required to set aside in the past six months, with economists forecasting further stimulus.
“Consumption is weak, investment is decelerating, and now exports have come in as weaker-than-expected,” said Liu Xuezhi, an economist with Bank of Communications Co. in Shanghai. “Downward pressure on economic growth is increasing, making it more urgent for the government to start rolling out more pro-growth policies.”
The Hang Seng index in Hong Kong pared gains after the release and the Australian dollar, seen as a proxy for China’s economy due to Australia’s shipments of raw materials, fell.
Gross domestic product data scheduled for Wednesday will probably show the economy expanded 7 percent in the first quarter from a year earlier, according to the median estimate of 38 economists in a Bloomberg survey as of April 10. That would be the slowest pace since the first quarter of 2009.
The “dismal” March export performance comes despite a higher number of working days and a low base and will spur fears that foreign demand is being undermined by a stronger yuan, Dariusz Kowalczyk, senior economist at Credit Agricole SA in Hong Kong, wrote in note after the release.
The yuan may weaken and onshore rates will be lowered, he wrote. “Odds are also rising for more government stimulus.”
So the question isn’t whether Chinese exports should fall — obviously when you raise the value of your currency by 25% the stuff you’re selling becomes more expensive and fewer orders get booked. It’s why would economists expect exports to rise by 8% in the face of a soaring yuan and slowing growth pretty much everywhere else. See Is The Whole World Slowing Down?
Or maybe there’s a deeper strategy at work. Assume that the leveraged speculating community which, since it includes the money center banks, employs most of the high-profile economists whose estimates get quoted by reporters, is desperate for more easy money to bail out their bad derivatives bets. What better way to get it than to produce ridiculously optimistic estimates of Chinese growth which are then “missed” by a mile, leading to panicked calls for more stimulus. Now it all makes sense.

-
I know Mike is a very solid investor and respect his opinions very much. So if he says pay attention to this or that - I will.
~ Dale G.
-
I've started managing my own investments so view Michael's site as a one-stop shop from which to get information and perspectives.
~ Dave E.
-
Michael offers easy reading, honest, common sense information that anyone can use in a practical manner.
~ der_al.
-
A sane voice in a scrambled investment world.
~ Ed R.
Inside Edge Pro Contributors

Greg Weldon

Josef Schachter

Tyler Bollhorn

Ryan Irvine

Paul Beattie

Martin Straith

Patrick Ceresna

Mark Leibovit

James Thorne

Victor Adair