
Currency
The Reserve Bank of Australia left its benchmark interest rate at a record-low of 2.50%, which pushed the Australian dollar higher against the greenback. As a result, AUD/USD bounced off yesterday’s fresh 2014 low, but will we see further rally?
EUR/USD
The medium-term picture hasn’t changed much as EUR/USD is still trading around the 127.2% Fibonacci extension. What can we infer from the very short-term picture? Let’s examine the daily chart and find out.

Looking at the above chart, we see that altough EUR/USD moved higher yesterday, the combination of the lower border of the rising trend channel and the declining blue resistance line stopped further improvement, triggering a pullback earlier today. What does it mean for the exchange rate? In our opinion, as long as the blue resistance line is in play, a sizable rally is not likely to be seen. Additionally, when we take a closer look at the daily chart, we can see that the exchange rate has been trading in a triangle (marked with blue) in the recent days. This means that if the pair drops below the lower line of the formation, we’ll see a test of the strength of Nov 25 low of 1.2399. However, taking into account the height of the triangle, it seem that we could even see a drop to the recent lows in the coming week.
Very short-term outlook: mixed with bearish bias
Short-term outlook: mixed
MT outlook: mixed
LT outlook: bearish
Trading position (short-term): In our opinion no positions are justified from the risk/reward perspective at the moment.
USD/CAD

Larger Image

Larger Image
The first thing that catches the eye on the above chart is a breakout above the upper line of the declining trend channel. In our Forex Trading Alert posted on Nov 24, we wrote that such price action could trigger an increase to around the Nov high, which turned out to be correct. Despite this improvement, the strong resistance area seen on the weekly chart (created by the upper line of the rising wedge and the 127.2% Fibonacci extension) successfully stopped further rally. As a result, USD/CAD reversed and declined sharply to the short-term green support line (based on the Sep 19 and Oct 29 lows). As you see on the weekly chart, with this move, the exchange rate invalidated earlier breakout above the upper line of the red rising trend channel – similarly to what we saw at the beginning of Nov. Back then, such price action triggered a correction, which suggests that we could see further deterioration in the coming week. In our opinion, this scenario will be even more likely if the pair drops below the above-mentioned short-term green support line. In this case, the initial downside target would be around 1.1265, where the 23.6% Fibonacci retracement and the previously-broken upper line of the declining trend channel (marked with brown on the daily chart) are. Nevertheless, taking into account the current position of the indicators (the CCI and Stochastic Oscillator generated sell signals), it seems that currency bears will try to go lower in the coming days. If this is the case, the next target would be the bottom of the previous correction (the Nov 21 low of 1.1190).
Before we move to the next currency pair, we would like to draw your attention to the link between the Canadian dollar and crude oil. In the previous week, the Canadian currency moved sharply lower against the greenback weakened mainly by falling oil prices. Meanwhile, yesterday’s rebound in the commodity had a positive impact on the Canadian dollar and strengthened it against its U.S. counterpart. What does it mean for USD/CAD? Taking into account the current picture of crude oil (you can read more about it in our Oil Trading Alerts), we think that the loonie will increase, which will translate to the lower values of USD/CAD in the coming days.
Very short-term outlook: mixed with bearish bias
Short-term outlook: mixed with bearish bias
MT outlook: bearish
LT outlook: bearish
Trading position (short-term): In our opinion no positions are justified from the risk/reward perspective at the moment.
In our opinion, the following forex trading positions are justified – summary:
AUD/USD

From this perspective, we see that AUD/USD extended losses and hit a fresh 2014 low yesterday. With this downswing, the pair reached the 127.2% Fibonacci extension, which could pause or even stop further deterioration. The reason? Many times in the past this extension has triggered a trend reversal (you can see an example of such price action on the weekly chart of USD/CAD). Therefore, taking into account the fact that history repeats itself and combining it with the current position of the indicators (the CCI and Stochastic Oscillator generated buy signals), it seems that we could see a rebound from here in the coming days. At this point, it’s worth noting that this scenario is also reinforced by the medium-term picture.

As you see on the weekly chart, although AUD/USD broke below the 50% Fibonacci retracement based on the entire 2008-2011rally (a bearish signal), the lower border of the long-term declining trend channel is quite close and it seems strong enough to stop further deterioration in the coming week.
Very short-term outlook: mixed
Short-term outlook: mixed
MT outlook: mixed
LT outlook: mixed
Trading position (short-term): In our opinion no positions are justified from the risk/reward perspective at the moment.
Thank you.

Despite the junior resource sector being near a major bottom and going through a bear market of epic proportions, I still believe that this may be one of the best times to add to quality positions. Nothing perfects one’s craft in the financial markets like a bear market. In a bear market one has to refine their skills in stock picking. The emergence of a new bull market is usually the most propitious time for outsized gains.
Investing in stocks is easy if you follow the rules that have proven to be successful over time. The number one rule is buying low and selling high. Many investors are chasing the US dollar (UUP) and Large Cap Equities (SPY) to record heights liquidating all their junior miners (GDXJ). Be careful of selling low the junior miners and buying assets such as US bonds (TLT) and large caps (DIA) at record high valuations.
In 2011, the herd mentality pushed silver and gold to record values selling all their stocks before a multi-year correction ensued. See my article back in 2011 which was published on Seeking Alphawhich warned about the precious metals market overheating and my video analysis from August 2011 forecasting a bottom in the S&P500.
The opposite tactic should now be considered of liquidating large cap equities, real estate and the US dollar and build positions in junior resource stocks that are extremely high quality and compelling takeout targets. Gold (GLD) and silver (SLV) could gap higher by the end of 2014 and the top notch juniors could skyrocket.

Its not just me that sees the value in gold, but entire nations. The Swiss voters decided not to back the Franc with a 20% gold reserve with a pledge never to sell its gold again. However, it is important to be encouraged that people are beginning to be concerned about fiat currency and foreign exchange manipulation. The Swiss made a mistake back in 1999 to drop their gold backing.
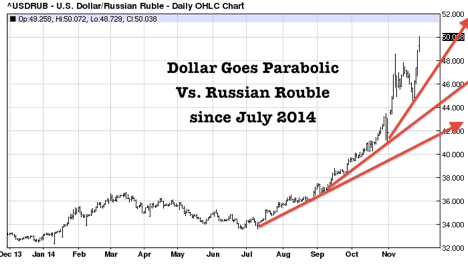
Look at the Russians who bought close to 19 tons in October. The Russian Rouble is crashing along with the economy due to the Ukraine standoff and record low oil prices. Smart investors should be adding precious metals and energy to their portfolio instead of expensive US dollars. Demand in China and India is still strong for gold and silver as evidenced by record coin sales and numismatic premiums rising.
Could the Russian economic collapse spark a global rush to buy physical gold and silver by other nations and sovereign wealth funds? Eventually, a change in psychology for precious metals could affect our junior mining positions trading at pennies on the dollar to see explosive gains.
Many Central Banks around the world have a zero or negative interest policy. This expansion of fiat currency on the market has never occurred before yet investors are flocking to the US dollar in record proportions. However, smart investors are already positioning ahead of the masses. When the US dollar bubble pops and follows other currencies lower, then gold and silver may appear as the new safe haven. It is at this time where our junior miners which are trading at pennies could be trading for dollars.
When this financial event occurs it will be too late to buy. One has to prepare ahead of the storm. The sages ask who is wise? One who sees the future. Its easy to recognize what’s happening now. Being able to see the developing storms ahead and acting upon it before it hits is the challenge. The rebound in precious metals could be one of a series of gaps higher. Right now look for a rally to begin when the recent downtrend in gold since July is broken to the upside at $1205.
For the past 70 years, Americans have lived in economic luxury like we have never seen before in human history. This has been due to huge increases in debt and borrowing. The Roman emperor’s would be jealous of the average American and Monday Night Football. More Americans care about the top Quarterback ratings rather than the debt level. Only a small minority of Americans and Swiss are concerned about the dangerous debt levels in Europe, Japan and the United States.
Now the dollar is strong against other currencies. Some incorrectly believe this is true to the strength of the US economy. The only reason the US dollar is rising is because all the other currencies are weak. The Japanese and Europeans have been turning on the printing presses to maximum for the past few months. Don’t be surprised to see credit rating changes to these nations.
The US may be on the verge of another economic crisis. In addition, there is a growing chasm between the races in the United States. Look at the violence and looting in Ferguson, Missouri. Watch the protests in Hong Kong as well.
We are in an environment which could destroy the banks. They are scared as they are still sitting on hundreds of millions of bad loans. Don’t be misdirected by the new age economists who say deficits and soaring debts are not such a big deal. Eventually, the piper must be paid and not with fiat money but with real money such as gold and silver that has maintained its value for thousands of years.

 Last week saw the global financial system tip from delusion — where it had happily drifted for several years — into chaos. Consider the following more-or-less randomly chosen data points:
French unemployment hits record high
Italian unemployment hits record high
Oil’s price falls by $10.36/bbl, or 13.5%, in a single day, to its lowest price since 2010.
Copper falls by 6% to $2.86/lb, 25% below its 2013 high.
European bond yields fall to record lows. Even Italy, with government debt exceeding 130% of GDP, can now borrow for around 2%. Japan, meanwhile, issues bonds with negative interest rates.
European inflation approaches zero, with several member states apparently already in deflation.
Emerging markets see the opposite trend, as a soaring dollar causes their currencies to fall and inflation to spike. The Russian ruble falls by 7.3% to a record low, while the currencies of Brazil, Colombia, Mexico and Chile drop by at least 1.9%. See Brazil’s Rousseff vows immense effort to slow inflation.
Chinese malinvestment, a topic of conversation ever since those ghost city pictures started circulating, is pegged at $6.8 trillion, or about 70% of China’s entire economy.
As Prudent Bear’s Doug Noland put it his November 28 Credit Bubble Bulletin, “Collapse of the ‘global reflation trade’ runs unabated. Where might contagion strike next?”
The answer is in one final set of stats: Last week the S&P 500 and Dow Jones Transports hit record highs, while the Nasdaq 100 index of tech stocks rose to its highest level since March 2000, just before its epic crash.
If everything but equities is being sucked into a 2008-style deflationary vortex, how much longer can US stocks hold out? Probably not long.

The Highest RSI in 14 years –
Today’s videos:
US Dollar The Buck Stops Here Charts Analysis
Gold Cost Of Production Bounce Charts Analysis
Silver Three Times Lucky Charts Analysis
GDX Full Stokes Buy Signal Charts Analysis
GDXJ Is A Bit Sluggish Charts Analysis
Thanks,
Morris
Friday, Nov 28, 2014 Super Force Signals special offer for Money Talks Readers:
Send an email to trading@superforcesignals.com and I’ll send you 3 of my next Super Force Surge Signals free of charge, as I send them to paid subscribers. Thank you!
The SuperForce Proprietary SURGE index SIGNALS:
25 Surge Index Buy or 25 Surge Index Sell: Solid Power.
50 Surge Index Buy or 50 Surge Index Sell: Stronger Power.
75 Surge Index Buy or 75 Surge Index Sell: Maximum Power.
100 Surge Index Buy or 100 Surge Index Sell: “Over The Top” Power.
Stay alert for our surge signals, sent by email to subscribers, for both the daily charts on Super Force Signals at www.superforcesignals.com and for the 60 minute charts at www.superforce60.com
About Super Force Signals:
Our Surge Index Signals are created thru our proprietary blend of the highest quality technical analysis and many years of successful business building. We are two business owners with excellent synergy. We understand risk and reward. Our subscribers are generally successfully business owners, people like yourself with speculative funds, looking for serious management of your risk and reward in the market.
Frank Johnson: Executive Editor, Macro Risk Manager.
Morris Hubbartt: Chief Market Analyst, Trading Risk Specialist.
website: www.superforcesignals.com
email: trading@superforcesignals.com
email: trading@superforce60.com
SFS Web Services
1170 Bay Street, Suite #143
Toronto, Ontario, M5S 2B4
Canada
###
Nov 28, 2014
Morris Hubbartt
 I’d like to share a Demographics trade that is unique for three reasons:
- It’s the closest thing many investors will see to a “home run” in their investing lifetimes. That’s because the global variables driving it are irreversibly locked into place. In fact, I think this investment I’m about to show you could easily double from here.
- The biggest money on the planet is involved – more than $5.3 trillion a day – so with this trade, you’re going with the tide rather than against it. (To give you some perspective, the world’s equity markets trade less than $300 billion a day… so, roughly speaking, we’re talking about a trend that’s 16.7x bigger than the total transaction volume for every stock on the planet combined. )
- And finally, it’s backed by a government that refuses to lose.
I thought you might be… let’s get started.
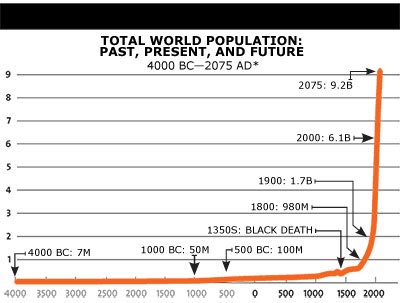
Trend #1: Demographics
….continue reading HERE


-
I know Mike is a very solid investor and respect his opinions very much. So if he says pay attention to this or that - I will.
~ Dale G.
-
I've started managing my own investments so view Michael's site as a one-stop shop from which to get information and perspectives.
~ Dave E.
-
Michael offers easy reading, honest, common sense information that anyone can use in a practical manner.
~ der_al.
-
A sane voice in a scrambled investment world.
~ Ed R.
Inside Edge Pro Contributors

Greg Weldon

Josef Schachter

Tyler Bollhorn

Ryan Irvine

Paul Beattie

Martin Straith

Patrick Ceresna

Mark Leibovit

James Thorne

Victor Adair