
Currency

Investors Intelligence has been publishing their survey of investment advisors and newsletter writers since 1963. The initial presumption was that when all of the smart guys started leaning one way, then that was the way to lean. But they quickly found that when even the smart guys are all convinced one way or the other, the market was more likely to move the other way. Since then, the Investors Intelligence spread between %Bulls and %Bears has become a favorite contrarian sentiment indicator for a lot of people.
The chart above shows that bull bear spread. Investors Intelligence surveys approximately 200 newsletter writers and investment advisors, and classifies them as either (1) Bullish, (2) Bearish, or (3) “Correction”. The chart above portrays the spread between the percentage of bulls and that of the bears. You may notice that all of the readings for the past 2 years have been positive, meaning that there have been more bulls than bears. We have to go all the way back to 2011 (not shown) to find an instance when the bears outnumbered the bulls, and that was right after a post-QE2 19% decline in the SP500.
[You May Also Like: Technician Craig Johnson: S&P 2100 by Year End]
Added to that chart above are a set of 50-1 Bollinger Bands. That’s shorthand for saying that the upper and lower bands are each set 1 standard deviation above and below a 50-day simple moving average. One quick and easy way to make use of the Investors Intelligence data is to observe when it goes above the upper band or below the lower band. But excursions outside the bands are not the same going up or going down. Very deep excursions below the lower band tend to mark nice bottoms. But excursions above the upper band often appear early in a price up move. The moment of dropping back down below the upper band is a better sign of a price top.
Investors Intelligence publishes their survey data weekly. There are two separate lags involved. The first is that it takes the subjects of this survey some amount of time to change their opinions on the market based on price action. The second lag comes from the reporting of those changes in opinion to their subscribers, and thus to Investors Intelligence (II), plus II’s own lag in tabulating and publishing their results. So it should be understood that that the II data will lag price movements by some period.
One other point you might notice is that sometimes the weekly change is very small, and other times it is a really big change. To help see that better, this next chart looks at the weekly change in the Bull-Bear spread.

Very low readings usually mark important price lows, like the one we just saw in mid-October, when the Bull-Bear spread fell from 31.4 percentage points to 17.1 in just 2 weeks. But very high readings have a different meaning, or at least that is the case when the market is in an uptrend. The sudden surges toward the bullish side are a sign of strong upward initiation, or at least that is the case when the market is an uptrend. So here is the buried lede: The recent flip back to bullish is a sign of the initiation of a strong new uptrend.
But this interpretation really only works during uptrends. When the stock market is in a downtrend, the data work in a different way. Here is the same weekly change in the Bull-Bear spread, shown from 2007-2011.

During downtrends, the rapid countertrend rallies tend to climax at the point when the II data shows a big shift back to bullish. High weekly change readings that appear when the SP500 is below its 200-day moving average have a different meaning from the same type of reading seen during an uptrend.
The current market is still arguably in an uptrend, having recovered from a very brief dip below the 200MA. And so the most recent big positive spike in this weekly change indicator should more appropriately be interpreted as a sign of new upward initiation, as opposed to a failing effort during a countertrend rally. That’s a useful piece of information right there.
Related Charts
|
Oct 23, 2014 |
May 29, 2014 |
Oct 18, 2013 |


Quotable
“Our doubts are traitors and make us lose the good we oft might win by fearing to attempt.”
William Shakespeare
Commentary & Analysis
Was it a Hail Mary pass from Japanese Prime Minister Abe?
Did you read about the Bank of Japan (BOJ) surprise last night? Let me just say, I was surprised, as I have been expecting the yen to strengthen.
This is likely the mother of Hail Mary passes by Prime Minister Abe & Co. Success or failure of his government hangs in the balance, I suspect. I’ll explain in a moment.
 Now back to the BOJ …please click here to view the issue
-Jack Crooks
October 30, 2014, 11:12 AM EUR/USD Double Bottom Or New Lows? USD/CAD USD/JPY AUD/USD GBP/USD USD/CHF
Yesterday, the U.S. dollar strengthened against other major currency pairs after the Fed said it would end its monthly bond-buying program but keep rates near zero for “considerable time”. As a result, EUR/USD declined below the medium-term resistance zone, which triggered a sharp decline to sligthly above the recent lows. Will they withstand the selling pressure and we’ll see a double bottom in the coming days?
Click on EUR/USD image for Larger Charts & Analysis of 6 Currency Pairs
EUR/USD

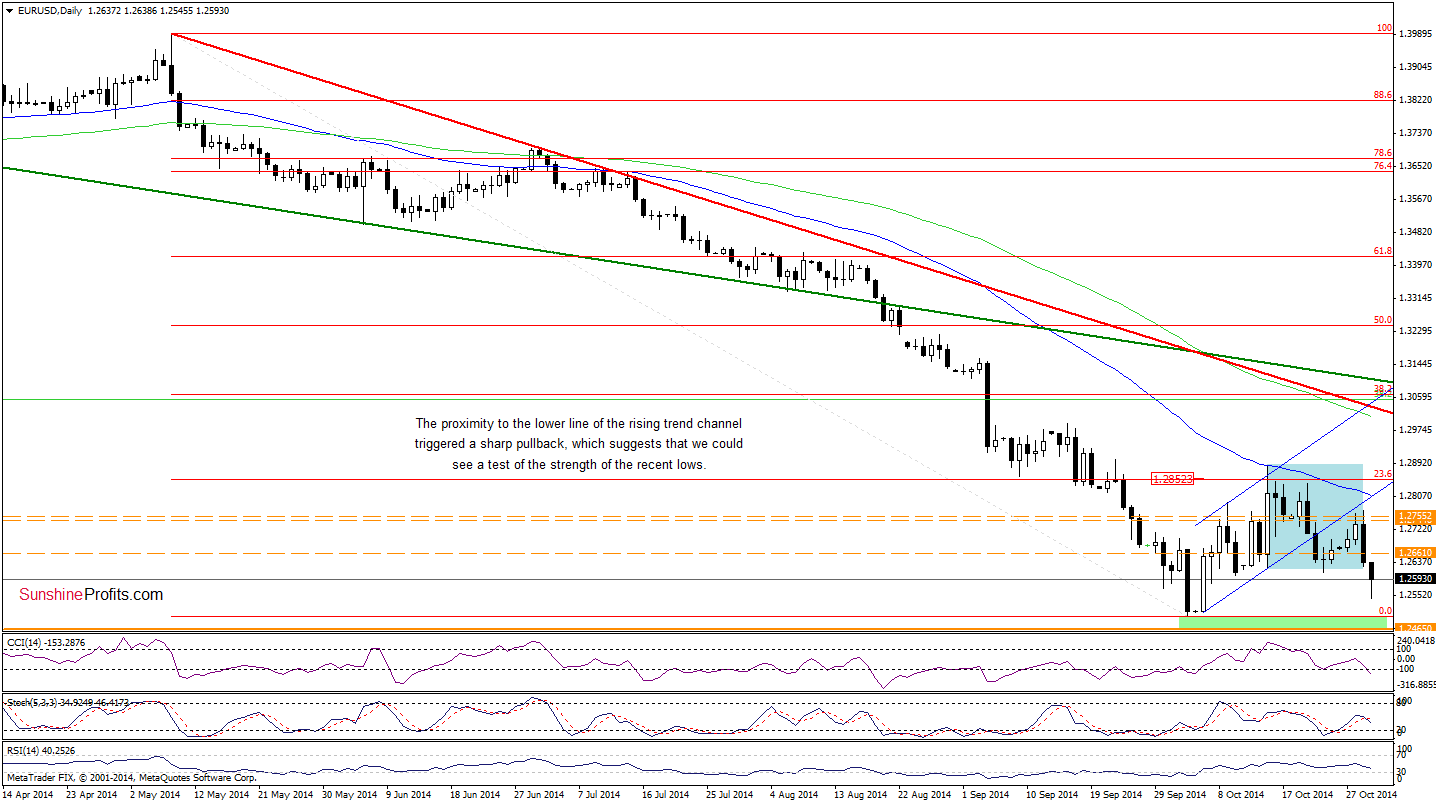
The situation in the medium term has deteriorated as currency bulls didn’t manage to push EUR/USD above the orange resistance zone (created by the Apr and Jul 2013 lows and the 61.8% Fibonacci retracement), which triggered a sharp decline that took the exchange rate to slightly above the recent lows. Will we see further deterioration? Let’s take a closer look at the daily chart and find out.
Quoting our previous Forex Trading Alert:
(…) although EUR/USD extended gains and climbed above yesterday’s high, the exchange rate still remains under the lower line of the rising trend channel. (…) as long as there is no breakout, the recent upward move could be nothing more than a verification of the breakdown.
As you see on the above chart, the situation developed in tune with our assumption as the lower border of the rising trend channel in combination with the orange resistance zone (marked on the weekly chart) successfully stopped the rally, triggering a sharp decline. In this way, the breakdown was verified, which is a bearish signal that suggests a test of the recent lows – especially when we factor in a breakdown below the lower border of the consolidation (marked with blue).
Very short-term outlook: mixed
Short-term outlook: mixed
MT outlook: mixed
LT outlook: bearish
Trading position (short-term): In our opinion, no positions are justified from the risk/reward perspective at the moment. We will keep you informed should anything change, or should we see a confirmation/invalidation of the above.
USD/JPY
The situation in the medium term has improved as USD/JPY bounced off the long-term rising support line. How this move affected the very short-term picture?
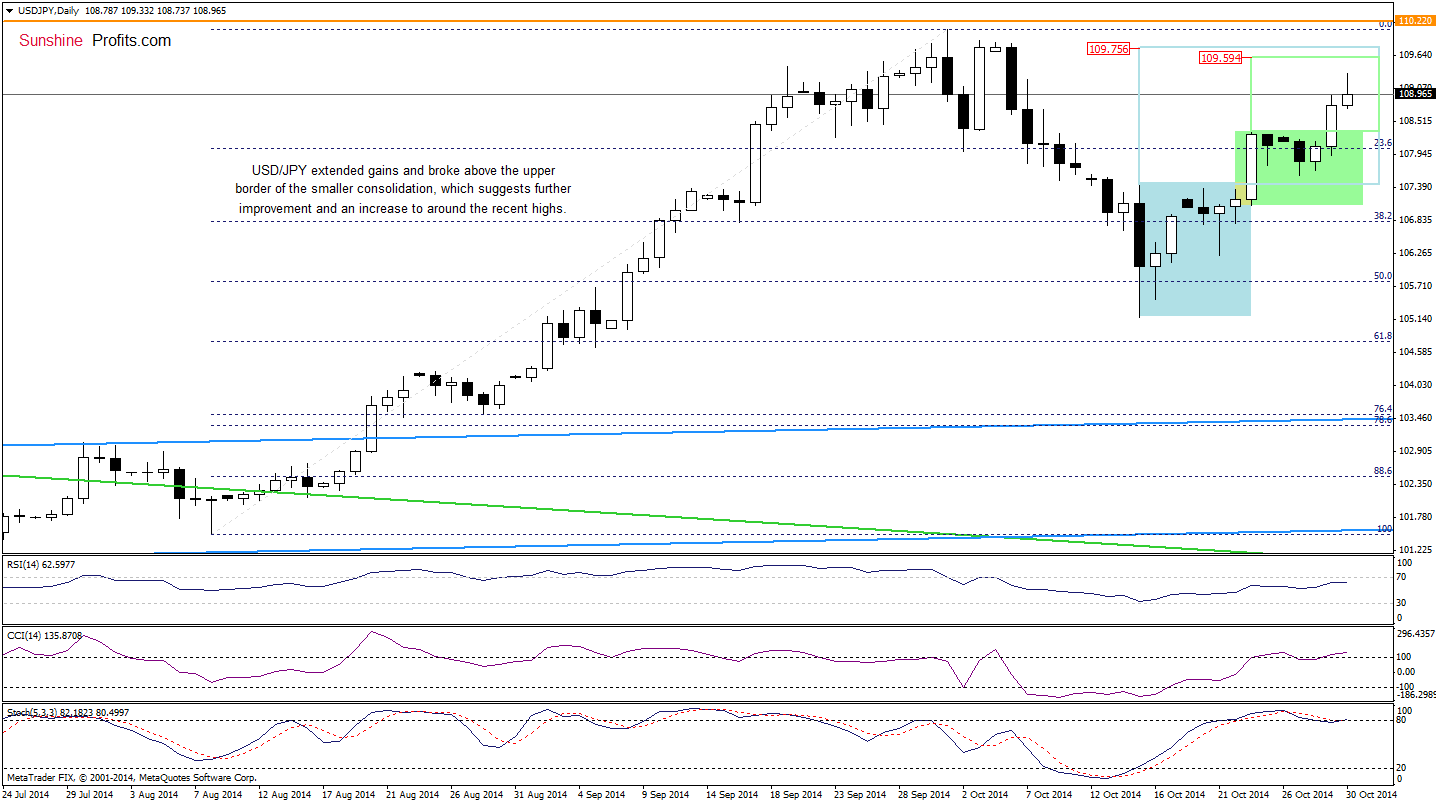
Looking at the above chart, we see that after several days in a consolidation range (marked with green), USD/JPY moved higher once again, breaking above the upper line of the formation. This is a positive signal, which suggests further improvement to 109.59 or even to 109.75, where the size of the upward move will correspond to the height of the green or blue consolidation.
Very short-term outlook: bullish
Short-term outlook: mixed with bullish bias
MT outlook: mixed
LT outlook: bearish
Trading position (short-term; our opinion): No positions are justified from the risk/reward perspective at the moment. We will keep you informed should anything change, or should we see a confirmation/invalidation of the above.
USD/CAD
The medium-term picture hasn’t changed much as USD/CAD is still trading under the upper line of the rising trend channel. Today, we’ll focus on the very short-term changes.
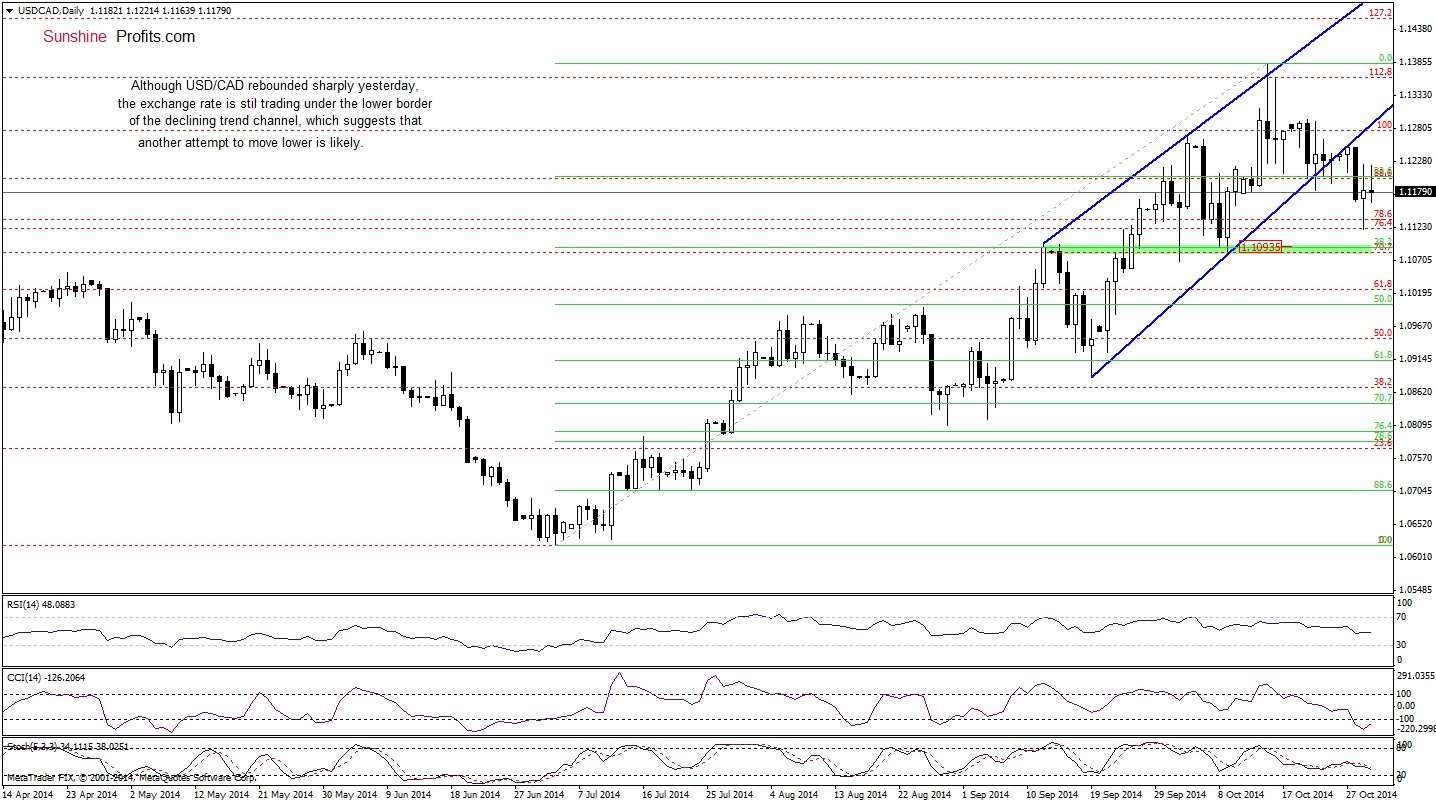
From this perspective, we see that although USD/CAD extended losses yesterday, the pair rebounded sharply and erased almost 80% of Tuesday’s decline. Despite this improvement, the exchange rate is still trading below the lower border of the rising trend channel, which means that as long as there is no invlidation of the breakdown another attempt to move lower should not surprise us. If this is the case, the initial downside target would be around 1.1093, where the 38.2% Fibonacci retracement (based on the entire Jul-Oct rally) and the green support zone (marked on the daily chart) are.
Very short-term outlook: bearish
Short-term outlook: mixed with bearish bias
MT outlook: mixed with bearish bias
LT outlook: bearish
Trading position (short-term; our opinion): No positions are justified from the risk/reward perspective at the moment. We will keep you informed should anything change, or should we see a confirmation/invalidation of the above.
Thank you.
Nadia Simmons
Forex & Oil Trading Strategist
Przemyslaw Radomski, CFA
Founder, Editor-in-chief
Gold & Silver Trading Alerts
Forex Trading Alerts
Oil Investment Updates
Oil Trading Alerts

Get used to the headlines like the one below. You’re going to hear hundreds of US multinational companies blame their profit shortfalls on the strong dollar.

Revenue Miss #1: Lockheed Martin rose sharply after reporting better-than-expected quarterly profits. However, their $11.11 billion of sales for the quarter missed the $11.28 billion forecast and was a 2% year-over-year decline from Q3 2013.
Revenue Miss #2: eBay earned one penny more than expected, but its revenues of $4.35 billion missed expectations for $4.37 billion.
Revenue Miss #3: SanDisk reported better-than-expected profits, but its revenue of $1.75 billion was a little short of the $1.76 billion forecast. More importantly, SanDisk told Wall Street to lower its Q4 revenue expectation to between $1.8 billion to $1.85 billion, below estimates of $1.88 billion.
Revenue Miss #4: IBM, which I lambasted a couple weeks ago, delivered $22.4 billion of sales, a pathetic 3% year- over-year decline and below the $23.37 billion consensus forecast.
Revenue Miss #5: Wall Street liked a better-than-expected profit report from General Motors. GM beat profit expectation by two cents, but revenues did not fare as well; GM had $39.3 billion of quarterly revenues, but Wall Street analysts had forecasted sales of $39.5 billion.
Revenue Miss #6: Coca-Cola, the world’s largest beverage maker, said that net income for its Q3 ended September 26 was $2.1 billion, or 48 cents a share—down from $2.4 billion, or 54 cents a share, a year earlier.
Coca-Cola reported quarterly revenue of $12 billion, a flat performance from the previous quarter. Year to date, the company’s reported revenue is down 1.9% from 2013.

COKE also expects fluctuations in foreign currency exchange rates to have an unfavorable impact on its 2015 results.
Those currency losses are tucked away in the “Other Income (loss)” line of the income statement. The currency effect on operating income will equal 7% in the fourth quarter, and 6% for the full year.
COKE estimates that the strong dollar will reduce its profits by 6% over the next year!
And to make sure that COKE paints itself in the best possible light going forward, it will start using “profit before tax” rather than “operating income” as a primary metric to track profitability.
I could go on, but I think the above examples show there’s a lot of financial engineering going on behind the scenes to meet profit expectations. A serious underlying revenue slowdown is running through corporate America.
The common theme for all these revenue-challenged companies is a heavy dose of foreign sales. Those foreign sales are being negatively affected by a strong US dollar.
The US dollar has been on fire, but instead of helping corporate America, it hurts US multinational companies in two painful ways:
Top Line Pain: A strong dollar raises prices for foreign customers and those higher prices can negatively affect demand.
Bottom Line Pain: The value of overseas sales declines when translated back into US dollars.
The result is a double-whammy of profit pressure. How much of a whammy? Experts say a 1% move in the dollar can have a 2% impact on the earnings of the S&P 500 companies.
When I connect the dots, I see an explosion in the number of companies that will soon report worse-than-expected results, which they will blame on the strong dollar.
You’d be wise to take a close look at the stocks in your portfolio and jettison any that look vulnerable.
Better yet, if you have some speculative capital, there are big profits to be made by betting against—through short sales, inverse ETFs, and/or put options—those ticking time bombs.
30-year market expert Tony Sagami leads the Yield Shark and Rational Bear advisories at Mauldin Economics. To learn more about Yield Shark and how it helps you maximize dividend income, click here. To learn more about Rational Bear and how you can use it to benefit from falling stocks and sectors, click here.

As the end of the latest quantitative easing program approached, everyone was wondering if history would repeat in the form of a stock market correction that terrified the government into another round of debt monetization. And right on cue, volatility surged in late September, sending US stocks down by about 6% by mid-October.
And even that tepid bit of excitement was enough to send the Fed’s spinners into action:
James Bullard: Fed Should Consider Delaying The End Of QE
James Bullard, President of the St. Louis Federal Reserve Bank, told Bloomberg Television’s economics editor Michael McKee today that the Fed should consider delaying the end of QE.
Bullard said, “I also think that inflation expectations are dropping in the U.S. And that is something that a central bank cannot abide. We have to make sure that inflation and inflation expectations remain near our target. And for that reason I think a reasonable response of the Fed in this situation would be to invoke the clause on the taper that said that the taper was data dependent. And we could go on pause on the taper at this juncture and wait until we see how the data shakes out into December. So…continue with QE at a very low level as we have it right now. And then assess our options going forward.”
That was literally all it took. No concrete action, no pulling out the bazooka, just some regional Fed chair whom 99.9% of Americans have never heard of speculating that maybe the end of tapering should be delayed by few months. And the markets went volatile on the upside, recouping most of the previous couple of weeks’ losses in a few days.

Somewhere out there a bunch of Fed suits are sitting around a conference table laughing about how easy it is to manipulate today’s “investors”. After a decade of artificially-low interest rates, massive debt monetization, trillion-dollar bank bailouts and who knows what other kinds of secret interventions in what used to be free markets, the leveraged speculating community no longer cares about fundamentals. Instead it’s all about the flow of newly-created currency from the world’s central banks. When the spigot is on, buy. When it’s off, sell. This has turned out to be one of the easiest periods in financial history to run money on the “don’t fight the Fed” system.
So now what? Another burst of asset price inflation that takes small cap equities and junk bonds to the moon? Maybe. The new money has to flow somewhere, and with Europe joining the debt monetization party there might soon be a lot of money indeed sloshing around a global financial system with relatively few attractive choices.
But there’s a reason that unlimited money creation has never been an easy path to affluence: It only works for a short while and is inevitably followed by a period of chaos as all the malinvestment generated when money was too easy causes various kinds of crises.
In any event, the question that should be on everyone’s mind isn’t whether the Fed will keep QE going, but why, after five years of epic debt monetization and record low interest rates, inflation expectations are, as Ballard notes, plunging. The Keynesian answer is that $30 trillion (or whatever the true number turns out to be) wasn’t enough. $50 trillion, they assert, would have returned the world to steady, sustainable growth.
For lack of another politically-marketable policy option, the “more is better” crowd will get what they want in 2015, when something will happen somewhere to scare the world’s central banks into a coordinated attempt to inflate away their past mistakes.


-
I know Mike is a very solid investor and respect his opinions very much. So if he says pay attention to this or that - I will.
~ Dale G.
-
I've started managing my own investments so view Michael's site as a one-stop shop from which to get information and perspectives.
~ Dave E.
-
Michael offers easy reading, honest, common sense information that anyone can use in a practical manner.
~ der_al.
-
A sane voice in a scrambled investment world.
~ Ed R.
Inside Edge Pro Contributors

Greg Weldon

Josef Schachter

Tyler Bollhorn

Ryan Irvine

Paul Beattie

Martin Straith

Patrick Ceresna

Mark Leibovit

James Thorne

Victor Adair