
Currency
Greenback Surges as Markets Grind Lower. Victor Adair says market psychology turned negative in the first week of September causing the US dollar to surge and global markets to fall.
…..to view interview click on image or HERE

The US$ has been soaring. Since making a low in May 2014 just under 79 the US$ Index has jumped almost 9% to over 86. If the US$ is rising other currencies must be falling. The Euro has lost almost 10%, the Japanese Yen has fallen 7%, and, the British Pound has lost about 6%. Those three make up 57.6%, 13.6% and 11.9% respectively of the US$ Index. The Cdn$ makes up 9.1% of the US$ Index and has lost 5%. Oh yes, gold has fallen about 10% in the same period. Gold may not be a part of the US$ Index, but many consider it to be an alternative currency.
When one looks at a very long-term chart of the US$ Index it doesn’t appear as if the US$ is soaring. What it does show is that the US$ Index could be breaking out of seven point bottom pattern. The US$ Index has done this before. The last time was following the long 1987-1997 bottom pattern. The breakout occurred in February 1997 and had an objective up to 121. The high was made at 120.80 in January 2002.
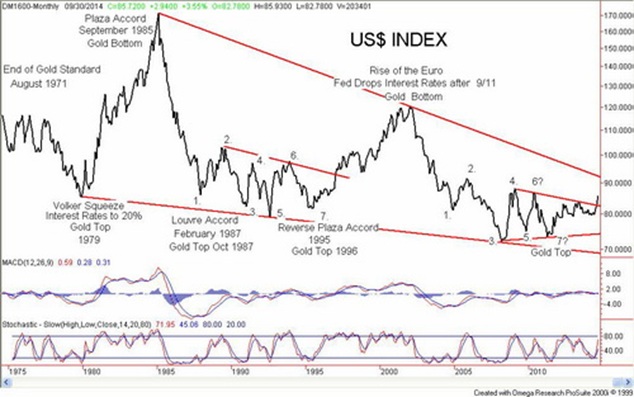
The current long bottom has been forming since 2004. Once again, the breakout appears to be occurring ten years later. The
potential objective is up to 104.75. There is potential significant resistance at 92 based on the long downtrend line from the 1985 top that aligns with the 2002 top.
If this is correct it has potential negative ramifications for the currencies that make up the US$ Index and for gold. Gold has tended to top or bottom inversely to tops or bottoms for the US$ Index. The Volker squeeze of pushing interest rates to 20% got underway in December 1979. Gold topped in January 1980 at around $850. The Plaza Accord was formed in September 1985 in order to combat the sharp rise in the US$. Gold bottomed in February 1985 near $280.
The next most important event for the US$ was the Louvre Accord in February 1987. The Louvre Accord’s goal was to stabilize international currency markets and halt the sharp decline of the US$ at the time. Gold topped in December 1987 at around $500. The Reverse Plaza Accord of 1995 was to bail out the Japanese economy that was under extreme pressure because of a huge rise in the Japanese Yen. Gold topped in February 1996 at about $418.
Gold made its major bottom in February 2001 which was about a year before the top seen in the US$ Index in January 2002. There was no particular accord at the time but the Euro came into existence in 1999 but it wasn’t until 2002 that notes and coins began to circulate. The rise in the Euro coincided with a long decline for the US$. Gold topped in September 2011 not long after the US$ Index made what thus far is its final bottom in February 2011 near 73.
So what is driving the US$ to new heights? Well it is not so much a strong US$ but a weak Euro. The EU economy is showing signs of falling into a recession even as the US economy appears to be holding with low growth. Japan is also falling once again into recession. There has been constant chatter of the US raising interest rates. That is not the case in the EU where there are now negative interest rates nor in Japan where interest rates remain at record lows. Longer-term interest rates in the US remain above those in both the EU and Japan. Tensions in Ukraine between Russia and Ukraine are negatively impacting the EU because of sanctions placed on Russia. Tensions in the South China and East China seas between Japan and China are negatively impacting Japan.
Is this the scenario often outlined by Goldman Sachs and others that gold is to collapse to $1,050? It is possible. The EU and Japan are entering an important deflationary cycle and the US$ has become the major recipient. The concern in a deflationary cycle is insolvency. While US Treasuries have been the major beneficiary of the rush into US$ it is noteworthy that weaker credits are actually falling in value even as US Treasuries rise in value. There are numerous concerns of insolvency in the Euro zone and in Japan. Sanctions against Russia are triggering trade wars. As everyone supposedly learned during the Great Depression trade wars are a lose-lose situation. Maybe they didn’t really learn anything.
Debt is fine as long as it can be serviced. But the debt levels in the western economies has reached potentially catastrophic proportions. The US has a total debt to GDP ratio of about 350%. Officially reported US debt levels according the Federal Reserve Board is about $58 trillion against a GDP of $16.6 trillion. The US also has unfunded liabilities of about $116 trillion. Japan’s total debt to GDP is around 650%, the Euro zone is at 450% as is Great Britain. For all OECD countries, the total is north of 400%. Back in 1990, total debt to GDP for the OECD countries was generally no higher than 200%. It is with the debt where the seeds of the next collapse lie especially given low savings rates in most of the OECD countries.
While the US$ appears to be rallying now it could set up the next US$ collapse. The US$ is under attack from both China and Russia in particular. Gold is cheap right now but everyone is reminded that during the deflationary 1930’s gold rose both officially when FDR raised the price of gold in 1933 and gold stocks rose over 400% even as the Dow Jones Industrials (DJI) was losing almost 90%. Gold is driven by fear. Fear of monetary collapse. Right now it is the US$ that is benefitting but when the US$ turns as it has in the past in 1985 and 2002 gold prices rose sharply. The previous sharp rises for the US$ played out over five/six years. This time the cycle is liable to be considerably shorter given the growing pressure on the US$ from the sanctions against Russia.
According to Michael Kosares China believes that gold is the buy of the century (Michael J. Kosares – Why China thinks gold is the buy of the century – USA Gold Publications). China wants to hold as much gold reserves as the US holds. The US holds 8,133.5 metric tonnes of gold or 261.5 million ounces of gold. China has roughly $4 trillion of foreign reserves. China could buy all of the gold reserves of the US with gold at $1,225 for the small sum of $320 billion. That is apparently only about 8% of China’s foreign reserves. China could buy all of the central banks gold and use only 32% of its foreign reserves. All of the gold held in the ETF’s could be purchased by China with only 2% of its reserves. By these measurements gold would be appear to be a grossly undervalued asset.
The current rise in the US$ has been almost straight up with little or no correction. A violent up move could be met with a violent correction and possibly soon. How gold responds during that correction should be watched carefully.
CHART OF THE WEEK
Charts and commentary by David Chapman
26 Wellington Street East, Suite 900, Toronto, Ontario, M5E 1S2
Phone (416) 604-0533 or (toll free) 1-866-269-7773 , fax (416) 604-0557
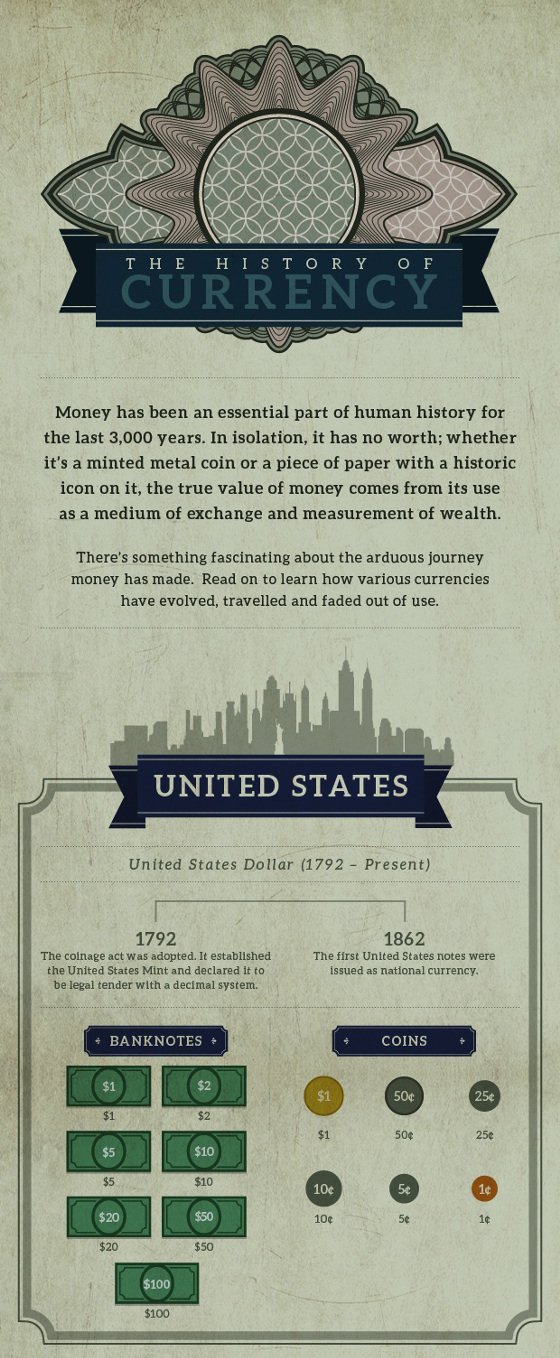
“a foregone conclusion that some of the currencies listed in the infographic below may not exist in 10 years”
Even though there are short of 200 official fiat currencies today, throughout history there have been thousands of currencies that were once used for trade. The above infographic documents the history of currency in 10 different countries of significance.
There are some interesting lessons to be learned from this lengthy and often tumultuous history. For example, the Romans were really the first to debase their currency in a significant way, and many historians believe that this was a key factor in contributing to the downfall of the empire. Unfortunately, we have not learned from tragic events such as this (which helped cause the Dark Ages), and countless other currencies have also bit the dust since then.
One study of 775 fiat currencies found the average lifespan of a currency to be just 27 years. Here’s the breakdown:
- 20% currencies failed through hyperinflation
- 21% were destroyed through war
- 12% were destroyed through independence
- 24% were “monetarily reformed”
- 23% are still in circulation
It seems like a foregone conclusion that some of the currencies listed in the infographic below may not exist in 10 years, or perhaps they get “monetarily reformed”. In any case, it’s worth noting that in today’s interconnected world, it may be easier to stave off the death of one currency through global intervention. However, systematically there is far greater risk. If one currency fails, the possibility also exists for many others to share the same fate through the domino effect.
Investors should study currency history, and as part of a smart portfolio they should protect their hard earned wealth and savings in a defensive fashion. Black swans do happen, and even the crisis in the tiny country of Cyprus had people reeling. The potential for something much bigger is inevitably a possibility – it is just a matter of when and how.


It seems nothing can stop the US Dollar. Since its low in April it has closed higher in four out of five months and is up almost 8.00% since then. While a run like that is in need of a rest there are some big issues that need to be considered now.
DXY broke out of a six-year triangle this month. Breaking to the upside from a triangle is bullish. That triangle is essentially a six-year base and should give DXY some serious “legs” for the future.
As the world’s most important commodities are priced in US Dollars, a higher Dollar means lower commodity prices; deflation. Note in the chart below how both equities and commodities trended higher during the inflationary period associated with a falling Dollar. Note also the “Goldilocks” period while DXY has been forming its base. Even commodities, which took a big hit in 2008, have essentially gone sideways since then.
The Dollar breakout is warning of an end to the bull market in equities and renewed bear market in commodities.

Click on Chart for Larger Image
About Ed Carlson:
He is the author of George Lindsay and the Art of Technical Analysis, and his new book,George Lindsay’s An Aid to Timing is an independent trader, consultant, and Chartered Market Technician (CMT) based in Seattle. Carlson manages the website Seattle Technical Advisors.com, where he publishes daily and weekly commentary. He spent twenty years as a stockbroker and holds an M.B.A. from Wichita State University.

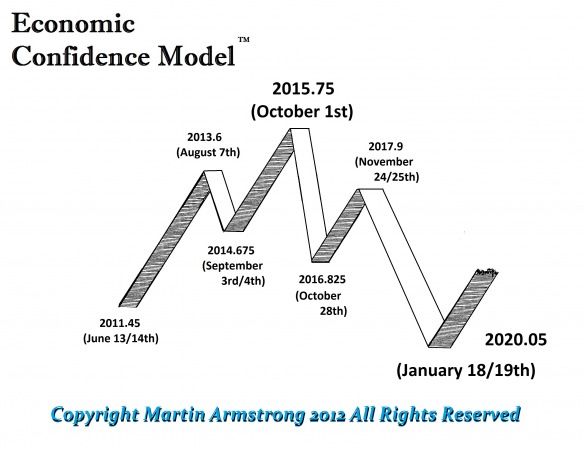
The 2014.675 turning point in the Economic Confidence Model seems to have pinpoint the shift in capital flows. The US dollar is rising and this may yet move into a serious rally that will have the politicians in turmoil have some even talking about protectionism again since morons never learn a lesson. You have to understand that a rally in the dollar isNECESSARY to turn down the economy for 2016-2020. The US economy is the ONLYthing hold up the entire world economy as it stands right now. Economic growth is becoming extinct in Europe, Russia, China, Japan, the Bricks, you name it. Let the first shot be fired between China and Japan and
watch how much dollar buying its in a single day.
 The amount of dollar haters out there is staggering. They just cannot see that the US debt of $17 trillion is not a negative – it is a positive when there is $30 trillion in central bank reserves and country wealth funds. There are NOT ENOUGH dollars to go around when there is no other place to stuff your money. This is a global problem that Europe has decided to inflict upon the world with its brain-dead idea of trying to create a single currency without a single governmednt. OOPS – too late now. Confidence has been lost thanks to France. France’s dream of competing with the USA and surpassing it – well Hollande wiped that dream from the slate – as the Italians would say – Arrivederci Francia.
Even gold has fallen for two weeks since the turn in the ECM. Gold’s Benchmark was 9/15 and that producing a low warns indeed we will see lower prices ahead. The second part to the metals report is Silver. This covers silver in all the major currencies, the silver/gold ratio, and the conclusion for the targets in time and price with respect to gold and silver. The third part is Platinum, Palladium, and Copper. The gold promoters just can’t get it through their head, sometimes there are bigger issues to consider like the global economy and where do the metals really fit in.
 The Euro is trading at the 127 level and it is sinking rapidly. We have critical support at the 122-123 level and a weekly closing below 122.44 will warn we have serious problems ahead for Europe. The Monthly Bearish Reversal lies at 125.52 and is September closes below this level, watch-out for November. Even a monthly closing BELOW 129.78 will be a sell-signal for Europe.
Dean Martin’s Arrivederci Roma may take on the status of a theme song for Europe pretty soon. This is what we get letting lawyers with ego problems run governments when they are obviously highly questionable to have practiced law to start with. We need REALpeople to grab a hold of this mess before it is way too late or perhaps Eric Clapton’s –Good Night Irene might be next to the final song we sing – Don McLean’s – American Pie.
….more from Martin:
Plight of Germany – Down For the Count?
Canada Warns its Citizens Not to Take Cash to USA


-
I know Mike is a very solid investor and respect his opinions very much. So if he says pay attention to this or that - I will.
~ Dale G.
-
I've started managing my own investments so view Michael's site as a one-stop shop from which to get information and perspectives.
~ Dave E.
-
Michael offers easy reading, honest, common sense information that anyone can use in a practical manner.
~ der_al.
-
A sane voice in a scrambled investment world.
~ Ed R.
Inside Edge Pro Contributors

Greg Weldon

Josef Schachter

Tyler Bollhorn

Ryan Irvine

Paul Beattie

Martin Straith

Patrick Ceresna

Mark Leibovit

James Thorne

Victor Adair