
Currency
The US Dollar chart may look “way overbought” at this moment…but it’s also breaking out to 4 year highs. One thing we have learned from trading currencies for nearly 40 years is that trends go WAY FURTHER than you think is reasonable or possible…if you can’t stay long the Dollar just stand aside…don’t get short the Dollar except to try to capture very short term corrections.
We have been relentlessly bullish the US Dollar for over a year… it closed at 4 year highs last week…it has gone nearly straight up for the last 2 months…the Yen is at 6 year lows…the Euro is at 14 month lows…the Dollar is rising against nearly every single currency…commodities are tumbling as the Dollar rises…gold has dropped ~$125 in the last month…silver is at 4 year lows…the CRB commodity index…which prices a basket of commodities in terms of US Dollars… is at 4 year lows…down ~30% since the Dollar began a multi-year rally in 2011.

…read Victor’s full analysis of all the key markets that are turning by clicking on his title below:
7 Charts that Turned Lower the 1st Week of Sept and 1 that is Just Starting – Sept 22

Quotable
“Tape reading was an important part of the game; so was beginning at the right time; so was sticking to your position. But my greatest discovery was that a man must study general conditions, to size them so as to be able to anticipate probabilities. In short, I had learned that I had to work for my money. I was no longer betting blindly or concerned with mastering the technic of the game, but with earning my successes by hard study and clear thinking.”
Larry Livingston [taken from Reminiscences of a Stock Operator]
Commentary & Analysis
This dollar bull could have a long way to run
It is interesting others are finally noticing “the currency formerly known as the ugly step-sister,” aka the US dollar, is rallying. Even the newsletter crowd, otherwise known as “the perennial dollar disaster promoters,” is recognizing just maybe they’ve gotten it wrong, again, when it comes to the buck.
Financial TV has been reporting the dollar has made a “huge” move. It is a perspective others seem to share because they are asking: When will the Federal Reserve do something to weaken the dollar? But if what we are witnessing is a true bull market, this thing has a long way to run. Heck, we haven’t even broken out yet.
I shared the following chart with my subscribers on Tuesday night.

In the box (in the chart above) to the left it shows the most recent US dollar index bear market, which ended on the same day the US government stepped in to save Bear Sterns—March 17th 2008. The red box on the right shows price action over the last six years since the dollar put in a major bottom. We are just now testing the downtrend from the previous swing highs gong all the way back to 2006. The key drivers are growth, yield, and money flow (foreign direct investment).
My guess, based on the length of the last two US dollar index bull markets since the dollar began floating, is this bull market could run 10-years or more. Given the relative positioning of the United States vis-à-vis its major country competitors, the idea of a 10-year bull market seems to make sense.
So, to give you a bit of perspective to see the potential in a real dollar bull market, and to help explain what I mean when I say this thing could have a long way to run, below is a little matrix I put together comparing where the major pairs were back in July 2001 to where they are today; plus the % move in each of the pairs if it the dollar index were to return to its 2001 high:

Granted, this is a bit simplistic. But I wanted to provide some perspective on potential and to suggest we haven’t seen much yet if my guess about a multi-year dollar bull proves correct.
I realize there are still many out there who cling to the notion the US dollar is doomed. The major newsletter houses have been telling you that for years. I have stopped reading their nonsense on the dollar. So in that vein, I want to leave you with these comments by Michael Pettis taken from his blog—I think a very reasoned view.
Professor Pettis acknowledges the dollar as reserve currency is not a guarantee, there are real risks. But he understands an end to dollar hegemony might not be all that bad for the US. Mr. Pettis’ also makes a point the dollar doomers always ignore—other countries use the reserve currency very much to their advantage; then complain about it when it suits their story. In short, it doesn’t appear the dollar will be relegated to the dust bin of history any time soon, so you can take advantage of this dollar bull.
Professor Michael Pettis [my emphasis]:
The US dollar will remain the world’s dominant reserve currency for a very long time, partly because it is the only currency that exhibits anywhere near the needed level of credibility, mobility, and low transactional costs, and mainly because for all the huffing and puffing about “exorbitant privilege” no other country is willing to pay the considerable cost of allowing its currency to be accumulated by foreign central banks whenever these countries experience weak domestic demand. The only way this will change, I think, is if, and perhaps when, Americans decide that they are no longer willing to enjoy the “exorbitant privilege”, and Washington imposes restrictions on foreign purchases of US dollar assets, as was the case until the 1960s.
Five years ago I would have told you that this would never happen, but two things seem to have changed. First, as Americans become increasingly aware that when foreign central banks amass hoards of dollars and prevent others, including the Fed, from reciprocating, they aren’t doing the US any favors (and if they were, why are they so determined to prevent other central banks, including the Fed, from returning the favor?). Their purchases are aimed at boosting domestic employment, and unless productive investments in the US are unfunded because of a savings shortage (which is all but impossible to believe), their purchases must result either in an increase in US debt or an increase in US unemployment. This may sound surprising to many people, including, shockingly enough, to many economists, but is actually quite easy to prove, either by using balance of payments arithmetic or by looking at the historical precedents.
So the next time someone tells you the US dollar is “way overvalued” and the “Fed must do something,” just show them the weekly chart above.
Black Swan Currency Options Strategist
I beat up our subscribers pretty badly in the March and June expirations, after doing quite well for them going into the time frame. Now we are back on track, recording some nice profits and seeing some nice opportunities. We are sitting on an open profit of 136% in a Dec Aussie dollar put (FXA). And below is a look at the last three trades we closed (not ½ denotes half position in the track):
Black Swan Currency Options Strategist Closed Positions:

If you would like to subscribe to our service it is only $395 per year and you can do so at the following link:
http://www.blackswantrading.com/currency-options-strategist/
Thank you.
Jack Crooks
President, Black Swan Capital
Trying to pick a profitable trade in the foreign exchange market is similar to judging a “reverse beauty” contest, that is to say, the winner is the least ugly currency at any given moment in time. All paper currencies are ugly, because central bankers print vast quantities of fiat currency, to varying degrees, at the behest of the ruling political elite that appointed them to run the printing presses. “By this means, government may secretly and unobserved, confiscate the wealth of the people, and not one man in a million will detect the theft,” – the late British economist John Maynard Keynes, used to say.
In the arcane world of foreign exchange, the axiom, – “the trend is your friend,” – is a reliable piece of advice, since trends in currency pairs can extend for many months, or even years, and often lead to double-digit returns. As such, the US-Dollar Index, which measures the US$’s value against a basket of six major currencies, has suddenly risen +5% higher over the past nine weeks, to above the 84-level, marking its longest streak of weekly gains in 17-years. Many traders are beginning to wager that the US$’s recent bout of volatility is harbinger of a longer term rally that can extend into 2015.
If the US$ index can manage to break through key horizontal resistance at the 84.50-level in the days or weeks ahead, it would signal a technical breakout to higher ground. Already, the US$ has rolled up its biggest gains against Japan’s yen, climbing +40% higher from above its all-time lows around ¥76, to a six year high above ¥107 last week. The other currencies in the pack, the Euro, British pound, Australian dollar, Swedish krona, and Swiss franc are also looking uglier these days, but are still hanging around within their trading ranges of the past 2-years.
Many analysts and traders were caught off guard by the US$’s recent bout of strength, and as George Orwell used to say; “To see what is in front of one’s nose requires a constant struggle.” The most obvious explanation for the US$’s resiliency is the Federal Reserve’s gradual withdrawal from its Quantitative Easing (QE) scheme. Last year, the Fed pumped $1-trillion of excess US$ liquidity into the money markets, through its QE-3 scheme. However, at its Dec ’13 meeting, – the Fed switched gears, saying it would gradually reduce its injection of monetary heroin to the QE addicted markets. The Fed has reduced its QE-injections by $10-billion /month at each scheduled board meeting this year, to a pace of $25-billion in Sept ’14. The Fed is now entering the homestretch of “Tapering” QE, and will turn-off the money spigot at the end of October, and thereby removing a major headwind for the US$.
Economists are now trying to pinpoint when the Fed would begin to hike the federal funds rate from its current range of zero to 0.25%. Expectations of a series of baby-step Fed rate hikes to begin sometime in 2015, were heightened on Sept 11th, with the appointment of the Fed’s #2 chief, Stanley Fischer to oversee the central bank’s all-important “financial stability panel” – otherwise known as the “Plunge Protection Team” (PPT). Fischer’s crisis management skills will be utilized in guiding the clandestine activities of the PPT – as it tries to cushion the US T-bond and stock markets from the fallout of the Fed’s exit from QE-3. A series of baby-step rate hikes to 1% could tip the US-economy back into a recession, or worse yet, trigger a -10% correction in the US-stock market.
Even if the Fed gets cold feet and decides to delay the series of baby-step rate hikes, the US$ could still win the reverse beauty contest, because the Bank of Japan (BoJ) and the European Central Bank (ECB) are also expected to keep their lending rates locked near zero percent for years to come. Better yet for the US$, – the BoJ is on a set course to weaken the yen by injecting around ¥5-trillion per month into the Tokyo money markets, through the end of March ’15, and the ECB is preparing to print anywhere from €500-billion to €1-trillion over the next few years, under its “Targeted” QE scheme, which is designed to boost bank lending in the Euro zone economy. Thus, the US$ has the winning edge in the arena of competitive currency devaluations with its trading partners.
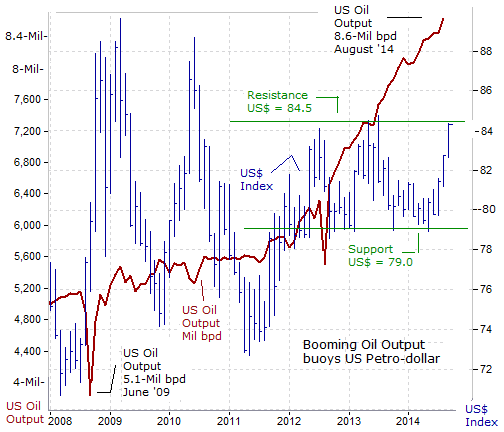
The Emergence of the US Petro-dollar, – Yet there’s another less cited reason behind the recent strength of the US$ index and what could auger the beginning of a multi-year advance for the greenback, – the US’s output of crude oil and natural gas continues to surge to new record highs. The US’s production of crude oil has reversed years of decline thanks to the development of shale resources, which have boosted output by +65% over the past six years. The US’s shale boom has allowed producers to unlock thousands of barrels of reserves, putting the US on course to become the largest producer of oil globally, which would dramatically reduce its dependence on imports.
US oil output averaged 8.6-million bpd in August, the highest level since July 1986. “US-crude oil production will approach 10-million barrels a day (bpd) in late 2015, and will help cut US imports of fuel next year to just 21% of domestic demand, the lowest level since 1968,” the EIA says. In Q’1 of 2014, the US passed Saudi Arabia to become the world’s largest producer of petroleum liquids, with daily output exceeding 11-million bpd, including crude oil, hydrocarbon gas liquids, and biofuels. In fact, the US would account for 91% of the 1.3-million bpd increase in global oil output next year.
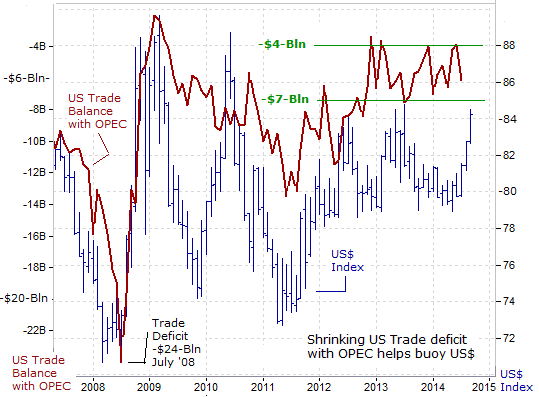
The shale revolution has enabled the US to reduce its imports of crude oil to 7.2-million bpd, or roughly -34% less from its peak in June 2005. Over the past decade, the US has reduced its imports of crude oil from Saudi Arabia, Mexico, and Venezuela, by a combined 2.9-milln bpd, while increasing imports from Canada to 2.6-million bpd. With OPEC as a whole, the US’s oil import bill has dropped dramatically, to $5.5-billion per month, on average, compared with its peak outlay of $24-billion in July 2008.
Until recently, the Saudi oil kingdom was able to maintain a steady flow of 1.3-million bpd to the US, even as total US oil imports fell by a third. However, Saudi Arabia is now losing market share as the shale boom leaves US-refiners with ample supplies of inexpensive domestic oil. Saudi exports of Arab light have fallen by 452,000 bpd since April to 878,000-bpd in August, the least since 2009.
Since hitting a record of almost 21-million bpd in 2005, US-oil demand fell to 18.5-million bpd in 2013, – the EIA says. Fuel efficiency continues to slice away at demand, and an aging population is expected to drive less in the long run. Gasoline demand had been steadily declining since 2007 as motorists drove less and car fuel efficiency improved.New US vehicles available in showrooms are +20% more fuel-efficient on average, than vehicles introduced five years ago, according to AutoNation.
The US’s shale oil revolution has helped to narrow the overall US trade deficit to -$42-billion per month, on average. That’s far less than the average deficit of -$62-billion /month from 2005 thru mid-2008, when the US trade balance was at its worst. The narrowing of the US trade deficit is adding an estimated +0.6% to the US’s annual economic growth rate, compared with a few years ago. And looking towards the future, with the growth in world energy demand expected to increase around +35% by 2030, the US-economy could find itself at close to self-sufficiency in energy.
The story line for the US Petro dollar is bound to get better in the years ahead.The US has more recoverable natural gas than any other country. This represents a century’s worth of output and can support peak production at more than twice the 2013 level. As such, the EIA forecasts natural gas prices will average below $5 through 2023 and less than $6 until 2030.
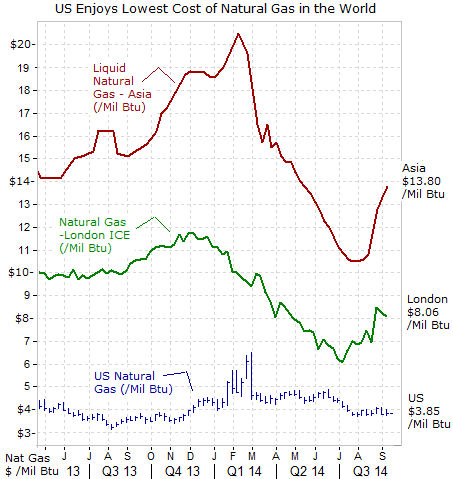
A Renaissance in the factory sector – The US-economy isthe lowest-cost producer of natural gas, and thus, making products such as chemicals, fertilizer, aluminum, steel and glass are more profitable in the US, and will attract manufacturers from around the world, (or to Mexico’s side of the US-border). This creates a stronger base of economic growth than the rest of the industrialized world. Economists estimate that increases in US- oil and natural gas production will create as many as 3.6-million new US-jobs by 2020 and increase economic output by +2% to +3.3-percent.
Unlike crude oil, natural gas cannot be easily transported overseas. German and French companies pay almost three times as much for liquid natural gas, and Japanese importers pay even more. Currently, US natural gas is priced at $3.85 per million British thermal units (mmBtu), while Asian importers pay almost $14 per mmBtu for LNG imports. Europe, which relies on pipeline imports from Russia, Norway and North Africa, is priced in between at around $11 per mmBtu. Benchmark UK spot gas prices traded in London are around $8 per million Btu, while Russian pipeline supplies, which are linked to the price of North Sea Brent crude oil, are around $12/mmBtu.
Europe’s dwindling supplies of natural gas are increasing its import dependency and its exposure to a global liquefied natural gas (LNG) market where prices are high because of demand in Asia and Latin America. The cheapest pending new major gas source will be the US, which could begin exports of LNG, in 2015. But even this gas, once fees and shipping costs are added, would arrive in Europe at current spot prices of around $9-10 per mmBtu. New supplies expected from Australia, the East Mediterranean and East Africa will also be priced well above $10 per mmBtu.
Aussie dollar Plunges alongside Meltdown of Iron ore market, – While the US-dollar is enjoying a renaissance as a “Petro” currency, – the Australian dollar finds itself on the slippery slope of a Bear market. For the week ended Sept 11th, the Aussie dollar fell -3.5%, skidding to the psychological 90-US-cent level. The price of iron ore, used to make steel, – and by far Australia’s most important export, – tumbled to five-year lows on Sept 11th, – settling around $82 per ton, and less than half its all-time high of $185 /ton. The Aussie dollar’s fortunes are influenced by gyrations in the world’s most heavily shipped mineral, which accounts for more than $1 in every $5 of Australia’s export income.
While demand from China’s steel mills continued to climb to record highs, Australia’s miners pumped billions of dollars into expanding the size of their iron ore mines and increased their export capacity, in order to capitalize on China’s high-speed urbanization. Demand for coking coal, which is used to fire the steel mills, and thermal coal used to generate electricity also played to Australia’s advantage as a large-scale coal exporter. Like all booms however, Australia’s mining bonanza has reached its zenith. China’s factory sector sputtered in August as its industrial output slowed to +6.9% in August, year -over-year, from +9% in July, – and the weakest since Dec ’08. Housing sales in China have fallen -11% in the first eight months of 2014 leaving developers burdened with bulging inventori
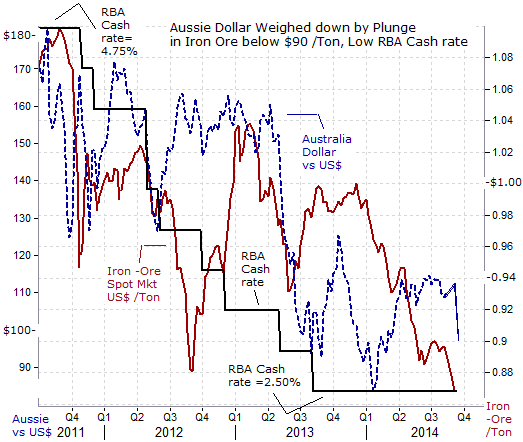
Softening iron ore prices, combined with the Fed’s tapering of QE-3, have weighed heavily on the Aussie dollar – the world’s fifth most actively traded currency. Ironically, it’s been Australia’s mining giants, – Rio Tinto <RIO.N> and BHP Billiton <BHP.N> that are contributing the most to the supply-side pressure that is bearing down on the price of iron ore. They are the lowest-cost iron ore miners (break-even at $45 /ton) and are flooding the market, in order to push higher-cost miners out of business. With its spending reined in, RIO has lifted annual production at its mines from 240-million tons to 290-million tons in a year. It is aiming at 360-million tons, and a supply-side squeeze is under way.
If the price of iron ore falls below $80 /ton for “an extended period,” higher-cost miners, could close down quickly. Rio, BHP and Brazil’s Vale are cash positive even if the iron ore price falls to $50 /ton. It is why they are boosting production. According to RIO, about 85-million tons of iron ore production has already been shut down in China, – where the average cost of iron-ore production is around $120 /ton. China used to source 50% of its iron ore domestically. Now it sources 20% domestically: it’s not hard to guess which miners are filling the gap. Smaller miners in Australia are on the edge at $80 /ton, if their lower-grade ore sells for less than the high-grade ore that Rio and BHP dig up.
The RBA is banking on a tighter Fed policy to weaken the Aussie dollar over the longer term, perhaps into the 85-cents to 90-cent range. In the meantime, Aussie$ traders will track the wild gyrations in iron ore, coking coal, copper, gold export prices. In the wild and whacky world of commodity trading, sentiment can often turn on a dime. For example, on Sept 15th, the spot price of iron ore suddenly jumped +4% higher to $85.20, /ton, and helped to brake the Aussie’s fall at 90-cents.
ECB knocks the Euro below psychological $1.300, While the US$ appears to be benefiting, either directly or indirectly, from its evolving status as a “Petro” currency, and psychology behind the Australian dollar has long focused on its status as a “Commodity” currency, it would be short sighted to omit that the vast majority of foreign currency transactions are earmarked for buying and selling bonds and stocks listed in the world’s capital markets. Nowadays, the movement of capital across borders happens with the click of a mouse, from a legion of traders ranging from such diverse groups, such as of lower-tier banks, carry traders, pension funds and mutual funds, hedge funds, central banks, sovereign wealth funds, and high-frequency traders, to the private retail investor.
In the foreign-exchange market, roughly $5.6-trillion changes hands each trading day, between the spot, forward, and derivatives markets. The Euro is used in 33% of these transactions, or about $1.85-trillion per day. However, the use of the Euro in the settlement of commercial transactions is just a fraction of the overall amount of trading in the common currency, compared to what’s earmarked for investment in financial markets, or what’s utilized by speculators, such as carry traders.
As such, the Euro’s exchange rate has been mostly influenced by the actions of the major central banks. For example, the Euro was climbing higher in an erratic fashion from the $1.300 area to as high as $1.400 during the 15-months ending in May ’14. The Euro was deemed to be the least ugly currency because the Fed was injecting $85-billion per month of freshly printed greenbacks into the US-money markets, and the BoJ was simultaneously injecting ¥7-trillion per month into the Tokyo money markets, under the respective QE schemes. Although the ECB was lowering its repo rate to undermine the Euro’s advance, the central bank was still resisting the nuclear option of QE.
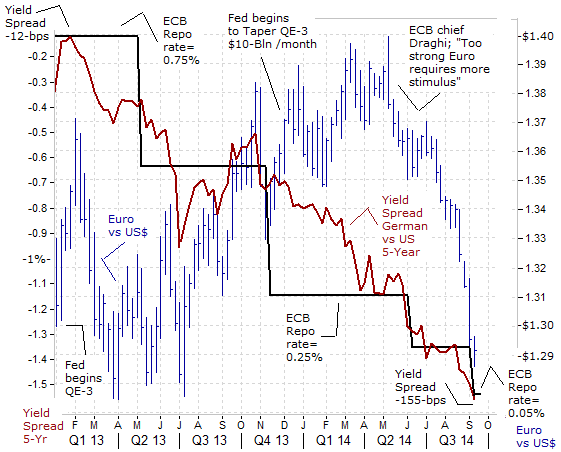
However, that perception began to change, when in late August, ECB chief Mario Draghi suggested the ECB would start to unleash “Targeted” QE – aimed at the asset backed markets, rather than the sovereign bond markets, but with the same net results, – a massive increase in the supply of Euros. In a battered regional economy further shaken by a mini trade war with Russia, the Euro began to tumble more steeply towards $1.300, and surrendered its gains of the previous year, as the yield on France’s 2-year government notes turned negative to as low as minus -3-basis points (bps). Yields on Germany’s 2-year schatz fell to minus -7-bps, and have been below zero percent since August 25th.
In this upside-down world, lenders pay borrowers to take their money. It’s a result of the ECB’s move to impose a penalty of -20-bps on banks that park money in the central bank’s vaults. The radical move is an attempt to force banks to lend excess Euros on hand, to businesses and consumers, and end a long drought of credit in crisis countries like Greece, Italy and Portugal. However, in many cases, commercial banks, would rather lend Euros to Paris or Berlin at zero percent or less.
The ECB says it will provide as much as €1-trillion of cheap 0.15% loans to banks, on the condition that they lend the money to businesses or to individuals, – “Targeted” QE. The ECB will begin dispensing that money on Sept 18th. These loans would be bundled together into packages called “asset backed securities’ (ABS’s), and the ECB has offered to buy the ABS’s with freshly printed Euros. It’s a more intelligent way of trying to jump start an economy, rather than the QE policies in England, Japan, and the US, which are mainly designed to inflate the wealth of shareholders in the local stock markets. And targeted QE increases the supply of Euros floating in the banking system, which has the side effect of weakening the Euro’s exchange rate, in order to help boost the fortunes of exporters.
SNB says ready to act in wake of ECB easing, While the Bank of Japan, the Bank of England, and the Fed have resorted to purchasing Treasury notes, as the key mechanism of increasing liquidity in the banking system, the Swiss National Bank (SNB) has taken a different route, but producing the same results. The SNB is limited from purchasing government bonds, because the local bond market is illiquid – at just $90-billion worth. The SNB could quickly end up owning the entire Swiss government bond market if it tried to match the ECB’s printing spree. Instead, the SNB has relied upon foreign currency intervention, – printing Swiss francs in order to purchase foreign currency. Thus, the size of the SNB’s FX stash is the barometer of the scope of the central bank’s liquidity injection operations.
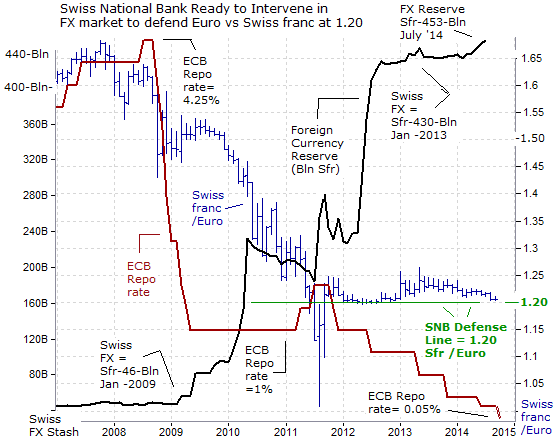
Since Jan ’09, the SNB’s stash of foreign currencies has mushroomed by roughly 400-billion francs, or a 10-fold increase. The SNB has enforced a floor under the Euro at 1.20- Swiss franc since Sept ’11, through a combination of verbal jawboning and outright intervention in the FX market. The SNB hasn’t been forced to intervene in the foreign currency markets for the past 2-years, as traders have shown the utmost of respect for the resolve of the SNB in defending the Euro’s floor at 1.20-francs. However, the Euro has been weakening against the franc in recent weeks, to as low as 1.205- francs. SNB chief Thomas Jordan has dropped broad hints that the bank is ready to push short-term Swiss deposit rates deeper into negative territory to make the currency less attractive. Given the sizeable amount of bank deposits held with the SNB, such a policy step could have a particularly strong impact. Negative deposit rates would make it expensive to hold Swiss francs. As a result, the US$ is looking less ugly than the Swiss franc these days, whose fate is largely tied to that of the Euro.
This article is just the Tip of the Iceberg of what’s available in the Global Money Trends newsletter. Global Money Trends filters important news and information into (1) bullet-point, easy to understand reports, (2) featuring “Inter-Market Technical Analysis,” with lots of charts displaying the dynamic inter-relationships between foreign currencies, commodities, interest rates, and the stock markets from a dozen key countries around the world, (3) charts of key economic statistics of foreign countries that move markets.
Subscribers can also listen to bi-weekly Audio Broadcasts, posted Monday and Wednesday evenings, with the latest news and analysis on global markets. To order a subscription to Global Money Trends, click on the hyperlink, http://www.sirchartsalot.com/newsletters or call 561-391-8008, to order, Sunday thru Friday, 9-am to 9-pm EST.

 The resounding story for the markets these last few weeks has been the unequivocal strength of the US dollar. The dollar closed higher Friday for the ninth straight week as it continues on its best run in 17 years. This has been the move in the dollar that many investment professionals were looking for as they anticipated the US Fed to end their Quantitative Easing program and begin to raise the Federal Funds rate, but the move in the dollar really did not come to fruition until the latter half of this year. That, however, is not the only story that has been supporting the strong dollar trade as a number of both domestic and international factors are weighing in on the foreign exchange markets.
The international story is based on the action of western central banks. As the US has passed their inflection point from making policy more to less accommodative, the question through the end of the summer has been what future measures will be taken by the European Central Bank and Bank of Japan? And unfortunately for the Bank of England, despite efforts by Governor Mark Carney to talk up the pound, a referendum on Scottish Independence on the 18th of this month has substantially weakened the pound translating to a stronger greenback.
On the domestic side it’s perhaps investor’s lax expectations that shifted this market. The San Francisco Fed put out a paper this week looking at how investors and futures markets were anticipating when the Fed might begin to tighten policy and at what pace versus what members of the Federal Open Market Committee (FOMC) were actually saying in their most recent June meeting. What the San Francisco Fed found was that the market and investors are behind the curve in anticipating when the Fed will begin to raise rates. This is inherent in an expectation that the accommodative policy will be around longer than the Fed currently plans on delivering.
This all leads into what will be a very important week for the markets. The FOMC meets Tuesday and Wednesday, and following that on Thursday Scotland votes. No question, volatility which has been vacant from currency markets for so long is finding its way back. Accommodative policy from the world’s most influential central bank had dampened volatility from the FX markets. As we’ve learnt, this had an effect of suppressing and stabilizing interest rates at record low levels. But as the Fed shifts back to a less discernible role in the markets, volatility in currencies will begin to rise.
The unknown going forward is what it means for the US dollar, and commodity prices, along with equities and the outlook for earnings of US companies, with a foreign income stream. The same questions holds true for most other financial markets. A stronger dollar provides headwinds and at this stage the dollar looks like it will continue to dominate.

Quotable
“The degree of certainty is a function of how good the edge is.”
Mark Douglas
Commentary & Analysis
Hodgepodge
EU Unemployment:
You’ve got to love this headline from Reuters this morning: Greek Unemployment Dips to 27%
Wow! A dip to 27%? Things must really be improving you might think. Until of course you read the first sentence of the story, “…dips to 27% from 27.1%.” If growth and yield are drivers for currencies over the intermediate-term (the Japanese yen excepted), then why shouldn’t the euro continue lower from here when you look at the numbers…


One major caveat here: Everyone seems to be expecting the euro to go lower. Thus, anyone with that view is firmly in the consensus. It doesn’t mean the consensus is wrong. But Mr. Market is watching and likely licking his chops.

EUR/USD Weekly:

Oil Prices:
I have a couple of friends who are always wringing their hands about fossil fuels. Of course they are big believers in those things which support their case: “Peak Oil”, manipulation of WTI prices in Cushing OK, Middle East conflict, and other such things; maybe even the ongoing fallacy of “global warming.” We all have our beliefs reflected against reality. Few of us let go of those beliefs when reality bites; that is what makes for nice price moves. [P.S. Another year and another dormant hurricane season here in sunny Florida. The place where Mr. Al “Rampant Hurricanes due to Global Warming” Gore told us would be ravaged by hurricanes. What a self-hyping moron!!! Hopefully, I am not tempting fate with that comment.]
So I always find it interesting when my friends tell me oil has now reached a permanent range peak and will never again go much below $100 per barrel (WTI). These friends seem to forget: 1) There is still plenty of oil out there to be had and the incredible advancement in drilling technologies and shale reserves seem to support that contention; and 2) oil is still subject, as most quasi-free asset markets are, to the laws of supply and demand.
WASHINGTON, Sep 9 (Reuters) – The U.S. Energy Information Administration on Tuesday cut its 2014 world oil demand growth forecast by 80,000 barrels per day to 1.04 million bpd.
LONDON, Sept 11 (Reuters) – Brent crude dropped to a two-year low below $97 a barrel on Thursday, falling for a sixth straight session as worries over mounting supply and weak demand outweighed concerns that conflicts in the Middle East could curb oil production.
We’ve been working off this chart for months now and it seems to be playing out nicely [the caveat is we were surprised by the big run in oil from mid-April to mid-June but believed the powers of global deflation and rising oil supply would sooner or later take precedence—it seems to be doing just that].


Aussie and Commodities Confirming Deflationary Pressures:
Our forex subscribers are feasting on this trade. We are short AUD/USD from 0.9354 on 9/4/14…and have about 240 pips and looking for more…they are also longUSD/CAD from 1.0912 on 9/8/14….if these two trades keep running, they are the type of trades that can make up for a lot of sins.
AUD/USD versus Gold and Oil Daily:

USD/CAD Daily:

Good summary from Robert Prechter’s Elliott Wave Theorist this month:

Is the stock market the next shoe to fall? No comment. I have only been wrong there for about five years in a row.
Thank you.
Jack Crooks
President, Black Swan Capital
Twitter: @bswancap

-
I know Mike is a very solid investor and respect his opinions very much. So if he says pay attention to this or that - I will.
~ Dale G.
-
I've started managing my own investments so view Michael's site as a one-stop shop from which to get information and perspectives.
~ Dave E.
-
Michael offers easy reading, honest, common sense information that anyone can use in a practical manner.
~ der_al.
-
A sane voice in a scrambled investment world.
~ Ed R.
Inside Edge Pro Contributors

Greg Weldon

Josef Schachter

Tyler Bollhorn

Ryan Irvine

Paul Beattie

Martin Straith

Patrick Ceresna

Mark Leibovit

James Thorne

Victor Adair