
Currency
 The Aussie delivers profits just as anticipated.
HERE’S YOUR CHANCE TO SEE JACK’S TRADING IDEAS IN REAL-TIME
My chart analysis suggested a big move was possible for the Japanese yen, the British pound, and the Australian dollar. But my indicators had not trigger any trades at the moment. In fact, only today does it look like a trade idea will trigger on the yen.
Anyway, that’s why I suggested the indicators I use serve better as an early alert system than a precise timing tool.
Also as I suggested, Jack uses indicators that do offer precise timing for trading ideas that can anticipate big movements in currencies.
In fact, his indicators worked perfectly on an Australian dollar trade he issued Thursday (shortly after I wrote to you).
CLICK THE LINK BELOW TO READ MORE …

Wealth comes in many forms, but only two general categories: tangible and financial. Tangible wealth is made up of real, physical things like buildings, farmland, oil wells, commodities, etc. These things can be seen and touched, and – crucially – they don’t have counterparty risk. That is, no one else has to make good on a promise for a tangible asset to have value.
Financial assets like bank deposits, insurance policies, bonds, and annuities do have counterparty risk, which is to say they depend on someone else’s promise. A bank deposit, for instance, only has value if the bank is willing and able to produce that money when the account holder requests it. And a piece of paper currency is only valuable if the government manages the money supply properly. The part of the economy represented by industries that deal primarily in financial assets is known as FIRE, for finance, insurance, and real estate (real estate in this case referring to mortgages and other property loans that are packaged and traded).
Equities, because they represent ownership shares in public companies, can be either tangible or financial depending on the underlying company. A share of Exxon Mobil stock is a tangible asset because oil wells are real, while a share of Goldman Sachs or JP Morgan Chase would be financial because a bank’s wealth is primarily in the form of loans and other financial instruments.
Over long periods of time these two asset categories tend to move in and out of favor, with tangible assets being more prized in hard, uncertain times when preservation of capital is paramount and counterparty risk is suspect, and financial assets being favored when times are good and people have grown to trust major financial institutions and governments to keep promises and generate big returns.
One of the keys to successful money management is to understand which category is ascendant and therefore the more profitable/safe place to be. During a boom, one should own financial assets until they become relatively-overvalued (as they did in 1929, 1968, and 2000), then shift into tangible assets and own them until they become overvalued (1947 and 1980).
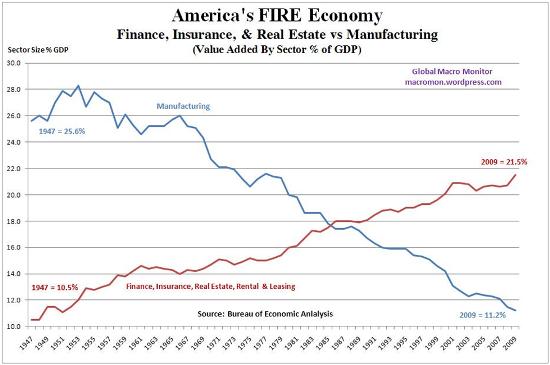
As this is written in late 2013, the world is at one of these inflection points, perhaps the biggest ever. As the following charts illustrate, during the expansion of the credit bubble that began after World War II Americans gradually became more and more optimistic about the future and more trusting of banks and governments. Because the good times seemed likely to continue, using other people’s money to achieve one’s ends came to be seen as increasingly reasonable and wise. Debt expanded and finance (i.e. the debt industry) became an ever-more important part of the economy, while manufacturing in particular and tangible assets in general became relatively less important. The FIRE economy doubled as a percent of GDP between 1947 and 2008 while manufacturing fell by nearly two-thirds. For investors, the standard portfolio of stocks, bonds and dollar cash was a great way to build wealth, with very little long-term downside risk.
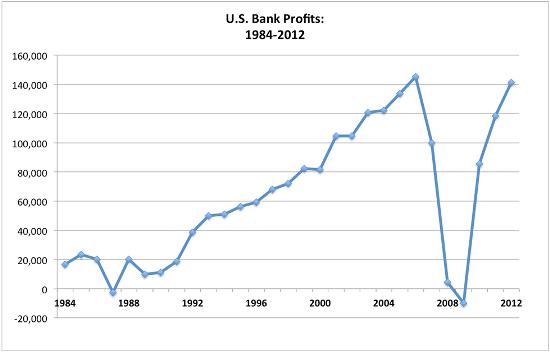
That faith was shaken by the crash of 2008, which should have marked the end of the post-WWII cycle of credit expansion and ushered in a mass-migration out of finance and into tangible assets. Instead, the world’s fiat currency managers upped the ante, cutting interest rates to zero and flooding the system with newly-created currency in an attempt to re-inflate the financial bubble. They handed the biggest banks effectively-unlimited amounts of free money, and the banks, reluctant to lend so soon after their near-death experience, simply deposited their excess reserves with the Fed, earning a small but risk-free return. Illustrating just how much money the banks were given, even with this hyper-conservative investment strategy, the industry reported record profits in 2013.
And within the banking industry it was the major banks, as the recipients of most of the Fed’s largesse, which reaped most of the rewards. In 2013, the 1.5 percent of banks with the largest asset bases earned about 80 percent of the industry’s profits. Big-bank stocks, meanwhile, were among the best performers of the post-crash bull market. The debt monetization experiment had succeeded in lengthening what was already an extreme pendulum swing towards financial assets.
So now the question becomes, will the monetary authorities be able to push the pendulum further, or was the financial asset recovery of 2009-2013 the last gasp of a dying trend? By now you know that we’re firmly in the latter camp. The expansion that began after World War II has produced extraordinary amounts of debt, leverage and complexity, from a financial standpoint achieving “peak” everything. Finance has no further to go, and the great migration out of financial assets and into tangible things is about to begin, on a scale commensurate with the historically-unprecedented size of the post-WWII credit bubble.- Read more here.

 Gold inexpensive compared to other asset classes says Marc Faber. Expect US dollar to rally against the Euro and Dollar has been strong against EM currencies.
Marc Faber Warns US Stocks will Fall
“My view is that its not a good time to buy”. “Dont forget, since October 2011, we haven’t had more than an 11% correction. And we’ve been rising for the last 6 months almost vertically. These types…
…full story HERE
“If you look at the import figures of the trading partners of China, they are all actually showing that exports of China are hardly growing,”
“If someone comes to me and says China has always managed to avoid … any credit problems [because it] has never defaulted, [that] doesn’t mean it won’t happen in future. The same was said about Japan. The Japanese also thought that way until 1989 and they lost control of it,”
“For the world, economic growth in China is very crucial. But not to worry, because the worse the global economy performs, the more geopolitical tensions we have, the more money printing we will have from the Federal Reserve. As it gives the clowns at the Fed another excuse to postpone the tapering,”
….more HERE (CNBC Video)

A way to be sure you don’t miss out on the sharp moves in major US dollar pairs next week …
I (JR Crooks) mostly follow the daily charts of currencies. I’m seeing something I want to alert you to …
 Some of the indicators I apply to currency price charts — and all markets, for that matter — suggest big moves are going to happen soon.
Take these charts of the British pound, Australian dollar and Japanese yen, for example:
Read & View it all in Currency Currents 13 March 2014
A candid discussion on the things that are scaring investors right now
Nick & Jack … Being Frank
This frank email exchange arose in response to yesterday’s ‘Weekend Reading‘ post. The dialogue is between Jack Crooks (Black Swan Capital) and Nick B. who has been a loyal reader and subscriber for many years …
Currency Currents 10 March 2014
How Watching Market Psychology Can Help You Time the Market
Elliott Wave International
Elliott wave patterns in price charts reflect the struggle between the bulls and bears.

-
I know Mike is a very solid investor and respect his opinions very much. So if he says pay attention to this or that - I will.
~ Dale G.
-
I've started managing my own investments so view Michael's site as a one-stop shop from which to get information and perspectives.
~ Dave E.
-
Michael offers easy reading, honest, common sense information that anyone can use in a practical manner.
~ der_al.
-
A sane voice in a scrambled investment world.
~ Ed R.
Inside Edge Pro Contributors

Greg Weldon

Josef Schachter

Tyler Bollhorn

Ryan Irvine

Paul Beattie

Martin Straith

Patrick Ceresna

Mark Leibovit

James Thorne

Victor Adair