
Currency
Picture a life where you do most of your shopping through Amazon.com and the local farmers’ market, most of your communicating through Facebook and Instagram, much of your travel via Uber, and much of your saving and transacting with bitcoin, gold and silver.
Do you really need an immense, distant, and rapacious central government? Maybe not. Perhaps your region or ethnic group would be better off forming its own independent country.
 This question is being asked — and answered — in a growing number of places where distinct cultures and ethnic groups within larger nations now see their government as more burden than benefit. The result: Secession movements are moving from the fringe to mainstream.
In just the past couple of weeks, Iraqi Kurdistan and Spain’s Catalonia declared their independence. Neither succeeded, but the fact that they felt free to try illustrates how times have changed.
This is fascinating on a lot of levels, but why discuss it on a gloom-and-doom finance blog? Because secession is about the messiest event a country can experience short of civil war. And few things are more financially disruptive for an already over-leveraged society than potential dissolution.
Today’s fiat currencies depend for their value on the belief that the governments managing them are coherent and competent. Let a major region break away and plunge a debtor country into political/civil chaos and the markets will abandon its currency in a heartbeat. Note the sense of panic in the following article:
EU TURMOIL: Finland preparing to go against Spain and RECOGNISE Catalonia’s independence
(Express) – FINLAND could be the first country to officially recognise Catalonia as a republic state, in a move that would put the Scandinavian country in direct opposition to the European Union (EU).
The country’s MP for Lapland Mikko Karna has said that he intends to submit a motion to the Finnish parliament recognising the new fledgling country.
Mr Karna, who is part of the ruling Centre Party, led by Prime Minister Juha Sipila, also sent his congratulations to Catalonia after the regional parliament voted earlier today on breaking away from the rest of Spain.
Should Finland officially recognise the new state of Catalonia this will be yet another body blow to the the EU which has firmly backed the continuation of a unified Spain under the control of Madrid.
European Commission President Jean-Claude Juncker warned today that “cracks” were appearing in the bloc due to the seismic events in Catalonia that were causing ruptures through the bloc.
Mr Juncker spoke in favour of unity. He said: “I do not want a situation where, tomorrow, the European Union is made up of 95 different states. We need to avoid splits, because we already have enough splits and fractures and we do not need any more.”
The Scottish Government has also sent a message of support, saying that Catalonia “must have” the ability to determine their own future.
Scotland, of course, is itself considering secession from the UK, which recently voted to leave the European Union.
The political class, meanwhile, is trying to figure out where it went wrong. See the New York Times’ recent What Is a Nation in the 21st Century?
If the combination of long-term financial mismanagement and sudden technological change really has made large, multi-cultural nations dispensable, then some of them are going to fragment. This in turn will contribute to the failure of the fiat currency/fractional reserve banking system that’s ruining global finance. Poetic justice for sure, but of an extremely messy kind.

Global stock markets were higher again this week, after a brief dip Thursday following a “warning” from the Peoples Bank of China about “too much debt and too much leverage.” The major American indices hit All Time Highs again this week with the DJIA up about 18% YTD.

Real and nominal US interest rates rose this week and, not surprisingly, so did the US Dollar. Markets are pricing in an 80% chance that the Fed raises s/t rates again in December (up from about a 20% chance in early September.)
Tax cuts in the US took a step closer to fruition this week (but there’s still a long way to go) adding upward pressure on interest rates and the US Dollar. In some respects the USD rally of the past 6 weeks is a continuation of the “Trump trade” that took the USD to 14 year highs following his election on anticipation that he would accomplish “great things” only to fall 12% over the next several months as the narrative became “he can’t get anything done.” Trump, in other words, was extremely “oversold” by September 8!
Fed Chair: President Trump is expected to announce his nomination for Fed Chair within the next few weeks. Governor Powell may be the “safe middle pick” between maintaining the status quo by re-appointing Yellen and “shaking thing up” by picking Taylor, Warsh, Cohn or someone else. See last week’s comments for more on this issue.
The Chinese Communist Party Congress continues. Last week I was asking, “What kind of Fed does Trump want?” This week I’m asking, “What kind of China does Xi want?” given that he seems to be “very much” the man in charge. Broadly speaking it would seem he’d like to see China as more of a “world player” with less pollution, less financial speculation and with less money leaving the country. Last week I wondered if something might “bust loose” following the Congress but maybe the “first derivative” trade is just to play his move to clean up pollution. There is apparently something like 200 million cars in China and only 1% of them are electric. He wants to see 20% of all cars electric in 7 years. Given that Europe and India are also pushing for less diesel and gasoline powered cars and more electric cars maybe we should look into buying copper against the sale of crude?
September 8 was a Key Turn Date: American bond yields hit their lowest level since Trump’s election on September 8 and turned higher while the US Dollar Index hit its lowest point in nearly 3 years and turned higher against nearly all other currencies and gold. Key Turn Dates have a lot of “power” because they happen simultaneously across several markets and mark a significant shift in market psychology and are therefore are a sign of a real reversal, not just a brief correction in an on-going trend.
The Canadian Dollar: Hit a 16 month low on May 5 and began to rally. At that time the Canada/US 2 year interest rate spread was about 65 points in favor of the US. In June the Bank of Canada accelerated the CAD rally by doing a “180” on interest rate policy and over the next couple of months raised Canadian short rates by 50bps. CAD rallied 5% in 6 trading days into the September 8 Key Turn Date and at that time the Canada/US 2 year spread was 25 points in Canada’s favor and the markets were pricing an 80% chance of another 25bps increase in s/t rates from the Bank of Canada by December. From the May lows to the September highs futures market speculators had swung from being hugely short CAD to being hugely long. The current huge net long position held by futures market speculators may become an “albatross” around the neck of the CAD market if it continues to fall.

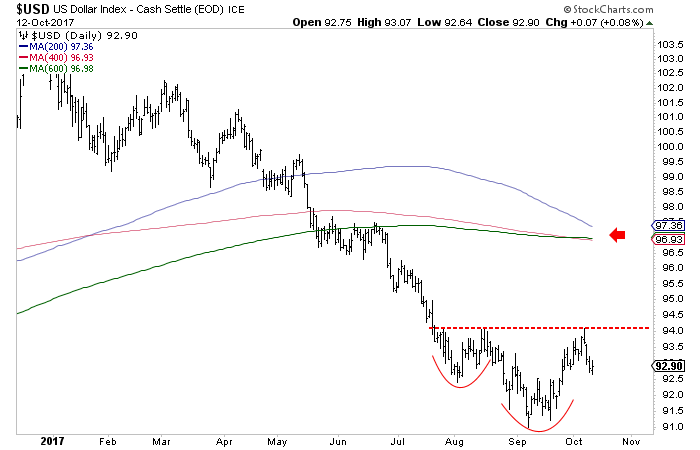
The US Dollar Index daily chart may be developing a 3 month head and shoulders bottom. A break of the 94 cent “neckline” would project a move to 97 cents. Speculators in the futures markets hold a record net short position against the USD (they are net long the other currencies except the Yen.) If the USD continues to rally these speculators may cover their positions adding to upward pressure on the USD.

Front month WTI crude oil has trade mostly between $49 and $52 for the past 6 weeks. It has traded mostly between $42 and $54 for the past 12 months producing a relative “equilibrium” after the huge disequilibrium created by the fall from $110 to below $30 between mid-2014 and January 2016. I have traded WTI almost exclusively from the short side but currently have no position.
PI Financial Corp. is a Member of the Canadian Investor Protection Fund. The risk of loss in trading commodity interests can be substantial. You should therefore carefully consider whether such trading is suitable for you in light of your financial condition. In considering whether to trade or the authorize someone else to trade for you, you should be aware of the following. If you purchase a commodity option you may sustain a total loss of the premium and of all transaction costs. If you purchase or sell a commodity futures contract or sell a commodity option or engage in off-exchange foreign currency trading you may sustain a total loss of the initial margin funds or security deposit and any additional fund that you deposit with your broker to establish or maintain your position. You may be called upon by your broker to deposit a substantial amount of additional margin funds, on short notice, in order to maintain your position. If you do not provide the requested funds within the prescribe time, your position may be liquidated at a loss, and you will be liable for any resulting deficit in your account. Under certain market conditions, you may find it difficult to impossible to liquidate a position. This is intended for distribution in those jurisdictions where PI Financial Corp. is registered as an advisor or a dealer in securities and/or futures and options. Any distribution or dissemination of this in any other jurisdiction is strictly prohibited. Past performance is not necessarily indicative of future results.

Global stock markets keep making new highs with total capitalization now around $80 Trillion. Since US markets are so “richly priced” investors are “reaching out” to other countries, and other markets, in search of “cheaper” valuations. Volatility is at record lows (selling vol is apparently the no-brainer path to financial freedom) and credit spreads are amazingly narrow. Reaching for yield has been handsomely rewarded…and I’m the guy who thought reaching for yield was a big mistake! (I still think it’s a big mistake…one of these days there’s going to be a real penalty for taking on an unknowable level of risk in exchange for a marginal pickup in yield.)
This tremendous rally in share prices has been fueled by a $15 Trillion tsunami of Quantitative Easing from the Big Four central banks (and who knows how much “accommodation” from the People’s Bank of China) and even though the Fed has announced a very modest program of “Quantitative Tightening” the ECB and the BoJ will continue with their “stimulative” programs.
The new Fed: There may soon be a wholesale change of personnel at the Fed that could have a big impact on markets. Yellen’s term as Fed Chair ends in February and since I believe President Trump loves to be “the disruptive boss” my bet is that Yellen doesn’t get reappointed. Vice-Chair Fisher has already resigned so Trump will have the opportunity to “re-shape the Fed” with as many as 6 nominations to the FOMC over the next year. (Who says he can’t get anything done?)
The Big Question is, “What kind of Fed does Trump want?” Perhaps the easy answer, given his personal success with borrowed money, is a Fed that will maintain an “easy money” policy. Such a policy would probably weaken the US Dollar…which the President seems to thinks is a good thing. But I’m thinking that his vision of “Make America Great Again” requires throwing out the old ways and going with something dramatically different. His nomination for Fed Chair will give us an insight into how he wants to re-shape the Fed…and if there are big changes coming at the Fed there could be big changes in the financial markets too. (Maybe S+P puts catch a bid?)
NAFTA: If indeed President Trump relishes the opportunity to be “disruptive” then markets should anticipate NAFTA will get wacked. Mexico seems more at risk than Canada with the Peso down ~8% over the last 4 weeks while CAD is down only ~3%.
The Canadian Dollar: has been relatively quiet this past week…with a little bounce from last week’s lows. The Bank of Canada Business Outlook Survey is scheduled for October 16 and a weak survey could bring positioning risk into focus given that futures markets speculators are holding their largest net long position in 5 years. I was wondering why the specs have added to their net long position for the past 4 weeks even as CAD fell 3 cents. That seemed counter-intuitive! So I took a close look at what the specs did following the major low this past May. It was interesting to see that following the May 5 low the spec net short position actually increased for 4 weeks while CAD rallied about 2 cents. The specs started cover their short positions after that but remained net short until early July…9 weeks after the May low…by which time CAD had rallied at least 6 cents. So what? My deduction is that the people behind these trades are operating on a longer time horizon than me…they initially see a reversal as only a set-back in the major trend, and therefore an opportunity to add to their position. They clearly don’t reverse their positions “on a dime” but if the market continues to go against them they will gradually unwind their position. So what? If the Sept 8 high was the major reversal I think it was, and if CAD trends lower from here I want to be short CAD while those spec longs are liquidating their positions!

The US Dollar Index: was also relatively quiet this past week…giving up about 1/3 of the rally from its September 8 low. I’ve got a bullish bias. I’m seeing a possible “head and shoulders” bottom forming on the daily USD Index chart (left shoulder end of July / early August.) An upside breakout through the 94 cent “neckline” would complete the H&S bottom pattern and confirm the break of the trend line that has defined the USDX decline since March. Classic chart analysis of the H&S bottom would project a target price of around 97 cents. Positioning risk is also a significant factor since the aggregate USD spec short position in the futures market is at a 5 year high.

Europe: Last week I wrote that I expect more “distinct society” referendums like Brexit and Catalonia to keep pressure on the Euro. Not surprisingly, given that European currencies are a huge part of the USDX, the Euro looks to be developing a H&S top on the daily chart. The downside price target would be around 112.75.
Japan: There is a Federal election Oct 22. Abe is expected to maintain or increase his power. I’m looking to get short the Yen.
China: The 19th Communist Party Congress (held every 5 years) begins Oct 18 and runs for a week. This is an opportunity for Xi Jinping to consolidate his power and lay out his vision for the future. Chinese markets have probably been “managed” to avoid any embarrassments ahead of this Congress. I wonder if anything “busts loose” after the Congress is over.
Crude Oil: Chinese September imports were strong at ~9 mbd…YTD imports are running ~12% above year ago levels. American imports from Saudi Arabia hit a 30 year low (are the Saudis trying to manipulate the weekly American inventory reports or do the Americans just not need the Saudi oil?) Both Brent and WTI forward curves are in backwardation for 2018 and beyond. American frackers have been hitting the WTI back months with hedge selling…flattening the curve. They apparently have hedged about 30% of their anticipated 2018 production so they are substantially under-hedged and will probably become more aggressive sellers if prices rise. Front month WTI has trended $10 higher from the June $42 lows. I wonder if some people are buying crude because they think it’s “cheap.” Speculators are net long 417,000 contracts up ~ 27% from the June lows while open interest (OI) is at All Time Highs up 18% from the June $42 lows. Classic OI analysis says that rising OI with rising prices is bullish. I’ve traded WTI almost exclusively from the short side since 2014 based on a bearish view of supply/demand/inventories. I’m happy to be out of the market now. I think if prices rise another couple of dollars we could see speculative buyers back up the truck…but if prices roll over from here we could see selling from both speculators and hedgers!

My short term trading: I began this past week short WTI and long CAD. I exited both positions with small gains and I’m flat.
What do I do when I have no position? I look at my charts. I have 100’s of them on my CQG. All kinds of different markets. I look at a chart and ask myself, “Why is that?” I look at different time frames, everything from hourly to annually. I look at individual contract charts Vs. continuation charts. Why are they different? I especially look at intra and inter market spreads. I’m looking for relationships…looking for “if/then” opportunities. What I’m really looking for is an early indication of another major move…like the CAD I’ve been short for 6 years, or the WTI shorts I’ve had (on and off) since 2014, or the USD longs I’ve had (on and off) since 2011.
Like gold, silver gapped out of its downtrend last week, but volume was lacking on this move, which, given the now bullish outlook for the dollar, may turn out to be a “pop” that will be followed by renewed decline. This breakout was predicted in the last update, when it was pointed out that silver’s COTs were still far from outright bullish. You are referred to the parallel Gold Market update to read the reasons why the dollar may be shaping up for a sizable rally back to the 97 area on the index, before turning and heading south again. Needless to say, this can be expected to knock gold and silver back down again.On its latest 6-month chart we can see how silver gapped higher last week, after breaking out of its recent downtrend a few days before. As mentioned above, due to the immediate outlook for the dollar being positive, with a sizable “swansong” rally in prospect, this breakout by silver may well turn out to be a “pop” to be followed by renewed decline. How far might it drop? – a logical target, given that gold would probably drop to the $1200 – $1215 area, would be somewhere in the vicinity of its July lows, i.e. somewhere in the $15 area.


The US Dollar Index (USDI) bottomed in September a hair below 91.00 and has recently rallied up to 94. We were skeptical Gold would break its 2016 highs as it failed to show strong performance in the wake of the USDI’s decline to new lows. The market was discounting a coming rebound in the USDI and/or future weakness in Gold. In any event, although the USDI broke key levels which leave its bull market in question, it became quite oversold and was due for a sustained rebound.
First let’s look at the big picture with a monthly bar chart and the 40-month moving average. As you can see, the 40-month moving average has been an excellent trend indicator and especially since the mid 1990s. The USDI lost that support in July and in addition, made a lower low. Neither happened during the previous two bull markets.
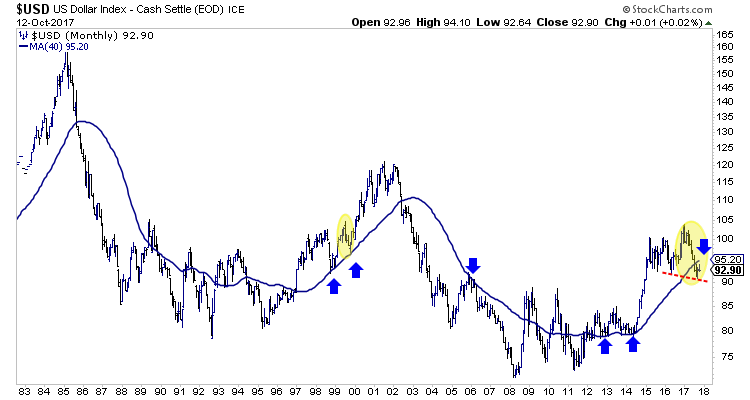
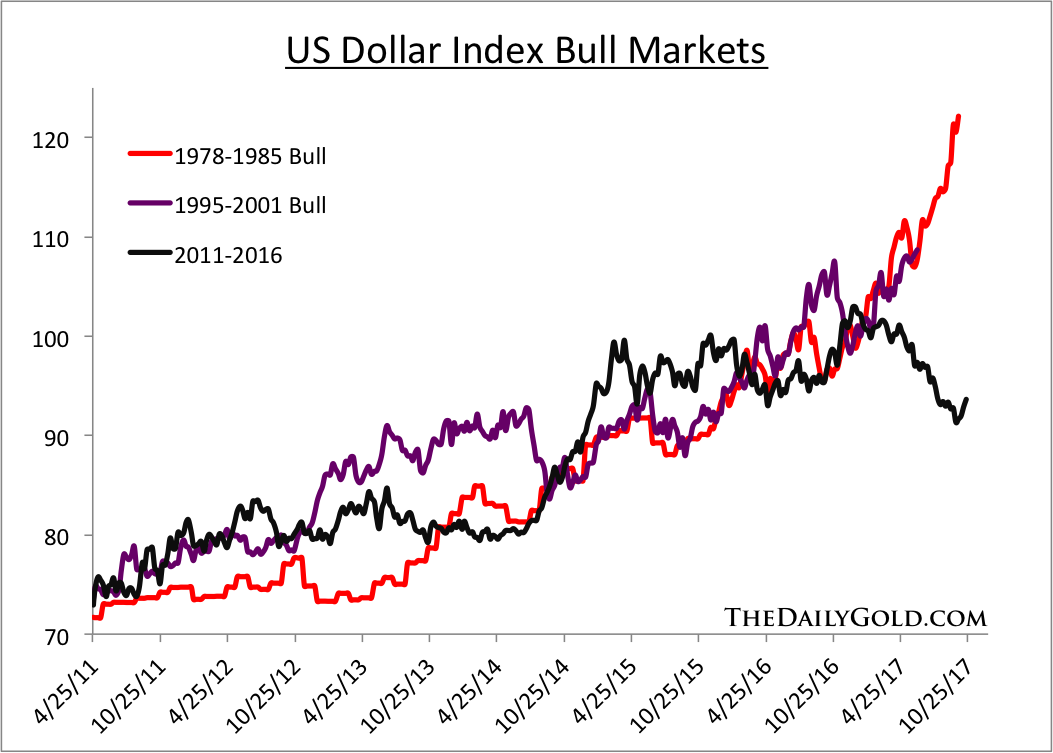
When comparing the bull market to the recent two bull markets we find that the recent correction began at the point at which the other two bull markets advanced toward their inevitable peaks.
While the longer term trend may have turned bearish, the short-term trend may have turned bullish. The USDI could be forming a reverse head and shoulders bottom. On a close above resistance at 94, the USDI has a measured upside target of 97. That target fits very well with the long-term moving averages which are coalescing around 97. (The aforementioned 40-month moving average should reach +96 in the months ahead).
We remain cautious on Gold in the near term as Gold’s correction would continue if the US Dollar Index breaks above 94. With that said, if the USDI’s primary trend has turned bearish then that certainly bodes well for precious metals and precious metals shares in 2018. If the greenback does break above 94 then we will be looking at 96 and 97 as potential levels where the rebound could reverse course. Our goal is to buy value with a catalyst or buy very oversold conditions within the junior space. This action has served us well since last December and should the USDI reach 96-97 then it could lead to low risk buying opportunities in juniors by year end. To find out the best buys right now and our favorite juniors for 2018, consider learning more about our premium service.
Jordan Roy-Byrne CMT, MFTA

-
I know Mike is a very solid investor and respect his opinions very much. So if he says pay attention to this or that - I will.
~ Dale G.
-
I've started managing my own investments so view Michael's site as a one-stop shop from which to get information and perspectives.
~ Dave E.
-
Michael offers easy reading, honest, common sense information that anyone can use in a practical manner.
~ der_al.
-
A sane voice in a scrambled investment world.
~ Ed R.
Inside Edge Pro Contributors

Greg Weldon

Josef Schachter

Tyler Bollhorn

Ryan Irvine

Paul Beattie

Martin Straith

Patrick Ceresna

Mark Leibovit

James Thorne

Victor Adair