
Currency
Yesterday, EUR/USD verified the breakdown under the upper border of the trend channel and declined, closing the day below the early August peak. What does it mean for the exchange rate?
EUR/USD
On Tuesday, we wrote the following:
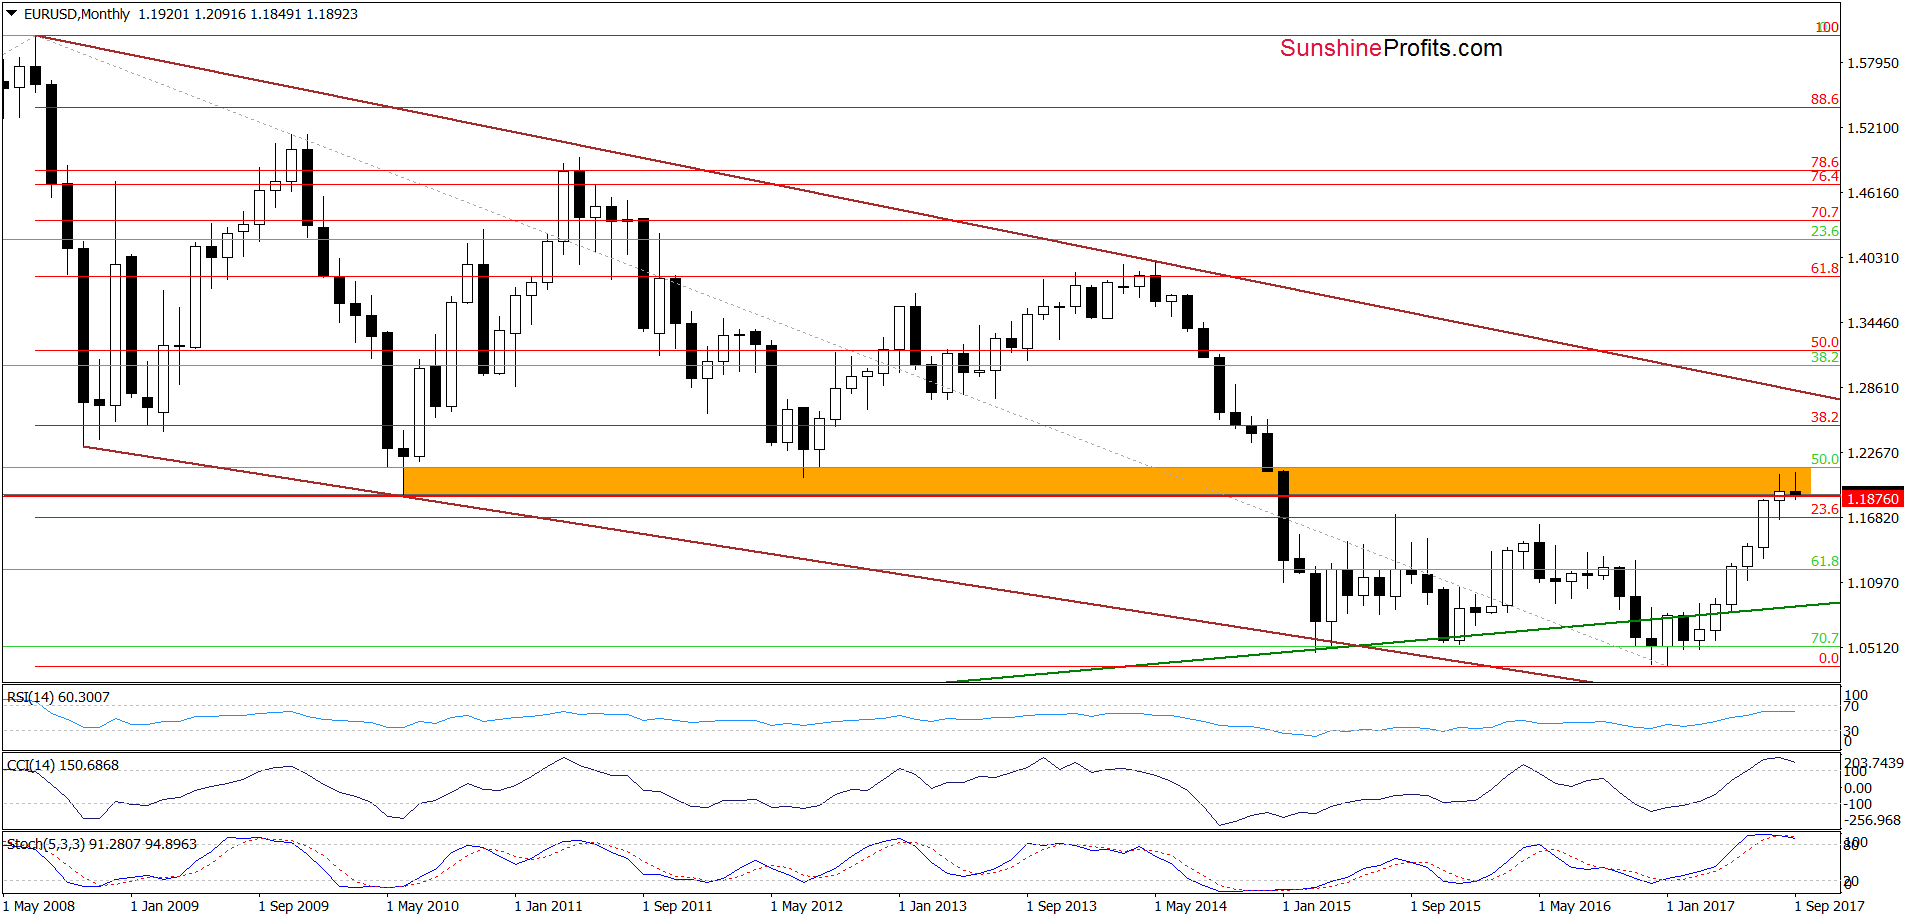
(…) on the long-term chart, we see that EUR/USD is still trading in the orange resistance zone. Additionally, indicators increased to the highest levels since April 2014. Back then, such high readings of the CCI and Stochastic Oscillator preceded bigger move to the downside, which suggests that we may see a similar price action in the coming week(s).
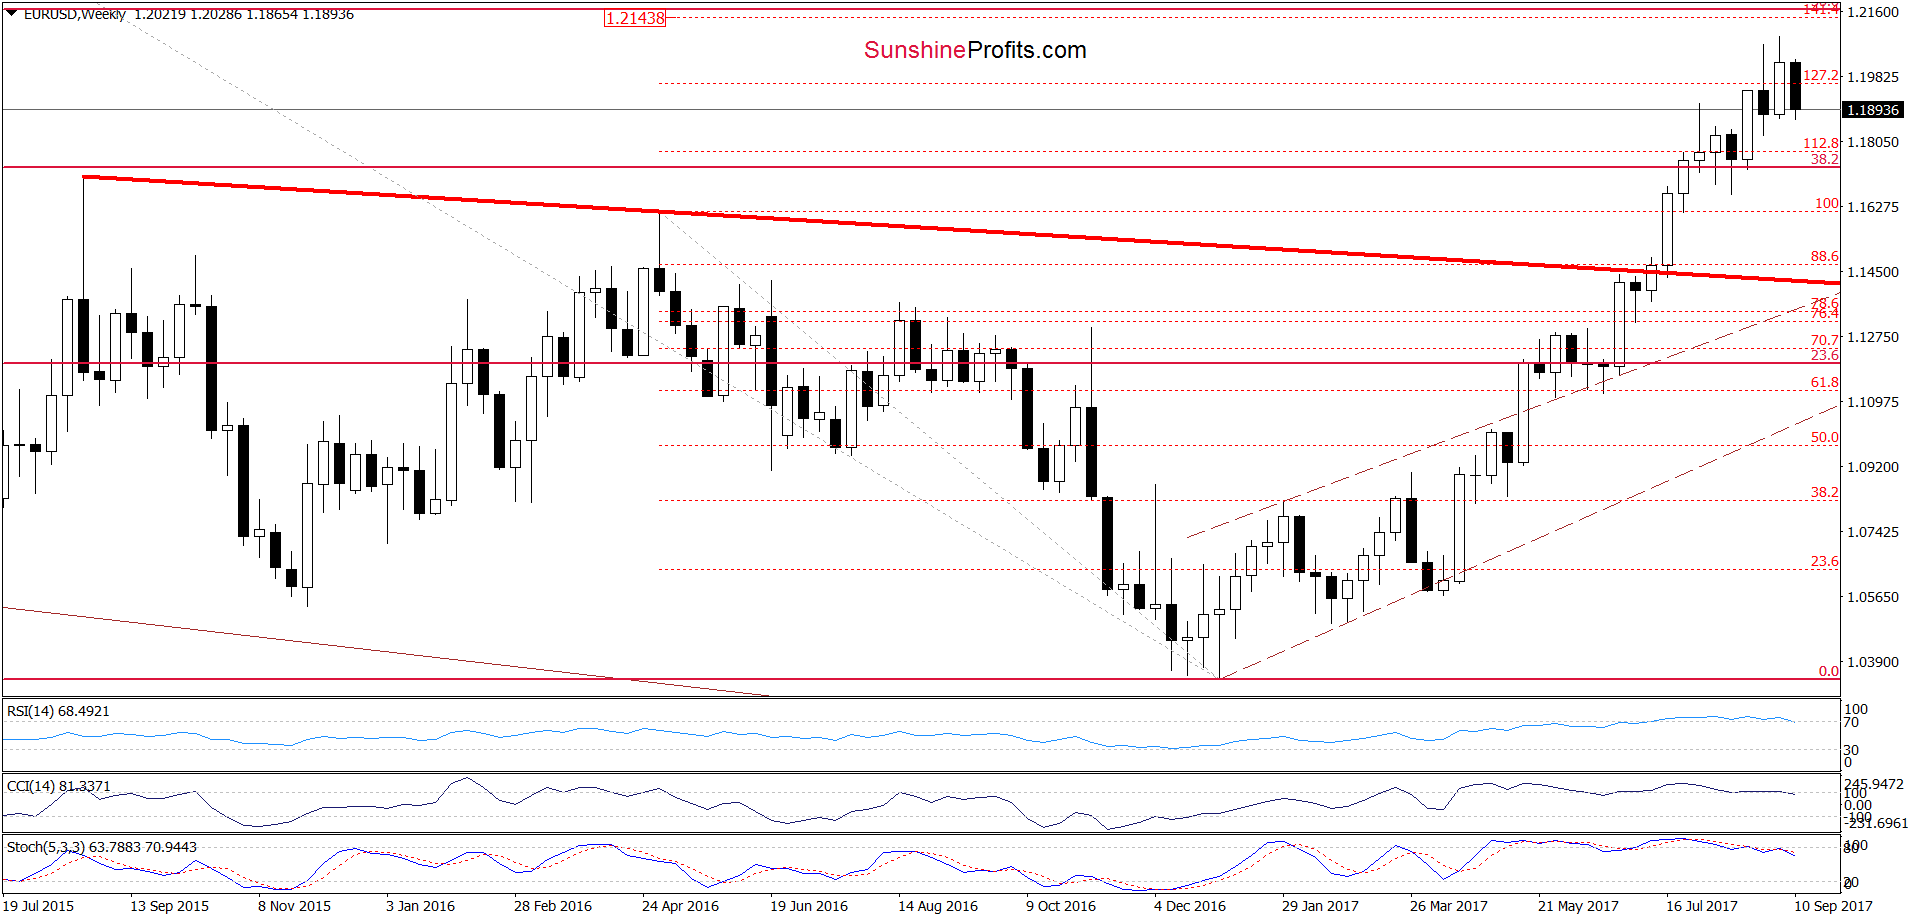
(…) on the medium-term chart (….), we can see that the CCI and Stochastic Oscillator already generated the sell signals, supporting currency bears. (…) we also see that the exchange rate is quite close to invalidating the earlier breakout above the 127.2% Fibonacci extension.
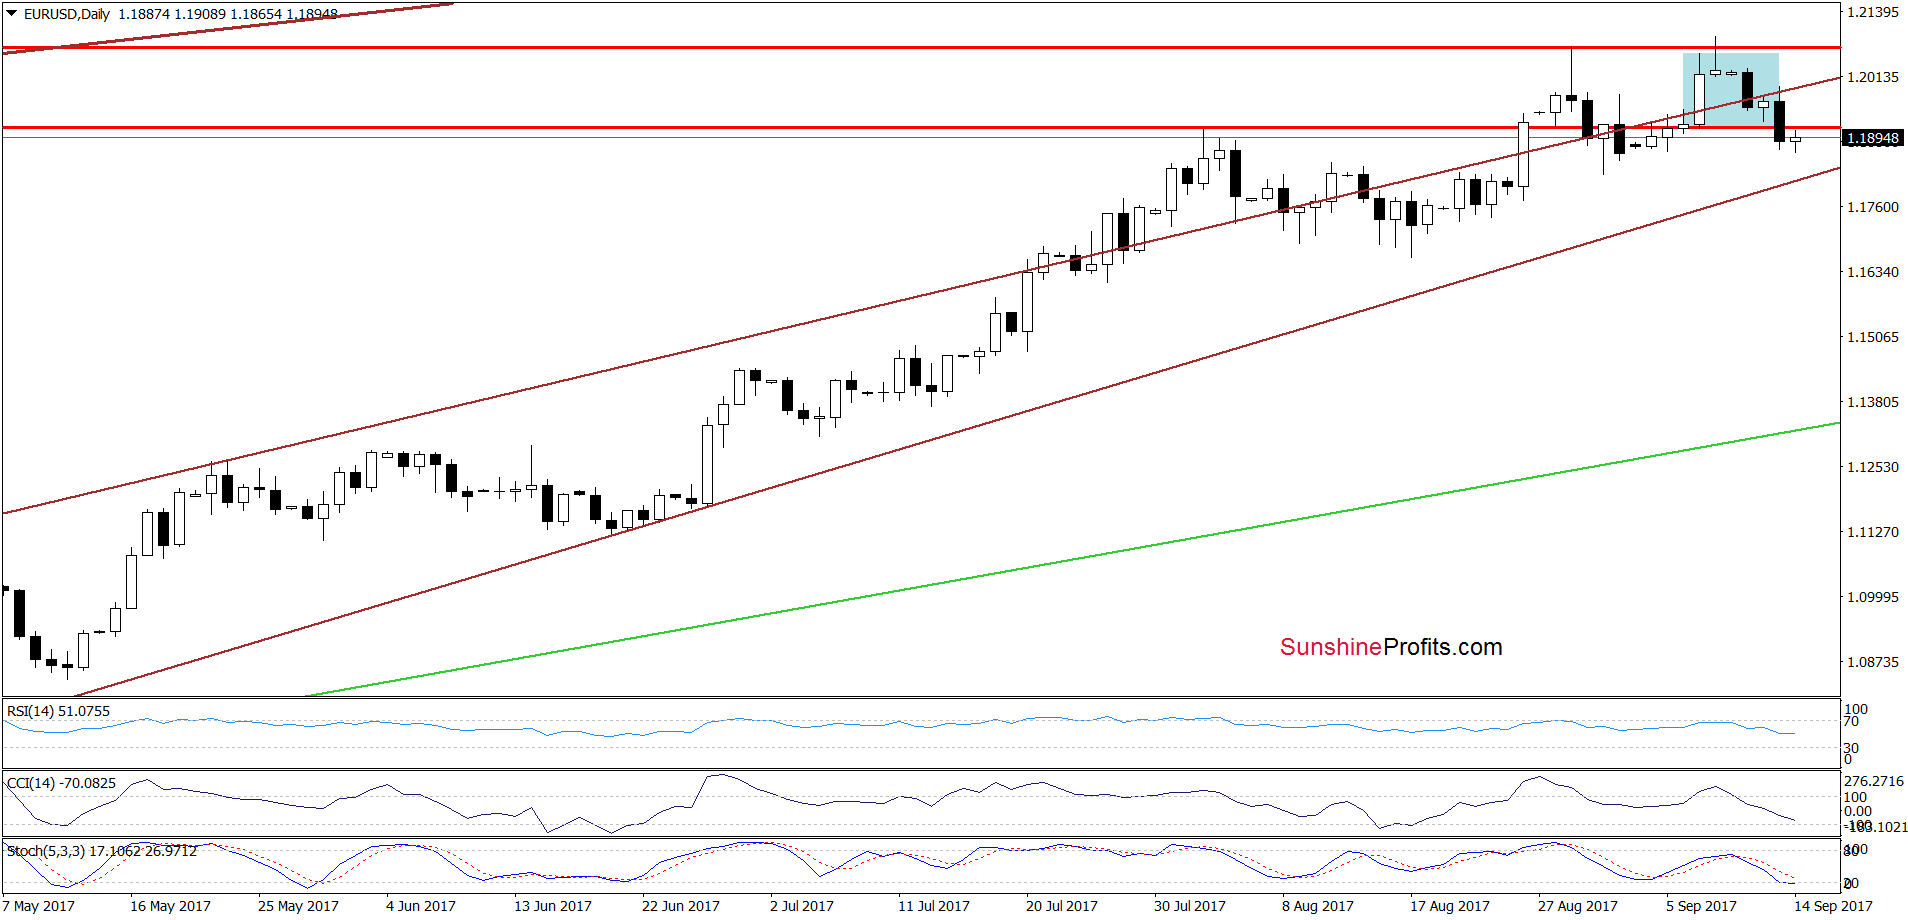
On top of that, (…), EUR/USD slipped below the upper border of the brown rising trend channel, invalidating the earlier breakout.
(…) the pair rebounded slightly, but taking into account all the above-mentioned factors and the sell signals generated by the daily indicators, we think that it’s nothing more than a verification of yesterday’s breakdown. If this is the case, we’ll see reversal and further deterioration in the very near future.
From today’s point of view, we see that the situation developed in line with the above scenario and EUR/USD declined after the verification of the earlier breakdown under the upper border of the brown rising trend channel marked on the daily chart. Thanks to yesterday’s drop the pair also slipped below the early August high and the 127.1% Fibonacci extension, invalidating the breakouts (additional bearish developments). Taking these facts into account and combining them with the current position of the monthly weekly and daily indicators, we believe that further deterioration is just around the corner. Therefore, if the pair extends losses from today’s levels, the next target for currency bears will be the lower border of the brown rising trend channel (currently around 1.1810). If this support is broken, the way to lower levels will be open.
Very short-term outlook: bearish
Short-term outlook: mixed with bearish bias
MT outlook: mixed
LT outlook: mixed
GBP/USD
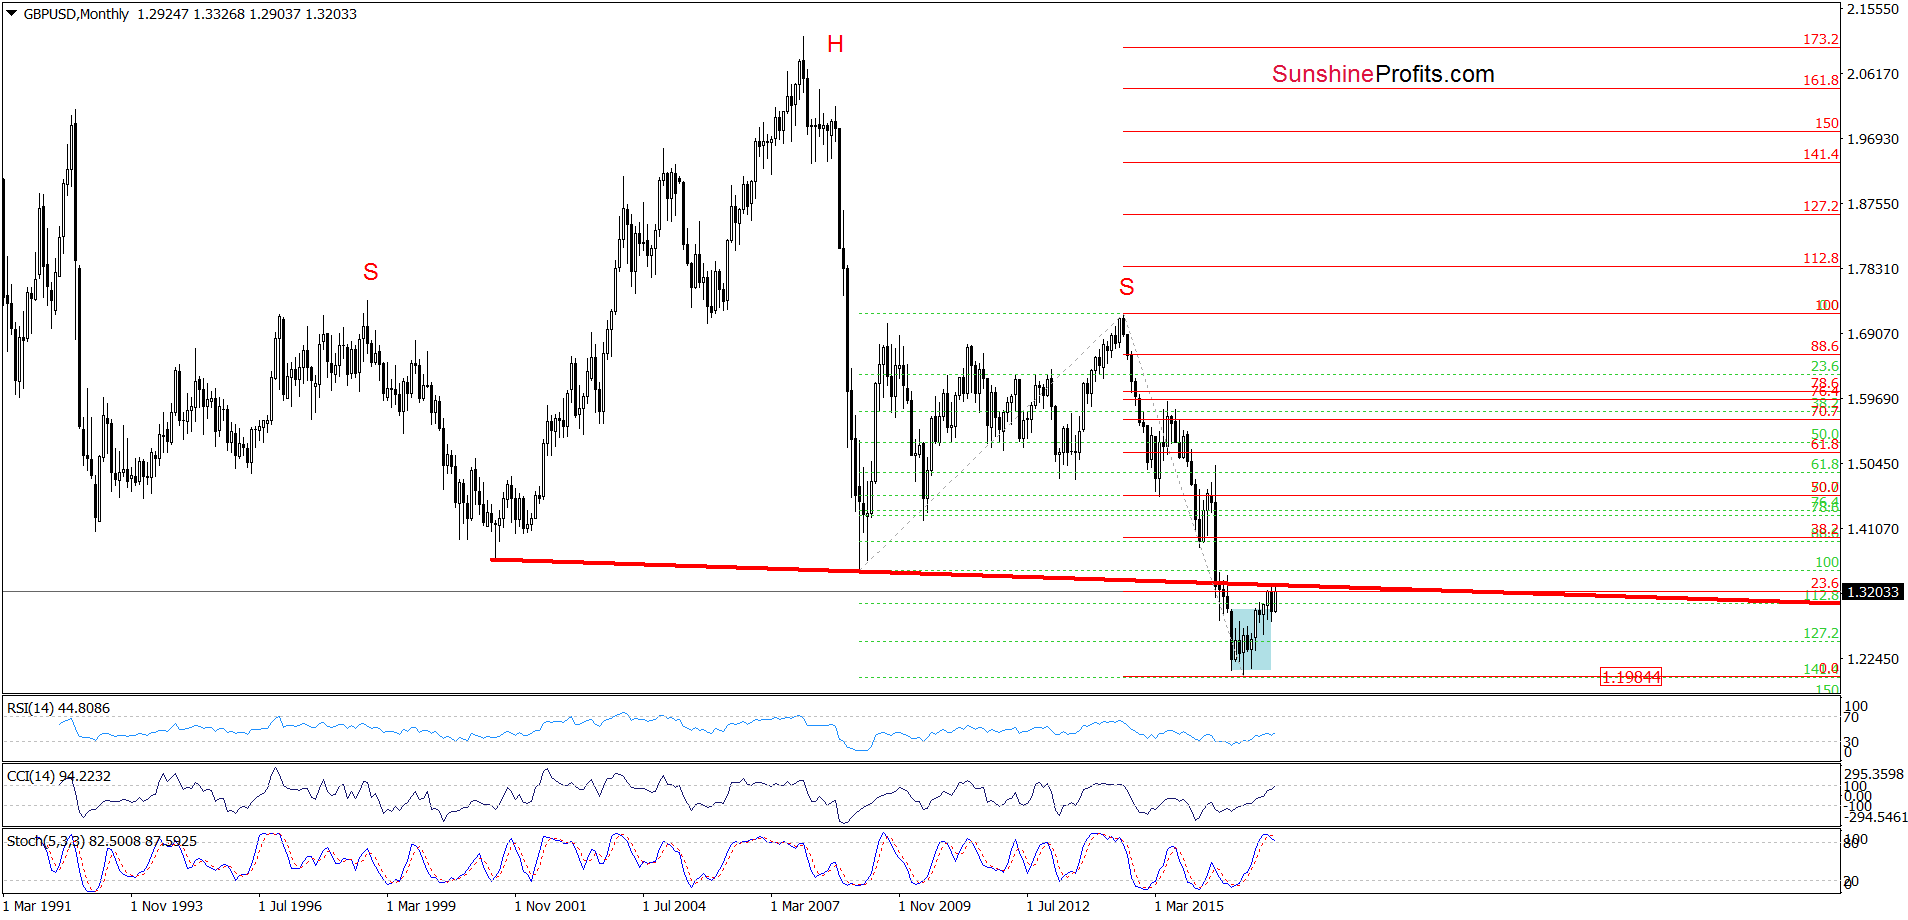
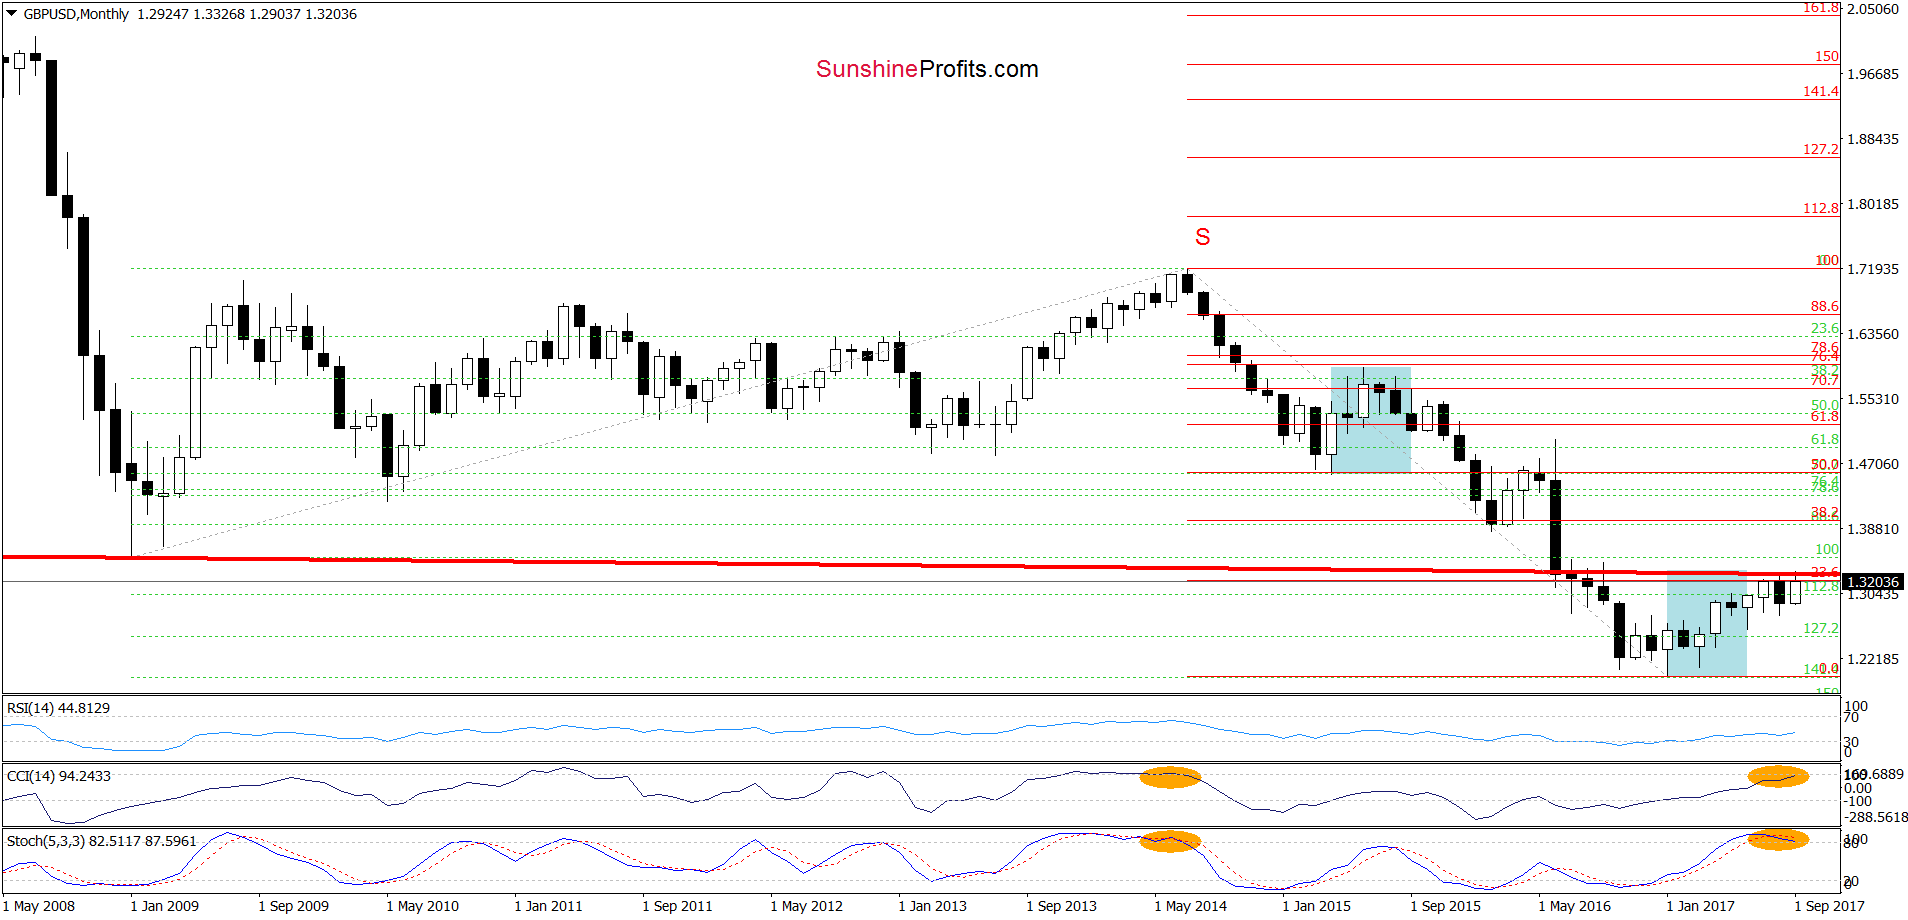
Looking at the monthly chart of GBP/USD, we see that the pair increased to the 23.6% Fibonacci retracement based on the entire July 2014-January 2017 downward move and the previously-broken neck line of the long-term head and shoulders formation once again. As you see the combination of these resistances was strong enough to stop currency bulls in the previous month, which suggest that reversal is just around the corner.
Additionally, the CCI and the Stochastic Oscillator increased to the highest levels since July 2014. Back then, such high readings of the indicators preceded sizable declines, which suggest that we may see similar price action in the following month(s).
On top of that, when we compare the size of blue corrections, we clearly see that they are almost equal, which means that currently currency bulls are not stronger than they were between April and June 2015. In our opinion, this fact also increases the probability of another attempt to move lower.
Are there any other negative factors on the horizon, which could encourage currency bears to act? Let’s examine the daily chart and find out.
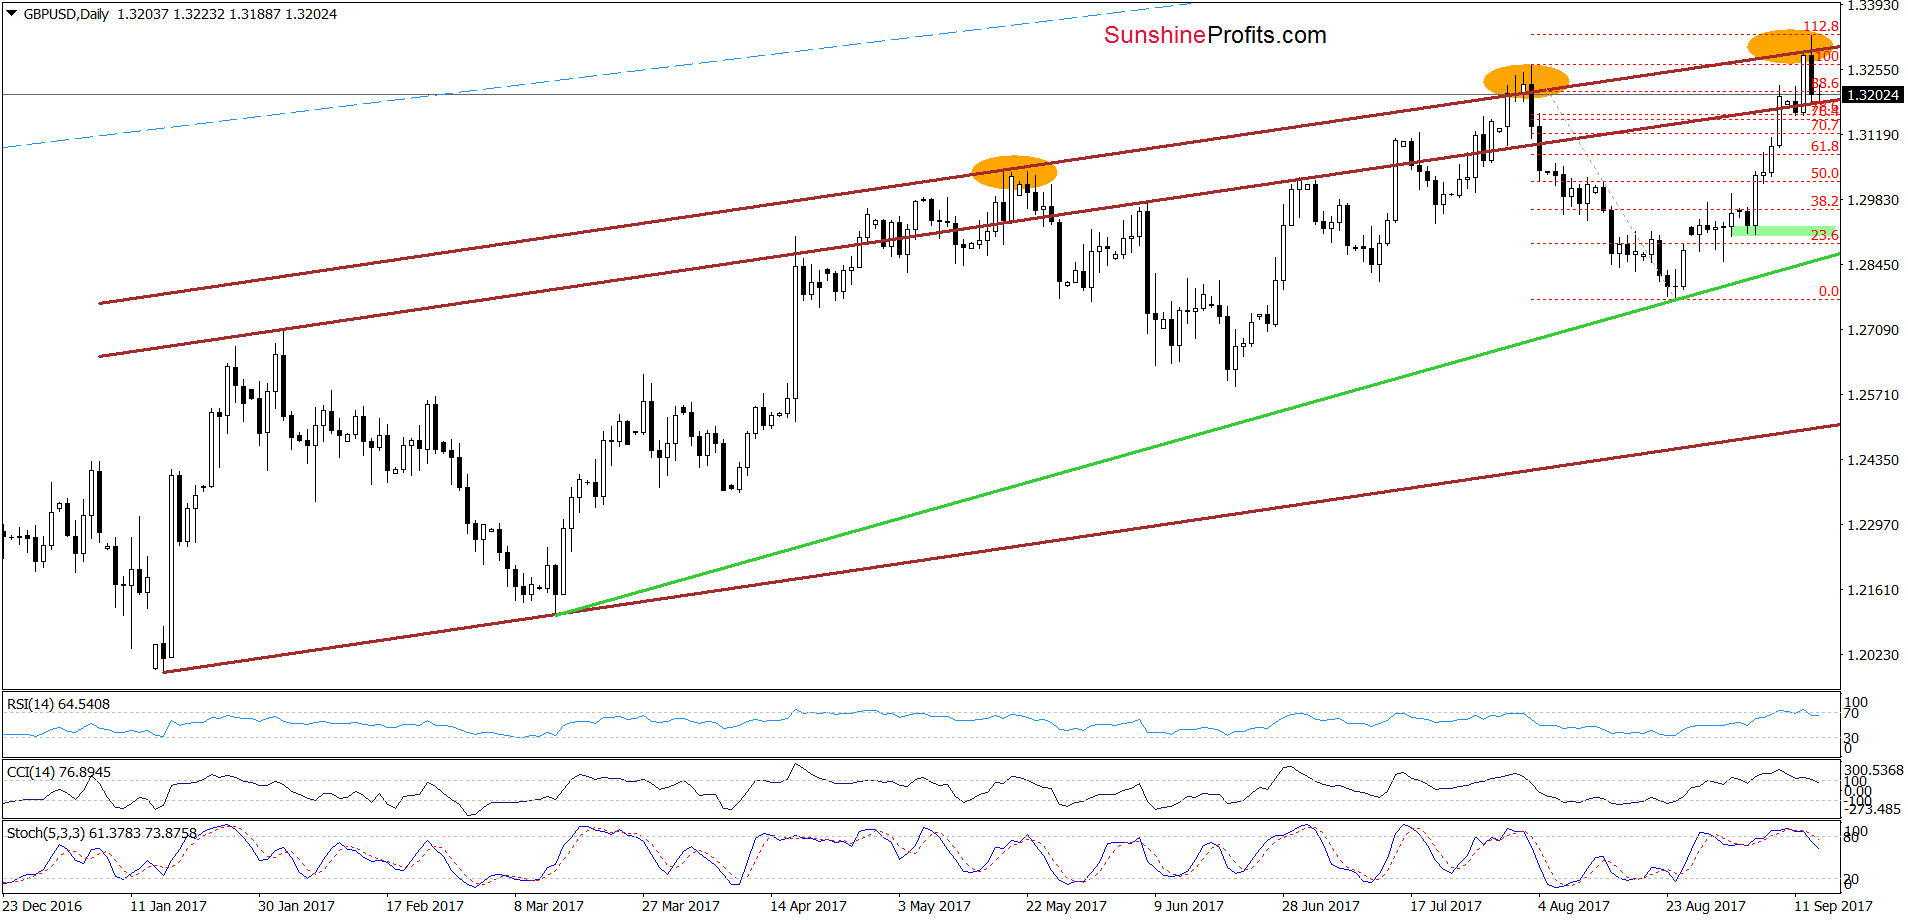
From the very short-term perspective, we see that GBP/USD increased to the upper brown resistance line (parallel to the upper border of the brown rising trend channel) once again. As you see this important resistance was strong enough to stop increases in May, August and also earlier this week, which suggests that we’ll see further deterioration in the coming days (similarly to what we saw in previous cases). Additionally, all daily indicators generated the sell signals, giving currency bears another reason to act.
How low could the pair go? In our opinion, if GBP/USD breaks below the upper border of the brown rising trend channel, we’ll see at least a drop to the green support line based on the mid-March and August lows in the following days.
Very short-term outlook: bearish
Short-term outlook: mixed with bearish bias
MT outlook: mixed with bearish bias
LT outlook: mixed
USD/CAD
On Tuesday, we wrote the following:
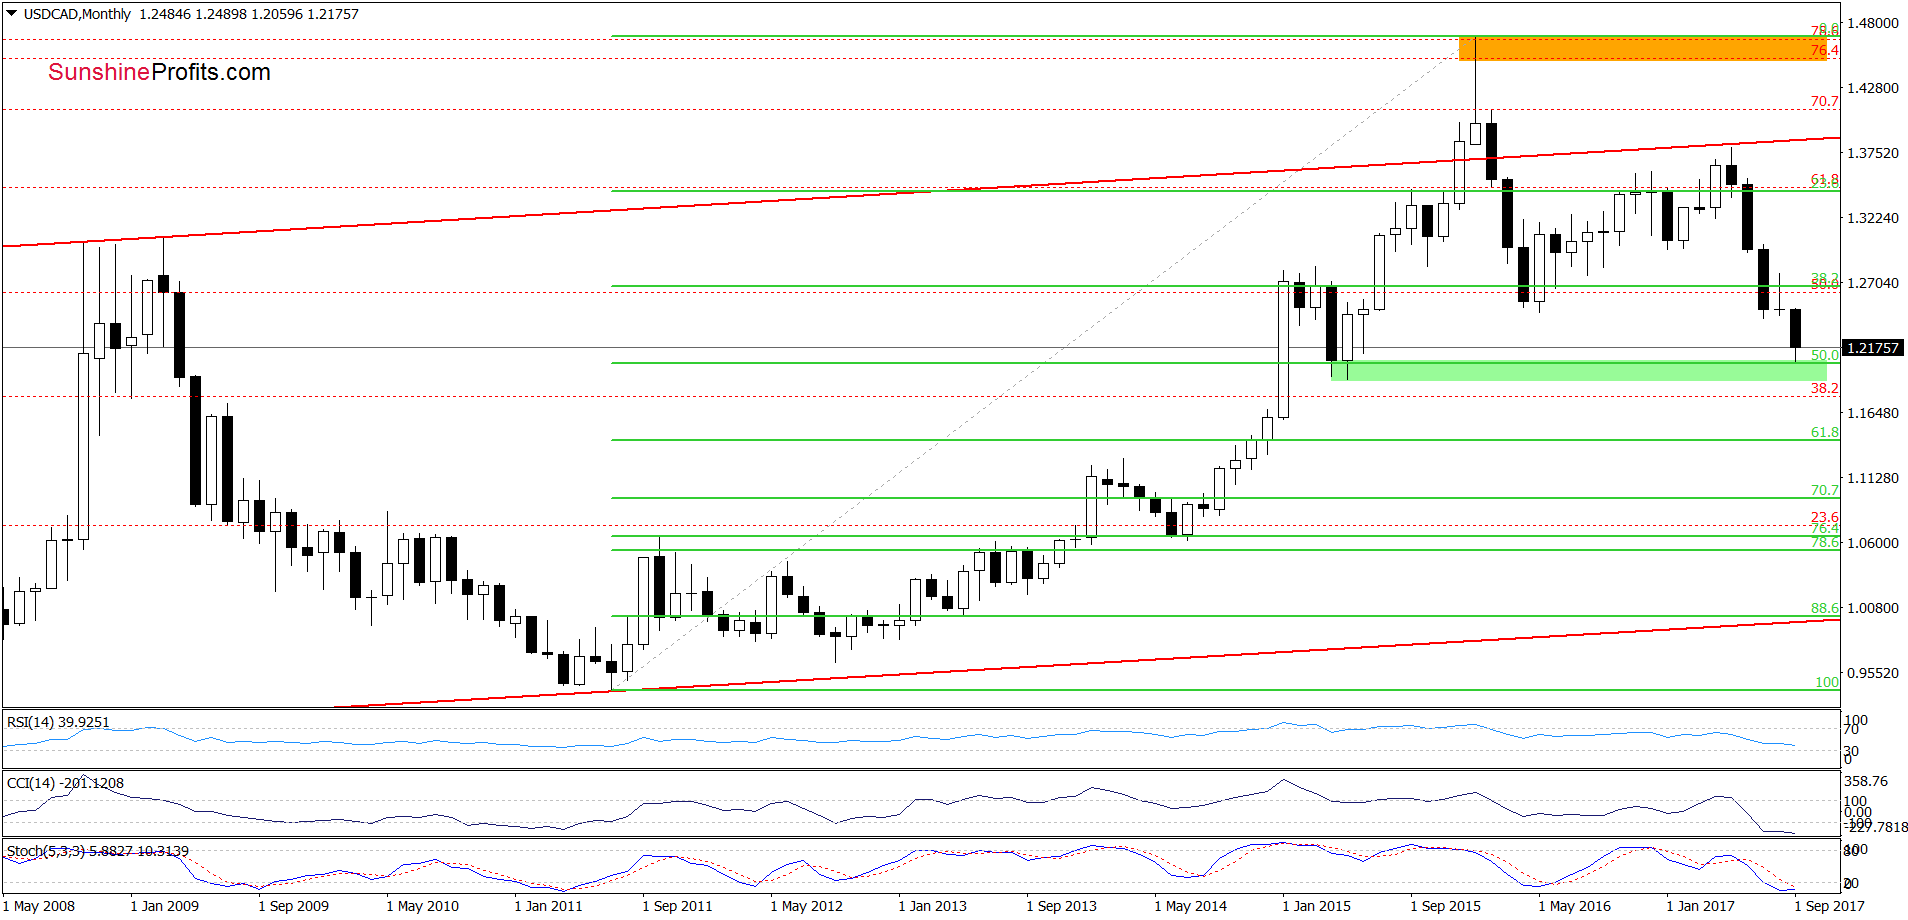
(…) although USD/CAD hit a fresh 2017 low in the previous week, the pair is still trading around the upper border of the green support zone (created by the 127.2% Fibonacci extension), which could stop currency bears in the coming week – especially when take into account the 50% Fibonacci retracement (based on the entire 2011-2016 upward move) marked on the long-term chart (…)
On the charts, we see that the above-mentioned support zone encouraged currency bulls to act (as we had expected), which resulted in a small (from the long- and medium-term perspective) rebound.
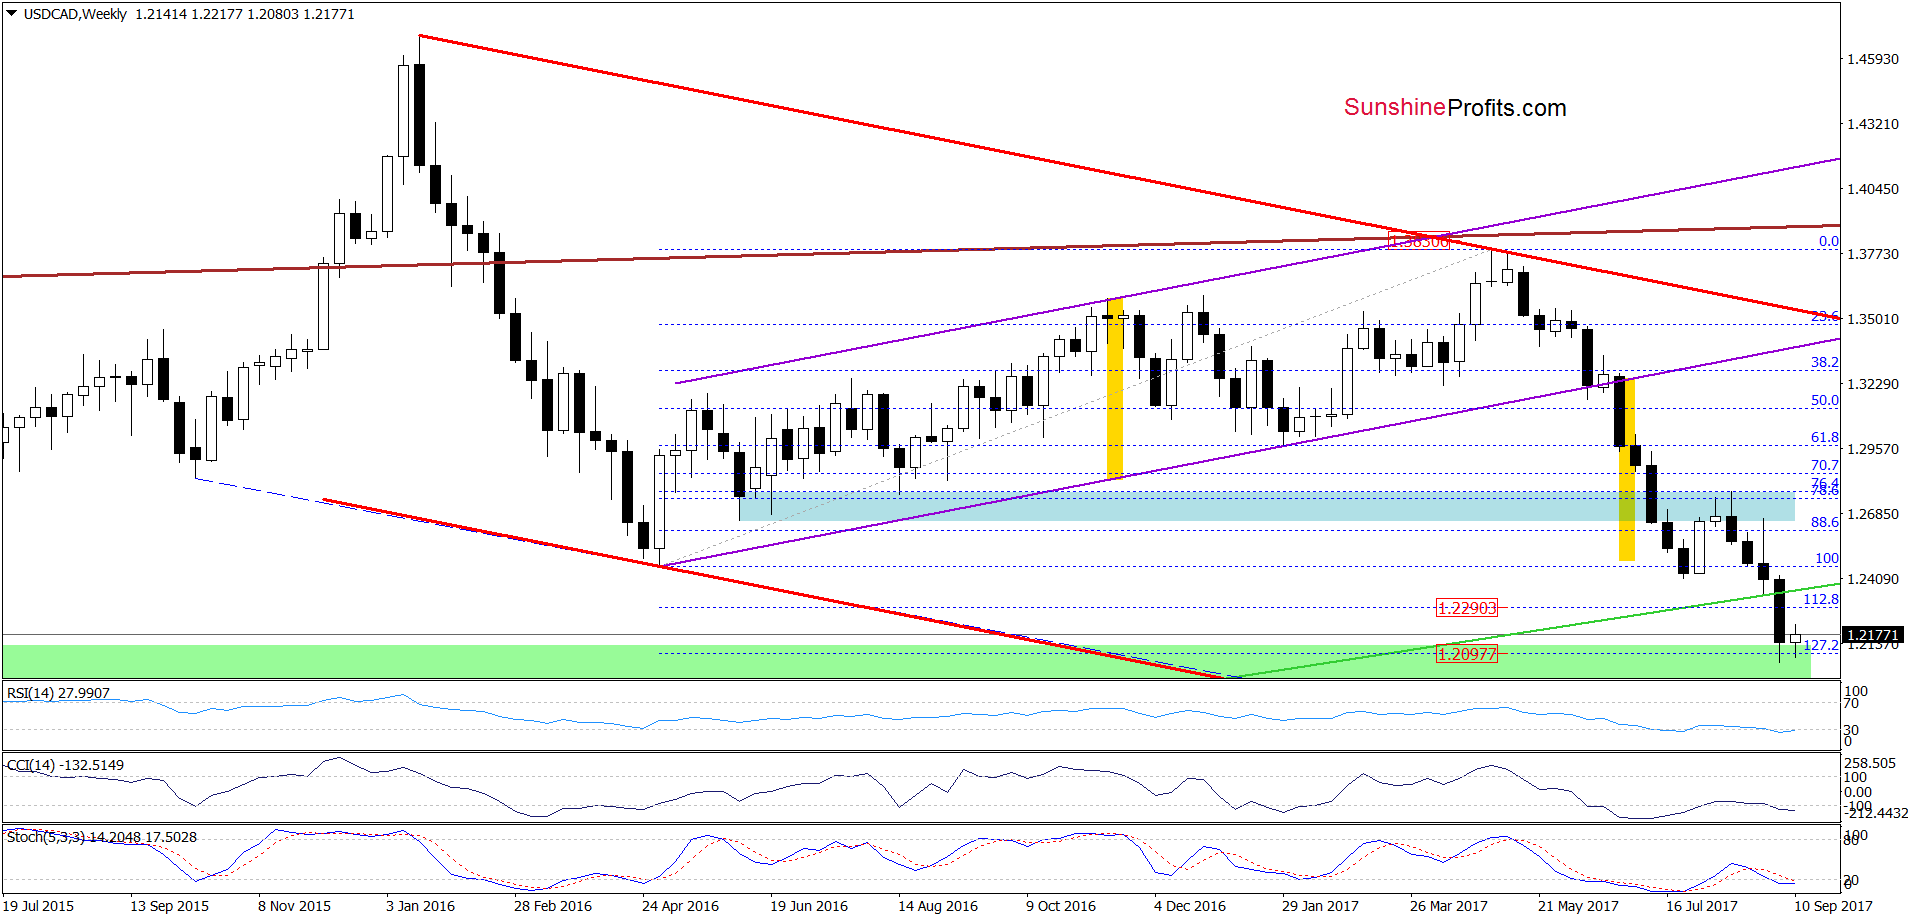
How did this move affect the very short-term picture of USD/CAD? Let’s check.
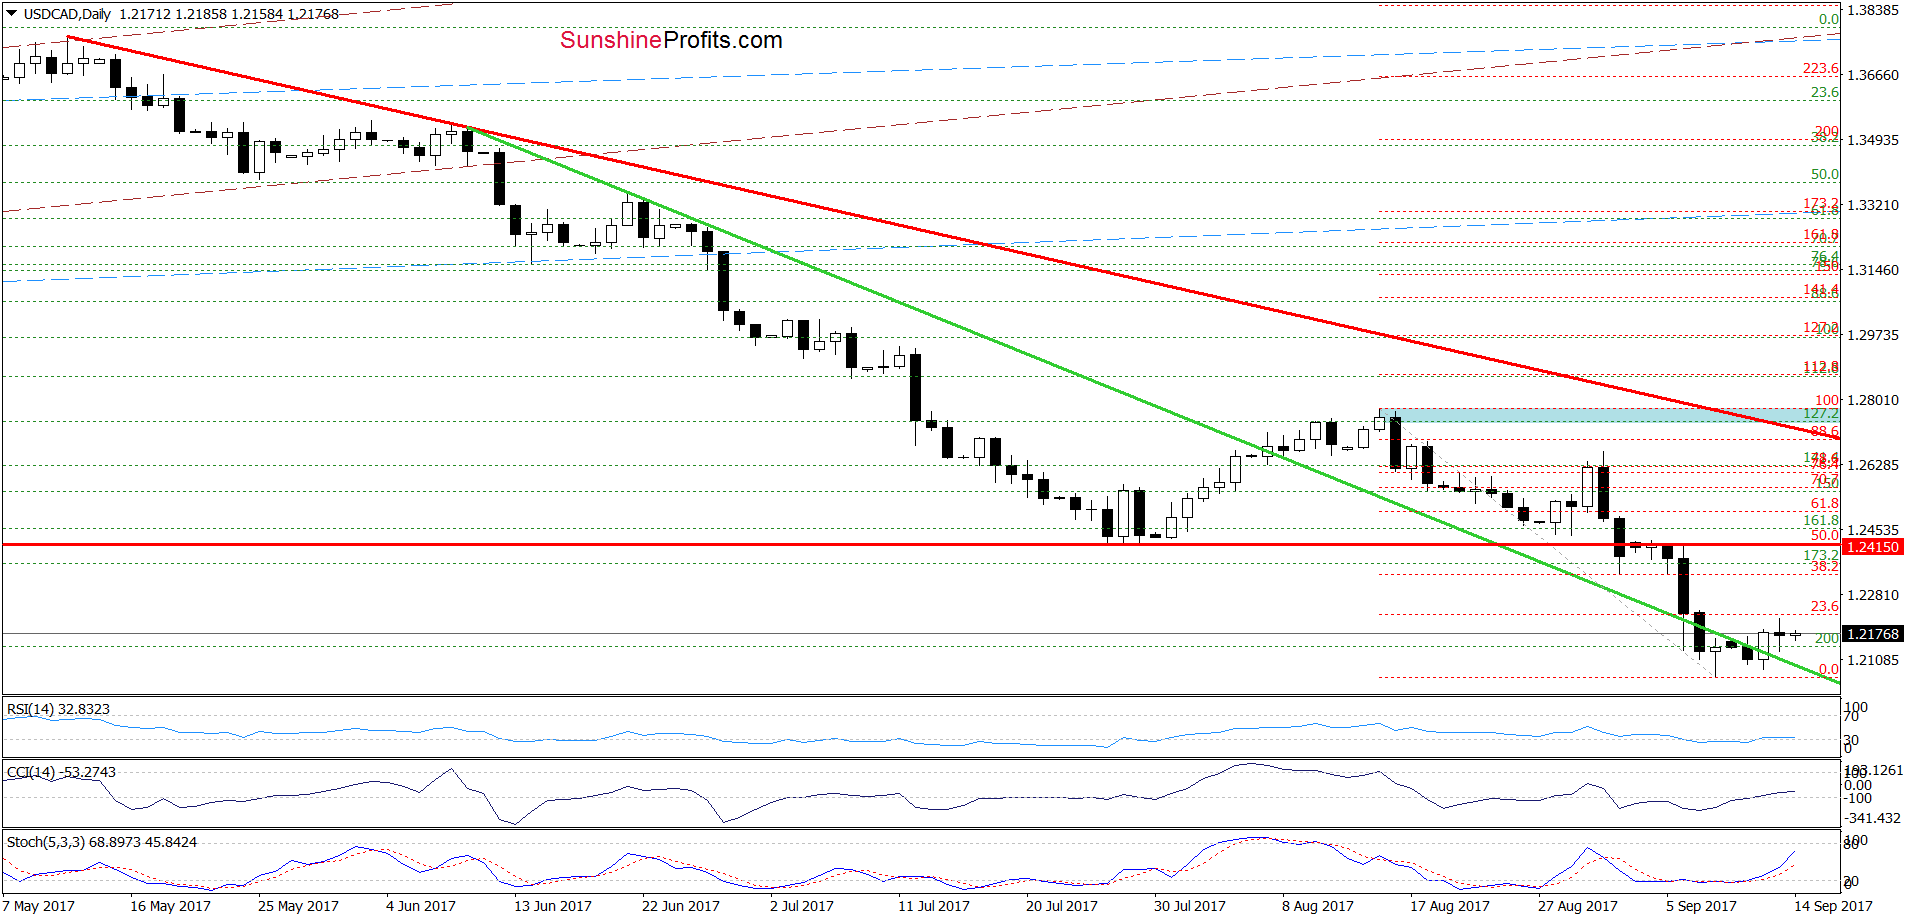
Looking at the daily chart, we see that USD/CAD climbed above the green support line and the 200% Fibonacci extension, invalidating the earlier breakdown. Additionally, the RSI, the CCI and the Stochastic Oscillator generated buy signals, suggesting further improvement.
If this is the case and the exchange rate extends gains from current levels, we’ll see an increase to the 38.2% Fibonacci retracement (based on the mid-August-September declines) or even to the red horizontal resistance line based on the July lows and the 50% retracement in the coming days.
Very short-term outlook: mixed with bullish bias
Short-term outlook: mixed with bullish bias
MT outlook: mixed
LT outlook: mixed
USD/CHF
Quoting our Tuesday alert:
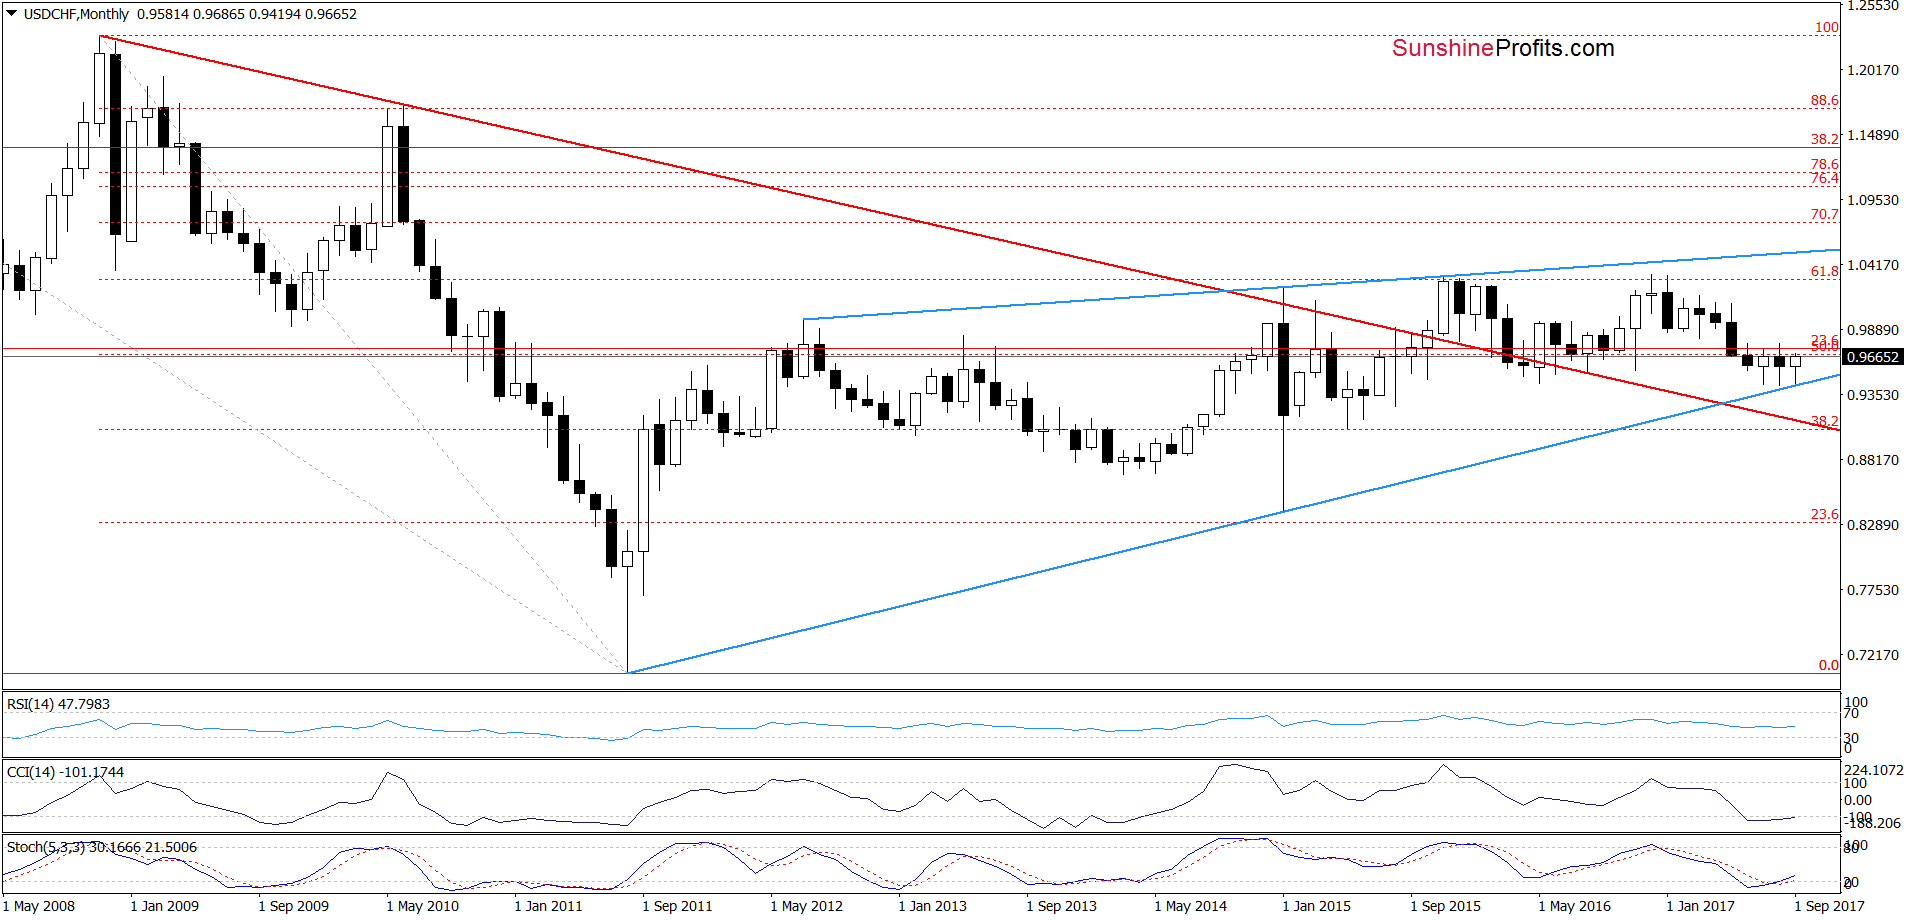
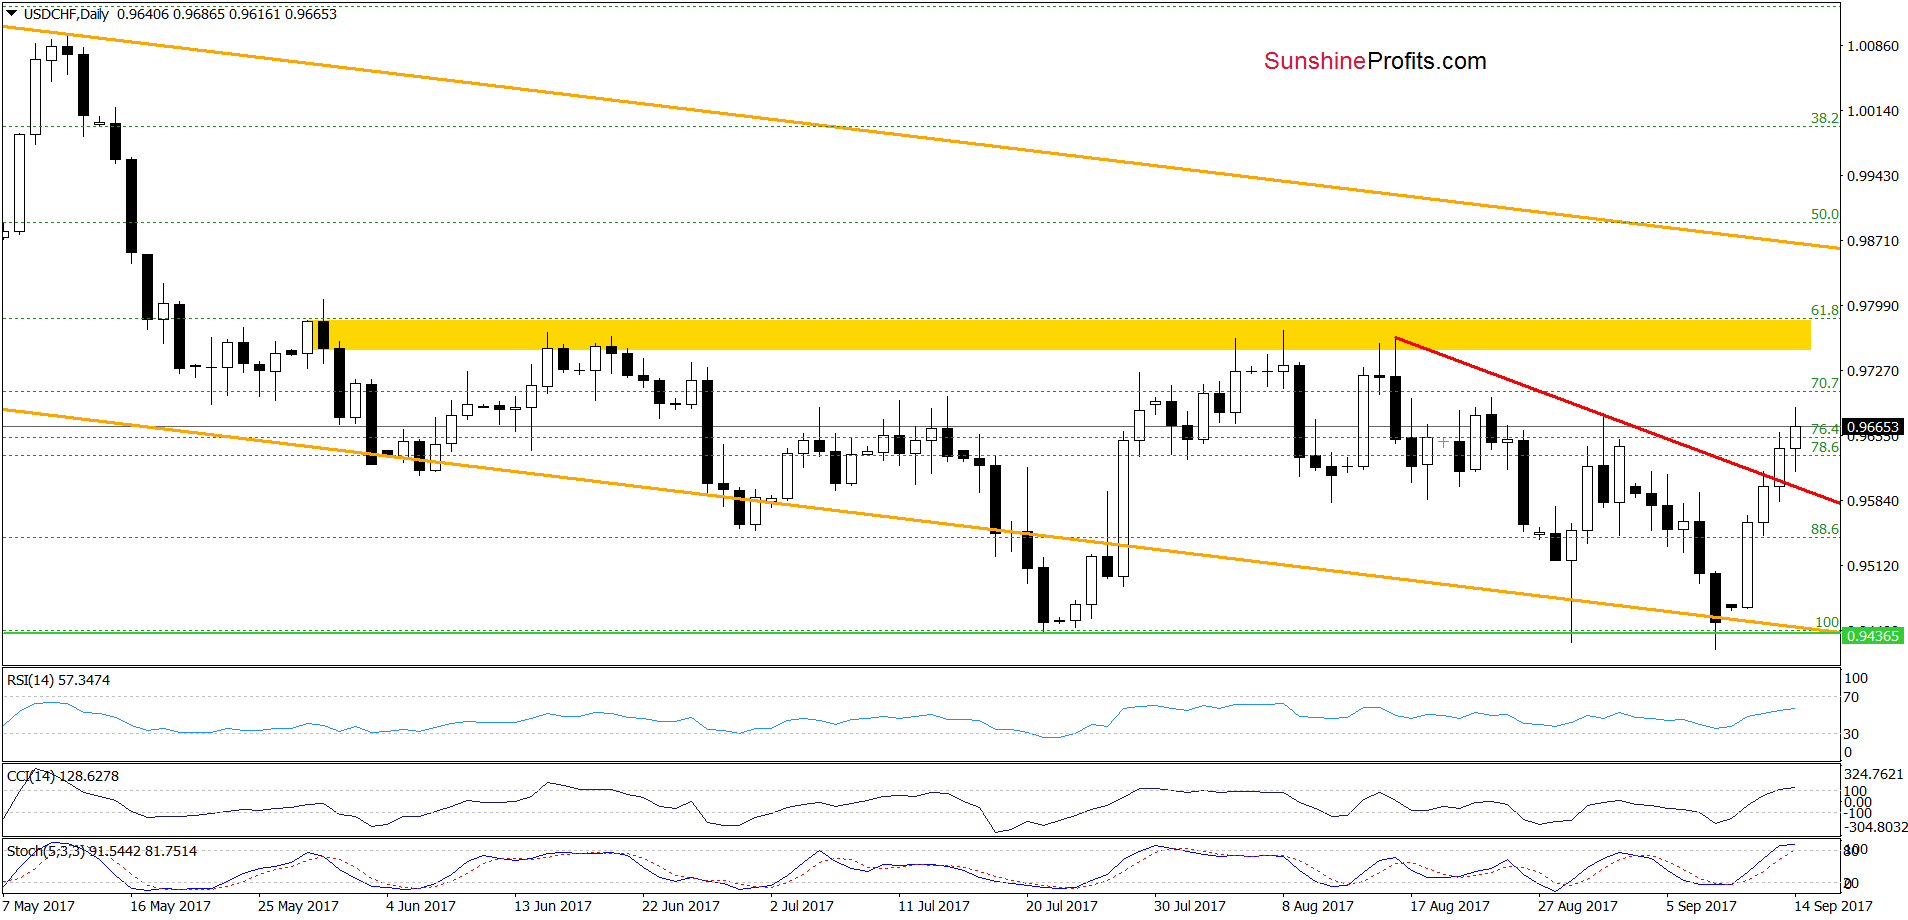
(…) USD/CHF bounced off the long-term blue rising support line seen on the monthly chart, invalidating the earlier small breakdown below the lower border of the orange declining trend channel. Taking this positive event into account and combining it with the buy signals generated by the daily (and even monthly) indicators, we think that further improvement is just around the corner. If this is the case and the pair increases from current levels, the initial upside target will be the yellow resistance zone seen on the daily chart (around 0.9751-0.9781).
From today’s point of view, we see that USD/CHF broke above the red declining resistance line based on the previous highs, which together with buy signals generated by the indictors (they are still in play) suggests that we’ll see realization of our Tuesday scenario in the coming days.
Very short-term outlook: mixed with bullish bias
Short-term outlook: mixed with bullish bias
MT outlook: mixed
LT outlook: mixed
Naturally, the above could change in the coming days and we’ll keep our subscribers informed, but that’s what appears likely based on the data that we have right now. If you enjoyed reading our analysis, we encourage you to subscribe to our daily Forex Trading Alerts.
Thank you.
Nadia Simmons
Forex & Oil Trading Strategist
Przemyslaw Radomski, CFA
Founder, Editor-in-chief, Gold & Silver Fund Manager


QUESTION: Dear Mr. Armstrong,
I have been reading your blog for over a year now. Your posts are a superb read and one of the first things I check every morning before leaving for work! Although I admire your work and writings a great deal, I’m sometimes surprised by the level of certainty you seem to have about how things will unfold in the future. You stated multiple times now that ‘only a rising dollar will break the world monetary system’, but with more and more countries trying to bypass the dollar system, how will the dollar ever get to the strength that is needed to do so? Will the world monetary system break for sure, or is there an alternative ‘softer’ transition possible on a global scale?
Thank you for your insights!
B (from Belgium)
ANSWER:
 All the governments of the entire world can try their best to create some new currency to dethrone the dollar. They will fail just as Europe has failed with the Euro, You can denominate oil to peanuts in some other currency but that still will never put a dent in the dollar. Why? It is capital flows than count and trade is minimal. When you cash out of your commodity, where do you put your profits? Oh back into dollar denominated instruments?
The failure of Europe was to create a single debt. Instead, capital must still pick and choose between the Eurozone members and who do they trust more to buy their bonds. Just look at the interest rate differentials. They are all denominating their debt in Euros, but their credit ratings differ just as they do among the States that compose the USA. Germany wanted a single currency for trade, but they did not want to consolidate all the debts in Europe. Hence, we ended up with a single currency that could never become a major currency with no central core.
China will replace the dollar but only AFTER 2032. Until then, they must still work on establishing the Rule of Law so that capital will park in yuan with confidence. Denominating oil in yuan or euro means nothing. Where will you park your cash? That remains dollars for major institutions. There is no alternative. Even the Japanese yen is not a free currency because the government retained control over anyone anywhere issuing and debt in yen without government approval.
 In general, Europeans are still trapped in World War II thinking that a stronger currency means economic boom. When all the currencies were wiped out by the war, politicians used the currency value in Europe as a reason to prove they were doing a good job. So the historical bias in Europe has been dominated by the perspective. The USA was a third world country during the 19th century. It was the “emerging market” for European investors. It was virtually bankrupt in 1896 and it was World War I and II that raised the USA to the richest country in the world by 1950 holding 76% of the total world gold reserves. That was accomplished not by Marxism, political economic manipulation, or anything any politician enacted. It was create SOLELY and EXCLUSIVELY by capital inflows because of Europe running around destroying itself.
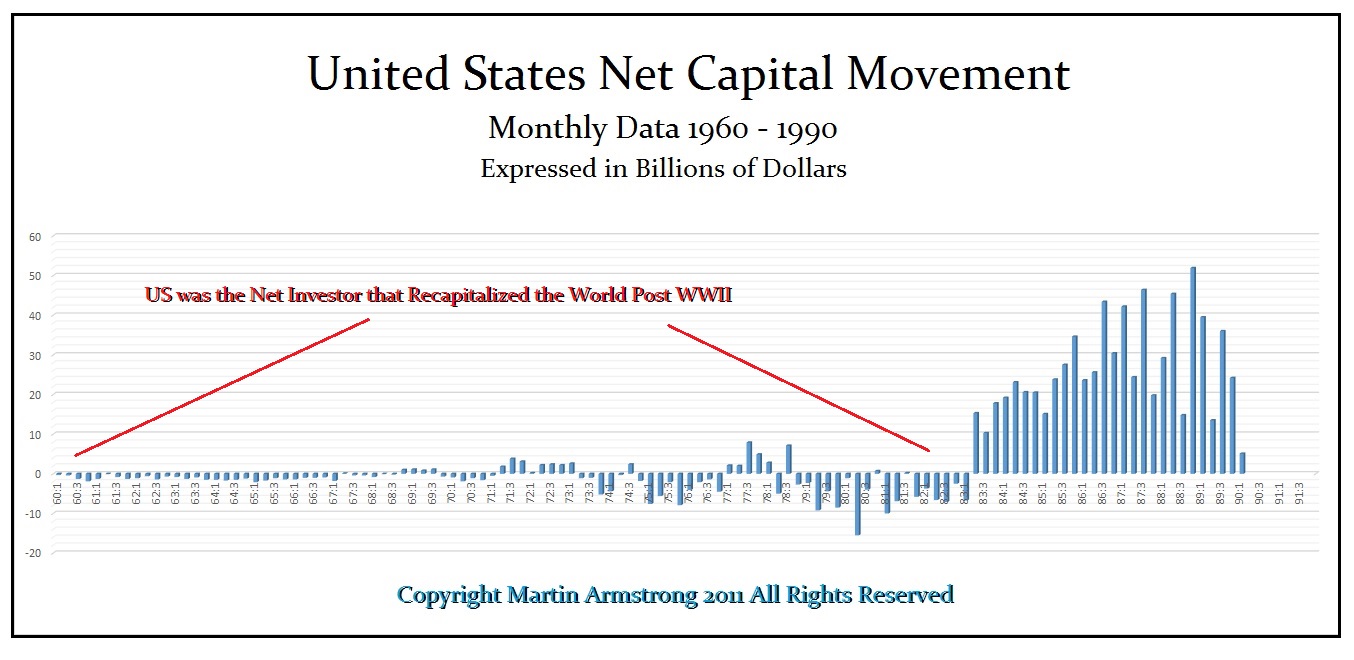
Above is a chart of the capital flows from 1960 to 1990. It was the US net investment that rebuilt Europe – not Marxism adopted by European Politicians in response to the Russian Revolution in 1917. The capital concentrated in the USA and then moves back to Europe as investment. It was the USA that rebuilt Europe – plain and simple.

We have reached a 5000 year low in interest rates. The ECB owns 40% of all Eurozone government debt. If any central bank is in danger of collapsing it is the ECB. Raising rates will create a huge whole in their balance sheet. Then the true cost of QE will be exposed. Why do you think Draghi is dragging his feet. He knows stopping to buy the debt will cause rates to rise because the governments will be forced to find real buyers. Only a complete fool would rush in where the ECB is withdrawing.
 There is no one who wishes this forecast will be wrong than me. Then I can retire, say goodbye to the world and fade into the sunset. Everyone knows I do not need the money. We do not even sell advertising on this blog. We do not force you to register and then bombard you with endless emails trying to sell you something. I too have family. I fear for their future – not my own. I would much rather say it’s time to Beam Me Up Scottythan having to deal with nonsense I cannot prevent. This is not my personal opinion.
The ONLY time we get monetary reform is when the dollar RISES, not declines. Hey, if the dollar declines, then interest rates will continue to travel negative, gold will collapse, the stock market will implode, and Trump will emerge as the best president in history creating massive new American jobs exporting everything not just blue jeans, rock & roll, and US corrupt law. Emerging markets can keep borrowing dollars with no end, dumping commodities than are at excess supply, and everyone will be perpetually happy – the euro will be strong at last and magically the ECB can just keep European governments on life support without end.
Unfortunately, governments are broke. They are hunting people with any money at all and that creates a disincentive to invest, rising unemployment, and civil unrest turning the poor against the rich instead of the poor against the politicians who have created this mess. The negative interest rates harm the poor and middle class where the rich can export their money and invest outside their country to preserve wealth.
No, I am sad to say this is the net result of merging all global trends – not my opinion or preferred outcome. I am not even making this forecast just to scam you into buying some book by hyping the situation. My only incentive is to save my own family. As I said, if this was just for me, I would now go enjoy life while I am still in reasonable shape to explore the world.
….also from Martin:

 The USD/CAD fell close to 1400 pips from the May 2017 highs into the July lows. In August the currency pair retraced over 350 pips topping out at 1.2777. Since the high that was struck on August 15, the USD/CAD has once again moved back under the July lows and is now trading more than 500 pips below that August 15 high.
On Wednesday, September 6, the Bank of Canada increased its benchmark interest rate to 1%. Following the announcement of this news, the USD/CAD moved lower, breaking down under a key support level at 1.2330, signaling that further follow through to the downside was likely.
Now along with the move lower in the USD/CAD, the U.S. Dollar Index (DXY) has also continued to move lower. The U.S. Dollar Index is already deep into its support zone for its potential wave 4. The USD/CAD, on the other hand, is still about 300 pips over the longer-term target zone, which comes in at the 1.1754-1.0986 area.
So, whether the USD/CAD and DXY Index will find a bottom simultaneously is still somewhat uncertain. What is more certain is that neither the DXY nor the USD/CAD have shown any signal of having formed a bottom just yet.
I have been looking for these lower levels on the USD/CAD for quite some time. In fact, ever since the pair made a large degree 5 wave move down into the May 2016 lows, I was expecting to see another large swing lower. I will note, however, that the correction from the May 2016 low into the May 2017 high took much longer than I had expected. From a price perspective, however, it has followed the pattern almost perfectly.
As noted above, the 1.2330 was a key short-term support level that I had been keeping a close eye on this week. Once that level broke to the downside, it gave us confirmation that the move down off of the August 15 high was likely to follow through down towards at least the 1.2162 level and potentially as low as the 1.1699 level.
Now that the 1.2162 support has broken, the door is open for the pair to see a fairly clear path directly down towards the 1.1699 level. We do, however, need to hold under the 1.2374-1.2238 resistance zone if we are going to see direct follow through down towards those levels. A break back above the 1.2374 level would be the initial signal that we may have formed at least a local bottom in the USD/CAD.
Although the USD/CAD has yet to reach its target zone, I am certainly becoming much more cautious to the short side continue to extend lower. With that being said, as long as the pair holds the 1.2374 level that zone is still well within reach.
See charts illustrating the wave counts on the DXY and USD/CAD.
Mike Golembesky is a widely followed Elliott Wave technical analyst, covering U.S. Indices, Volatility Instruments, and Forex on ElliottWaveTrader.net (www.elliottwavetrader.net), a live Trading Room featuring intraday market analysis (including emini S&P 500, metals, oil, USD & VXX), interactive member-analyst forum, and detailed library of Elliott Wave education.
One of the uncertainties with cryptocurrencies has always been how governments would react once bitcoin and its kin got big enough to actually threaten the monopolies of national fiat currencies.
That day seemed to be approaching as cryptocurrencies’ aggregate market cap blew through $100 billion and the pipeline of new bitcoin wannabes (initial coin offerings, or ICOs) swelled into the hundreds. Even – in a classic sign of a bubble top — Paris Hilton got involved:
Hotel Heiress Paris Hilton Is the Latest Celebrity to Promote an ICO
(Coin Desk) – Celebrity heiress and reality TV star Paris Hilton has taken to Twitter to announce her participation in a token sale, or ICO.
Called Lydian, the venture claims the project is developing “blockchain driven technologies to reduce ad fraud and to maximize the effectiveness of ad marketing expenditures.” The idea has been floated by a number of projects of late, including efforts backed by advertising industry participants.
In the tweet, Hilton wrote:
Looking forward to participating in the new @LydianCoinLtd Token! #ThisIsNotAnAd #CryptoCurrency #BitCoin #ETH #BlockChain pic.twitter.com/a8kT9eHEko
— Paris Hilton (@ParisHilton) September 3, 2017
And lately governments have indeed begun to defend their turf. The US Internal Revenue Service decided that since cryptocurrencies were clearly not money (only the dollar is money!) they must be commodities, which means every transaction creates a taxable gain or loss. In August the IRS drove the point home by unveiling software that can track supposedly anonymous crypto transactions:
The IRS Has Special Software to Find Bitcoin Tax Cheats
(Fortune) – One benefit of using bitcoin is the digital currency can be anonymous—its owners can move money around the world without revealing who they are. Well, in theory at least. In reality, bitcoin is less secret than people think.
The latest reminder of this comes via a report that the Internal Revenue Service is using software to unmask bitcoin users who have failed to report profits. According to a contract unearthed by the Daily Beast, the IRS is paying a company called Chainalysis to help identify the owners of digital “wallets” that users employ to store their bitcoins.
In a letter to the IRS, the co-founder of Chainalysis says the company has information on 25 percent of all bitcoin addresses and that it deploys millions of tags to help track and identify transactions.
The decision by the IRS to license the software of Chainalysis, which is based in Switzerland with an office in New York, appears to be part of the agency’s larger campaign to target digital currency users who have failed to pay tax.
As Fortune reported earlier this year, the IRS claims only 802 people declared a capital gain or loss related to bitcoin in 2015. This is significant since the price of bitcoin soared from around $13 to over $1100 between 2013 and 2015, and hundreds of thousands (like millions) of Americans bought and sold digital currency during this time—in other words, there are many people who face bitcoin-related tax trouble, and the IRS is tracking some of them down.
Then China decided it had had enough of the dot-com-like tsunami of new digital currencies pouring into its economy, and banned future releases, crashing the price of most extant cryptocurrencies.
China Halts Initial Coin Offerings
(Bloomberg) – Bitcoin tumbled the most since July after China’s central bank said initial coin offerings are illegal and asked all related fundraising activity to be halted immediately, issuing the strongest regulatory challenge so far to the burgeoning market for digital token sales.
The People’s Bank of China said on its website Monday that it had completed investigations into ICOs, and will strictly punish offerings in the future while penalizing legal violations in ones already completed. The regulator said that those who have already raised money must provide refunds, though it didn’t specify how the money would be paid back to investors.
It also said digital token financing and trading platforms are prohibited from doing conversions of coins with fiat currencies. Digital tokens can’t be used as currency on the market and banks are forbidden from offering services to initial coin offerings.
“This is somewhat in step with, maybe not to the same extent, what we’re starting to see in other jurisdictions — the short story is we all know regulations are coming,” said Jehan Chu, managing partner at Kenetic Capital Ltd. in Hong Kong, which invests in and advises on token sales. “China, due to its size and as one of the most speculative IPO markets, needed to take a firmer action.”
Bitcoin tumbled as much as 11.4 percent, the most since July, to $4,326.75. The ethereum cryptocurrency was down more than 16 percent Monday, according to data from Coindesk.

And apparently there’s more coming:
ICO crackdown may just be the start: China is reportedly planning tighter cryptocurrency rules
(CNBC) – China is poised to further tighten rules on virtual currencies after regulators on Monday banned virtual coin fundraising schemes, Chinese financial news outlet Yicai reported, citing sources.
China banned and deemed illegal the practice of raising funds through launches of token-based digital currencies, targeting so-called initial coin offerings (ICO) in a market that has exploded since the start of the year.
Yicai’s report late Monday cited a source close to decision-makers as saying the announcement on the ban was just the start of further follow-up regulations of virtual currencies.
The above raises two big questions. First, how will cryptocurrencies fare in a world of increasingly strict and complex regulations? Second, what kinds of assets stand to benefit if cryptocurrencies cease to function as “digital gold”?
The first question is a tough one, because it involves the interplay of governments, revolutionary tech and free markets, which means pretty much anything is possible. The second, though, is easier: If digital gold falters, real gold wins:
Mobius Foresees Cryptocurrency Crackdown Sparking a Rush to Gold
(Bloomberg) – Mark Mobius is sensing danger in the explosive growth of cryptocurrencies.
Governments will begin clamping down on digital currencies because of their use in illicit financing, with terrorist groups to drug dealers contributing to their rise, Mobius, executive chairman at Templeton Emerging Markets Group, said in an interview in Hong Kong Monday.
“Cryptocurrencies are beginning to get out of control and it’s going to attract the attention of governments around the world,” Mobius said. “You’re going to get a reversion back to gold because people are going to wonder, can I really trust these currencies?”
Mobius isn’t the only one voicing concern. Bank of America Merrill Lynch was cautious around bitcoin in July, saying there were a lot of obstacles, such as theft and hacking risks, that make it unlikely it will gain the status of pledgeable collateral.
“People need a means of exchange and they need to trust that,” said Mobius, who was interviewed before China’s announcement. “Right now the trust is good — with bitcoin people are buying and selling it, they think it’s a reasonable market — but there will come a day when government crackdowns come in and you begin to see the currency come down.”
The Death of the U.S. Dollar as the world’s reserve currency will have a profoundly negative impact on the lives of most Americans. Unfortunately, 99% of the population has no clue. The only reason 1% of U.S. citizens understand what is going on, is because the Mainstream media and financial networks have distorted the truth and the reality of our present situation.
What happened in the markets today was a perfect example. Zerohedge published an article today titled, ‘Traders’ Panic-Buy Stocks, Shrug Off Nuclear Armaggedon, Debt Ceiling, & Biblical Flood Fears, and stating the following:
For a few brief hours overnight – until the bell rang at 0930ET on the NYSE – investors were anxious about North Korea’s most provocative yet missile launch, the terrible flooding disaster in Texas, and lest we forget, the looming debt ceiling debacle. But all of that was instantly forgotten as the machines took control and lifted stocks higher practically all day on a sea of USDJPY-ignited momentum.

Looking at the chart above, we can see that when fear came into the markets during the North Korea missile incident and then the opening of the European markets (shown in the two red boxes), the Dow Jones Index fell as well as the USDJPY, while gold and the U.S. Treasurys increased.
However, after the U.S. markets opened, MAGICALLY everything reversed because the nuclear threat with N. Korea, Biblical flooding in Texas and the upcoming debt ceiling issue no longer mattered. Those of us in the Alternative Media find this quite hilarious that nothing negatively impacts the financial markets anymore. Some have laughed while saying, “If a nuclear bomb had taken out New York City, the stock market would probably go up.” While I doubt that would happen, it is becoming a real joke to watch the financial markets today.
I wrote about the insanity in the markets today and how it has negatively impacted the value of the precious metals in my recent article, The Reason Why Gold & Silver Have Frustrated Investors Since 2011. In the article I posted the chart below, by a Deutsche Bank analyst Aleksandar Kocic, on why the Markets Broke In 2012:

The description of the indicator above may be a bit difficult to understand so that I will simplify it. The BLUE LINE represents the “Economic Uncertainty Policy” (EPU index) shown by the frequency of articles in ten leading US newspapers that contain three of the target terms: economy, uncertainty; and one or more of Congress, deficit, Federal Reserve, legislation, regulation or White House in the mainstream media. The BLACK LINE is the VIX index, the volatility index (S&P 500). Economic uncertainty printed in articles in the Mainstream Media should correspond with the volatility indicator of the markets (the VIX).
And, this is what precisely took place from 1996 to 2011. The blue and black lines moved up and down in tandem. However, after 2011, something changed. According to Kocic:
Intuitively, when VIX is in tune with EPU, the market is acknowledging the levels of risk through the prices. However, when VIX is low and EPU high, markets are complacent – they are underpricing risk.
After 2011, the two measures of risk decouple with VIX consistently low despite growing uncertainty. The breakdown is structural, and it is visible across all market sectors, not only equities.
What Kocic is saying is that the market has become highly complacent and is severely underpricing risk.
This is exactly what happened today. Not only do we have a threat of a Nuclear incident with N. Korea, but Houston is dealing with epic flooding from 4-5 feet of rain, while the U.S. Government is about to hit a wall with the debt ceiling issue. Those three factors would have caused the markets to sell off considerably 5-10 years ago. Again, according to the chart above, it doesn’t seem to matter how much negative news there is in the economy, the markets have to continue higher or remain elevated, or else the entire house of cards comes down.
The U.S. Dollar As The World’s Reserve Currency Is Under Serious Pressure
According to Clive Maund’s article, DOLLAR update as LOSS OF RESERVE CURRENCY STATUS LOOMS... if the U.S. Dollar breaches its support level, then it could go into freefall:

While I don’t pay a lot of attention to technical analysis, many traders do. Clive Maund states in his article that the U.S. Dollar is due for a bounce because it is oversold. But, once the bounce is over, we could see the Dollar decline considerably as the U.S. Government has to deal with the debt ceiling issue.
When the U.S. Dollar is no longer the reserve currency of the world, Americans will be forced to live on a lot less. We won’t be able to exchange worthless U.S. Treasury paper for oil, metals, commodities, goods or services anymore. We will need to trade GOODS for GOODS, not PAPER for GOODS.
We still import 6-7 million barrels per oil per day to run our economy. We provide ious for a lot of that oil. Last year, the U.S. trade deficit was $502 billion. A portion of that trade deficit was for oil. Without the 6-7 million barrels per day of oil we import, our economy would shrink by one-third for starters.
The only way the U.S. economy can continue moving along is via the U.S. Dollar being the world’s reserve currency. When the U.S. Dollar is no longer the world’s reserve currency, it will be difficult to pay for oil with worthless U.S. Treasuries. Of course, the Fed and U.S. Treasury may speed up the printing press to make up for our ongoing trade deficits, but that would likely erode the value of the Dollar.
The Death of the U.S. Dollar will be the end of America as we know it. Unfortunately, a tiny percentage of those in the Alternative Media Community realize this, while 99% are completely oblivious.
Check back for new articles and updates at the SRSrocco Report.


-
I know Mike is a very solid investor and respect his opinions very much. So if he says pay attention to this or that - I will.
~ Dale G.
-
I've started managing my own investments so view Michael's site as a one-stop shop from which to get information and perspectives.
~ Dave E.
-
Michael offers easy reading, honest, common sense information that anyone can use in a practical manner.
~ der_al.
-
A sane voice in a scrambled investment world.
~ Ed R.
Inside Edge Pro Contributors

Greg Weldon

Josef Schachter

Tyler Bollhorn

Ryan Irvine

Paul Beattie

Martin Straith

Patrick Ceresna

Mark Leibovit

James Thorne

Victor Adair