Currency

Why Bitcoin Refuses to Die

nintchdbpict000306226097Editor’s Note: The mainstream media says cryptocurrencies like bitcoin are only a fad. But Teeka Tiwari, the editor over at The Palm Beach Letter, shows us why “cryptos” are unstoppable.


On June 20, 2011, Forbes wrote “So, That’s the End of Bitcoin Then.”

On January 16, 2015, USA Today wrote “Bitcoin Is Headed to the ‘Ash Heap.’”

On May 5, 2017, The Daily Reckoning wrote “The Death of Bitcoin.”

Since 2011, bitcoin’s been declared dead at least 135 times.

Newsletter writers, journalists, and academics have called it a “Ponzi scheme.”

Others like the idea in theory but have doubts. They are convinced the government will shut down bitcoin and render it worthless.

If it were 2013, I would have agreed with them.

From 2009–13, bitcoin rallied from a fraction of a penny to over $1,100… and then spectacularly crashed 85% to $185.

It looked like a classic “pump and dump” to me. That’s why I ignored it.

But then something very interesting happened.

Instead of collapsing back to pennies, bitcoin found support in the $200 range. Even after the bubble popped, bitcoin was still worth billions.

This intrigued me because true Ponzi schemes have zero value when they crash.

The fact that bitcoin was still attracting buyers even after the onslaught of negative news… an 85% price crash… and universal scorn… said something to me.

It said that maybe this asset had real value. At the very least, it told me that more investigation was needed.

Lessons From the Dot-Com Bubble

I’ve seen skepticism like this before…

Back in May 1997, Amazon went public at the split equivalent of $1.30.

Amazon shot up to $113 during the dot-com bubble of the 1990s. When the bubble popped, Amazon crashed 94%—to the split equivalent of $5.97.

But again, something interesting happened…

In the depths of the dot-com hatred, Amazon started quietly climbing in price. Back then, I made the mistake of dismissing this action.

My error was buying into the prevailing belief that dot-com stocks were dumb and worthless.

I listened to the narrative instead of digging deeper into the Amazon story.

That was a mistake of lazy thinking.

So when I saw the same thing happen with bitcoin, I decided to do something different.

Instead of listening to the skeptics, I asked myself: “Why are people still buying this supposedly worthless asset?”

That’s when I did a deep dive into bitcoin.

I traveled all over the world interviewing experts, development teams, and venture capitalists. I wanted to understand why bitcoin had value.

Even Governments Are Embracing Bitcoin

Just as important, I wanted to know what would stop the U.S. government from banning it.

How would the currency outgrow its widespread reputation as a form of “black money” used by criminals?

What I found out was this: At its core, bitcoin is just a way to send and receive value without the need for a trusted middleman.

Bitcoin has no central location. That means no government (including the U.S. government) can ever shut it down.

In fact, several countries have already tried to ban bitcoin and found that it was impossible.

At least two of them (Russia and India) have decided to recognize bitcoin as money.

Governments are realizing that it’s better to have a hand in how bitcoin is shaped and regulated than try to destroy it (which they can’t).

Think back to when the U.S. government finally realized that prohibition was unenforceable. Better to regulate alcohol and tax it.

Where’s the Future Value?

The real strength of bitcoin is the underlying network of highly secure computers that support it (called the blockchain).

This is where much of the value creation will come from.

As I write, software developers across the world are building applications designed to piggyback off this network.

Over the next three years, we’ll begin to see a slew of new applications emerge for bitcoin and the network that supports it.

They will support everything from asset tracking to recording land registries.

And much more that we can’t even think of yet.

That’s why bitcoin will continue to grow in value.

Since those obituaries started popping up in 2011, bitcoin has rocketed from a low of 75 cents to as high as $3,030—an astronomical 404,000% gain.

The next time you find yourself being scared out of owning bitcoin by a negative article, do yourself a favor… Read the last 135 times bitcoin was declared dead.

Regards,

Teeka Tiwari
Editor, The Palm Beach Letter

Elliott Wave Analysis: USD Index Trading In Final Stages

On the 4h chart of USD Index price recently rallied in three waves; it was a clear contra-trend price structure within wave 4. We labeled end of wave 4 near 97.77 level after that sharp leg down which is now pointing to around 96.50/96.20 for wave 5 where bigger decline may come to an end in June. That being said, a five wave rally and a breach above the 97.77 level may signal bullish activity to follow.

USD Index, 4H

44471

Ed Note: The US Dollar index hit a low of 96.44 this Tuesday at 11am, and is currently trading up from there as you can see it taking in initial surge to the upside at 3am Wednesday morning. You can see it testing that surge on the 15 minute chart below:

Screen Shot 2017-06-07 at 6.53.30 AM

Click Chart For Larger Image 

Angela! Seriously? You want to go your own way?

Quotable 

“Our world cannot be understood by looking at people behaving within the system because of emergent phenomena.  Our markets display decisions that are not in the ergodic world of a gambler at the roulette table because our environment shifts with every interaction and experience—and particularly during crises, which is where it is most critical we find a way to predict or at least understand.  When we come to comprehend these limits, we approach a world filled with the giant unknown unknows: radical uncertainty.”

–Richard Bookstaber, The End of Theory

Commentary & Analysis

Angela!  Seriously? You want to go your own way

1496338160673

Not satisfied with her maniacal immigration policy, which threatens the very existence of hard fought western cultural norms across Europe, German Chancellor Angela is now complaining about the US not being a viable partner for Germany or Europe. It’s doubtful she vetted these comments with her German industrialist buddies.  Why do I say that?  It’s because Germany has piggybacked on the US capital and trade regime (and NATO defense shield) to unprecedented proportion for the last fifty years….

…..read more HERE


RIPPLE Crypto-Currency Up 20% Today….. It’s The Wild West Out There

Rippl-Chart-5-31-17

After the crypto-currency, Ripple, fell 12% yesterday, it surged over 20% in trading today.  Folks, it’s the Wild West out there in crypto-currency land.  I have been spending some time looking into these crypto-currencies because there seems to be a great deal of mystery behind them.  And I like looking into and solving mysteries.

Of course, the rapid increase in price has sparked some interest, but very few realize just how much energy and capital it takes to produce one Bitcoin today.  Actually, I was quite surprised.

I want my readers to know that I will be doing some research and writing some articles and Reports on these crypto-currencies (along with Gold & Silver) as I believe we are going to be seeing a lot more about them as well as rising interest in the markets going forward.

That being said, there is a lot of misinformation being spread around the alternative media about these cyrpto-currencies.


First…. these crypto-currencies are much different than gold and silver.  I know that.  I don’t need any of my readers to leave a comment making sure I know that.  LOL… I do.

Second… there is a lot of mystery behind these crypto-currencies in which the public has no clue.   So, I see a lot of opinions being made (negative & positive) due to a lack of knowledge or prejudice.

Third…. there is a good chance that these crypto-currencies will continue to gain more interest and market trading as time goes by.  However, it is the WILD WEST out there and a lot of people are likely going to lose a lot of money trading or investing in these crypto-currencies because they have no idea of what the living hades they are doing.

Lastly…. my interest in learning more about these crypto-currencies is to understand how they are functioning in the market and as a psuedo store of “Electronic Economic Value”, if there is such a thing.  Again, Bitcoin mining and transactions are consuming one hell of a lot of electricity.  We are talking TeraWatts.

Thus, Bitcoin mining is consuming an ever-increasing amount of electricity.  Thus, the cost to produce Bitcoin will continue to increase going forward… as it has in the past.  Whether that means a Bitcoin does hold some value, is another thing entirely… but again, I had no idea of the massive amount of electricity and capital expenditures it takes just to produce one Bitcoin.

I will be doing more research on this subject and how it pertains to Gold & Silver going forward.

Check back for new articles and updates at the SRSrocco Report.

The Dollar’s Last Stand.

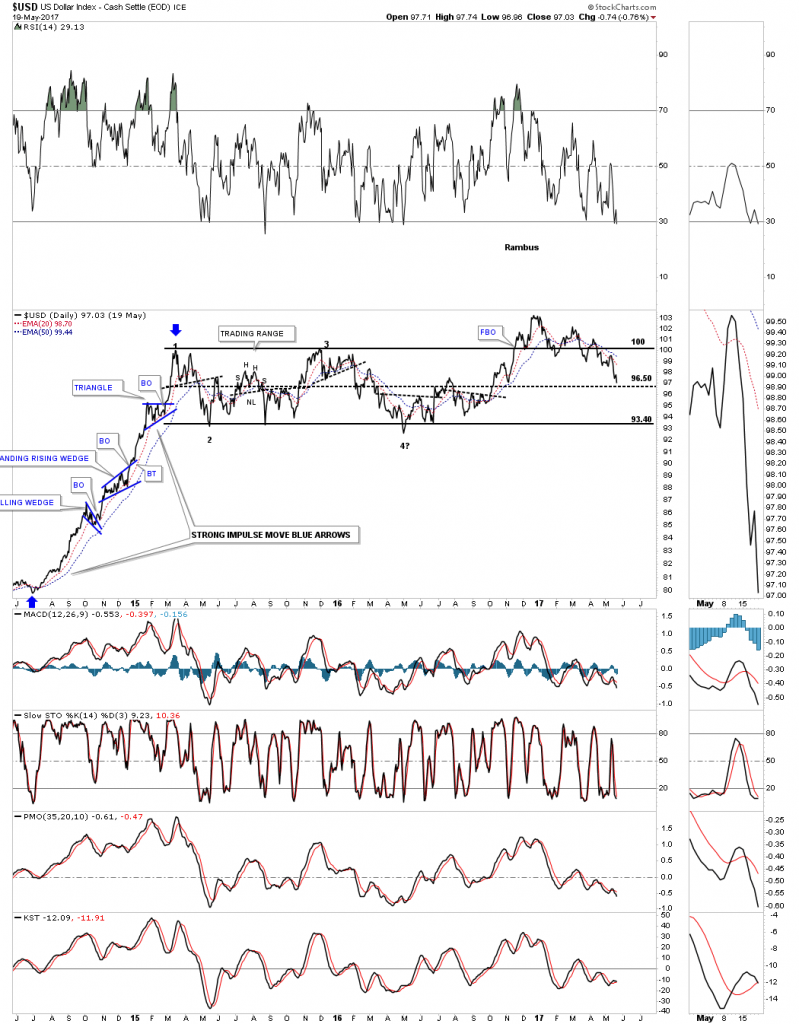
There is no doubt that the US dollar looks bad right now after breaking below the bottom rail of its 5 point falling wedge last week. Before I give up totally on the US dollar there is one thing I’m going to look for first. When all else fails I like to go back to the initial pattern which was a sideways trading range or a rectangle pattern. I’ve seen in the past that when you have a nice tight rectangle with a breakout above the top rail, there can be one very big shakeout move where the price action will decline back to the center mid dashed line, where final support may reside. If the dashed mid line fails to hold support then there are bigger problems. Below is a weekly chart for the US dollar which shows the price action testing the mid dashed center line.

usd-weekly-mid

The $US dollar daily line chart.


The daily chart below shows a potential downtrend channel with 2 blue consolidation patterns. If the blue bearish falling wedge is a halfway pattern to the downside the blue arrows shows a price objective down to the 96.20 area, which is labeled impulse move. The breakout to breakout price objective is a littler lower at 95.45. Those 2 price objectives come in pretty close to the mid dashed center line on the rectangle pattern above.

This weekly chart shows how the downtrend channel fits into the bigger horizontal trading range, which is now testing the dashed mid line. A break below the dashed mid line will most likely lead to a move down to the bottom of the rectangle.

usd-weekly-1


The million dollar question remains, is the 2 year trading range a top or a consolidation pattern to the upside?


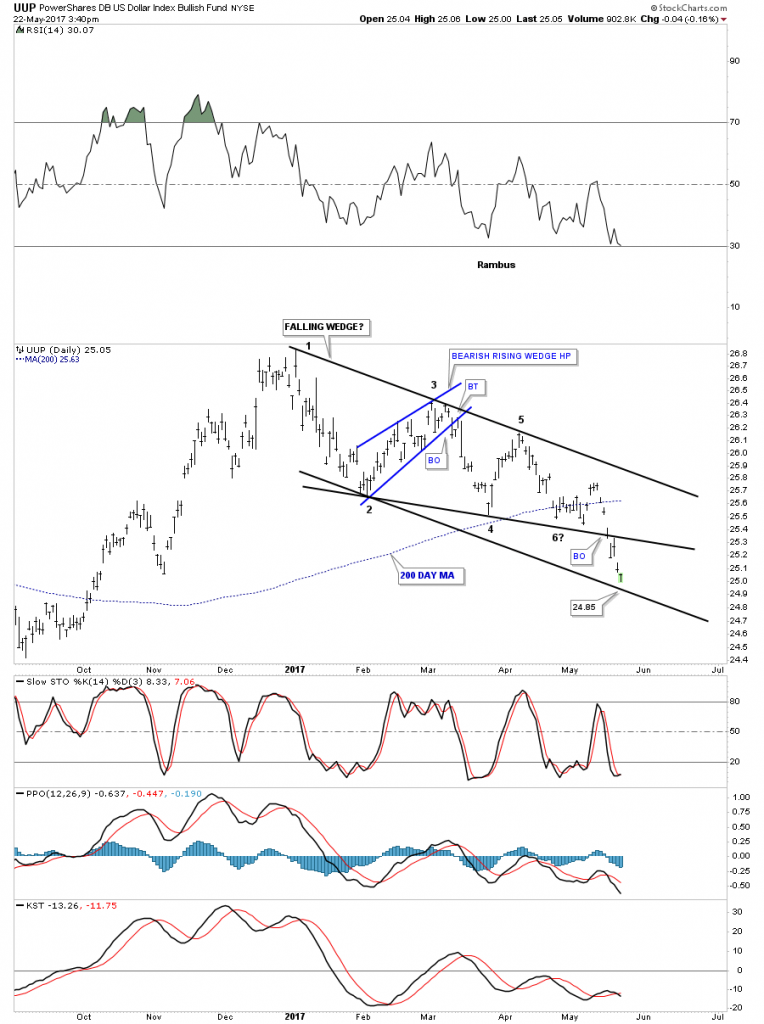
Below is a daily chart for the UUP which shows the original 5 point bearish falling wedge. I added a parallel bottom rail to the top rail which shows a possible bull flag if the bottom rail at the 24.85 area holds support.


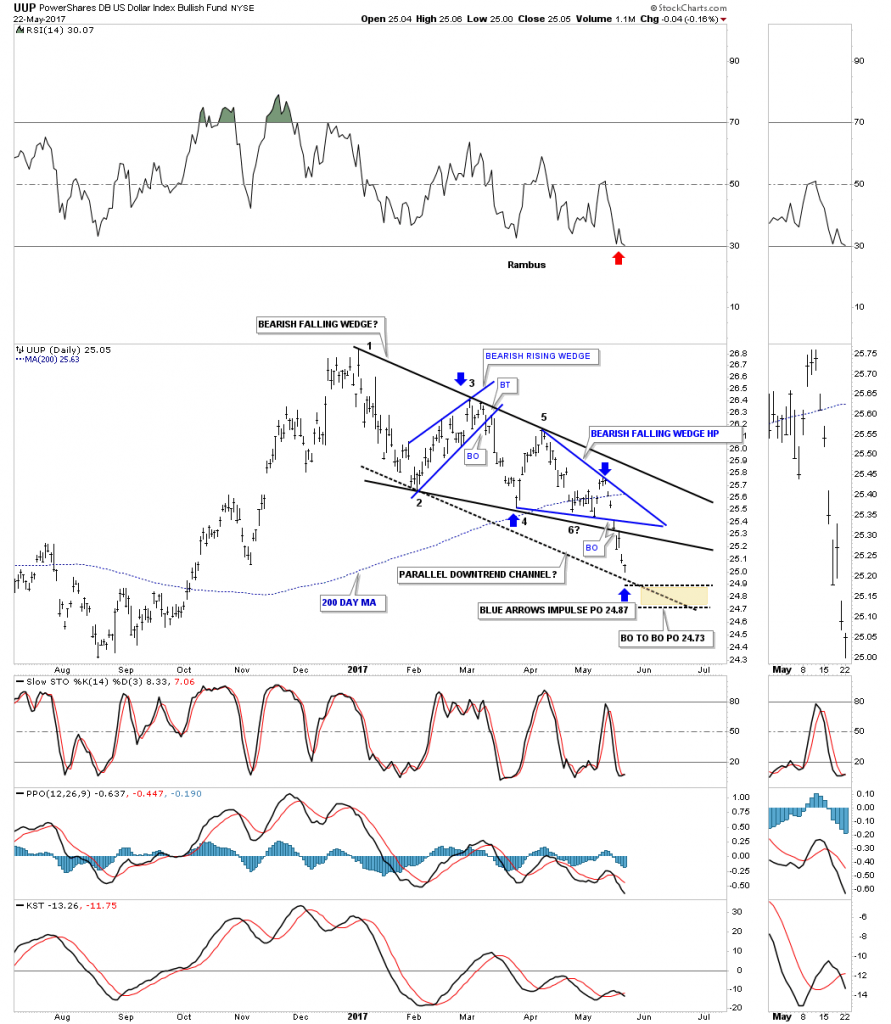
This next chart for the UUP is the same chart as the one above, but this one shows the 2 smaller blue consolidation patterns that make up the downtrend channel up to this point.. If the lower blue bearish falling wedge is a halfway pattern between the blue bearish rising wedge, the blue arrows show a price objective down to the 24.87 area. Likewise, if the blue bearish falling wedge is a halfway pattern the BO to BO price objective is down to the 24.73 area.


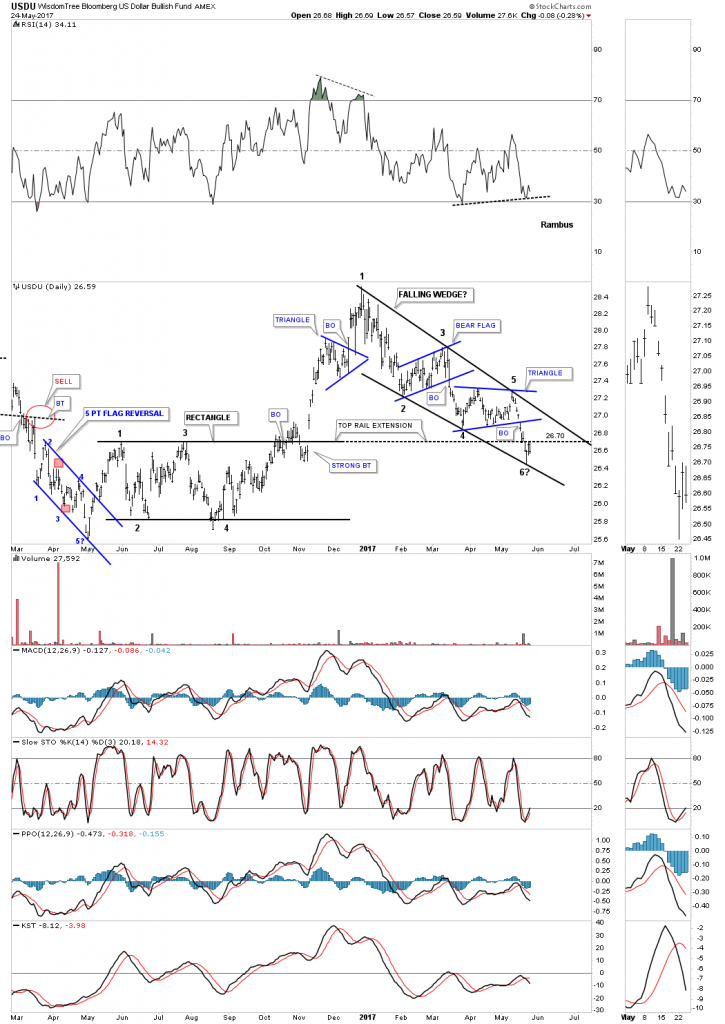
This next chart is a daily look at the USDU, Dollar Index, which has a more balanced makeup of currencies. Monday the price action hit the bottom rail of the falling wedge completing the 5th reversal point. If the falling wedge is going to be a bullish falling wedge, the USDU will have to start rallying and breakout above the top rail. Note the 4 point rectangle consolidation pattern that formed on the left side of the chart. From a Chartology perspective the top rail area should hold support when backtested from above, as shown by the top rail extension line which is now being strongly backtested.


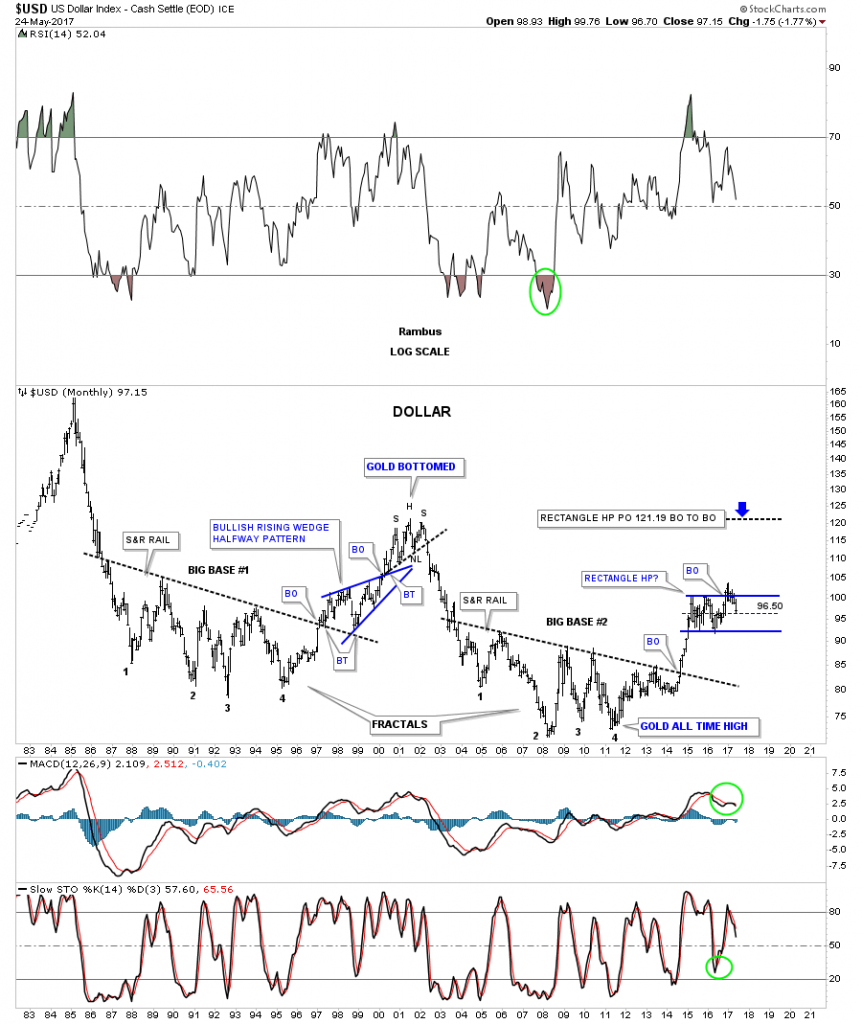
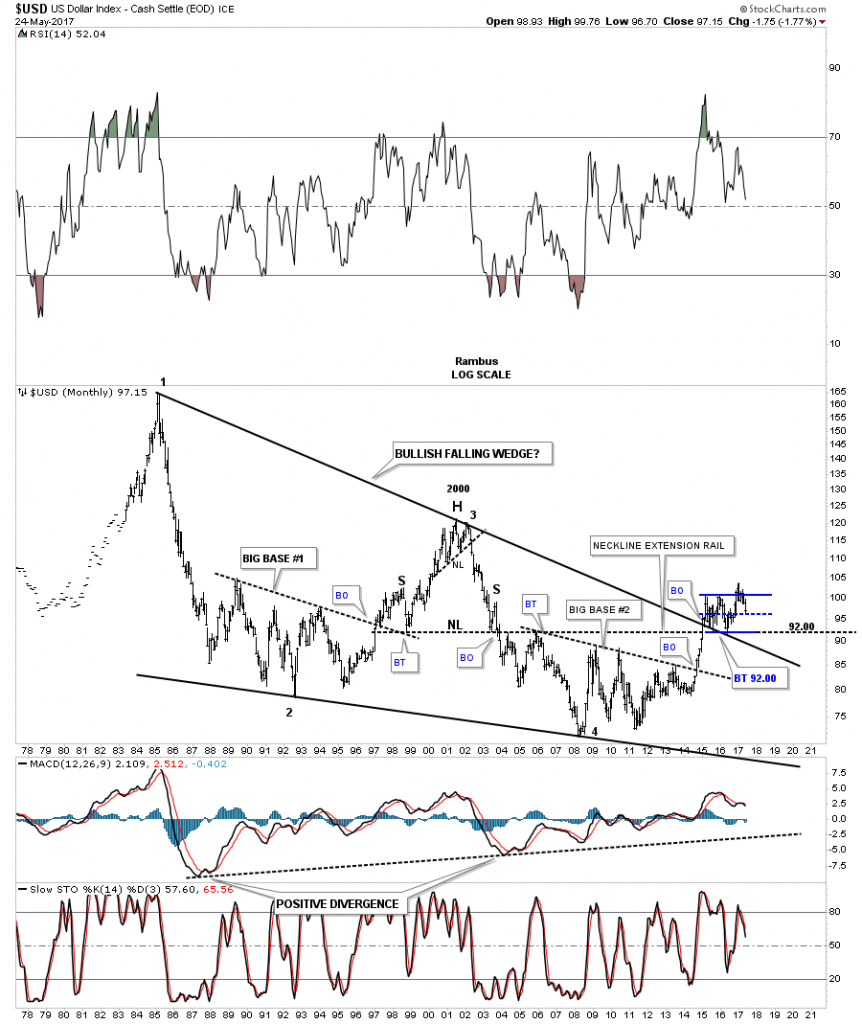
It’s been awhile since we last looked at this 40 year chart for the US dollar that shows a massive falling wedge with a breakout and 2 backtests to the top rail at 92 which is also the neckline extension line taken from the 2000 H&S top. From the 2011 low there still is a series of higher highs and higher lows in place. A break below 92 would change that.


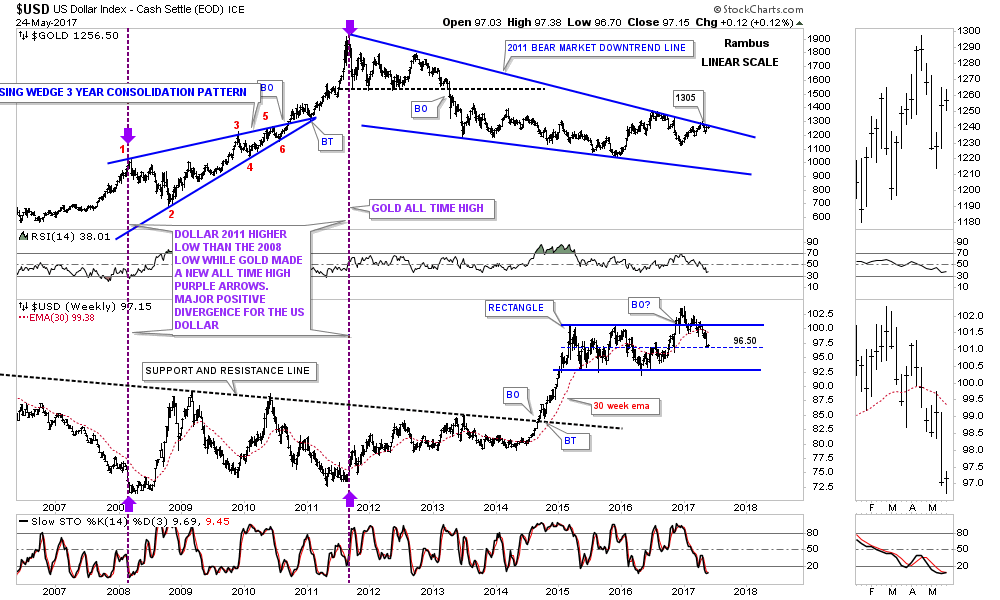
Below is a combo chart which has gold on top and the US dollar on the bottom. Six weeks ago gold hit the top rail at the 1300 area and backed off telling us that the top rail is hot. If the US dollar on the bottom chart can’t hold the 96 area, then there is a very good chance that gold will breakout above the top rail, possibly signaling the bear market is over. To say the 1300 area on gold is important is an understatement.


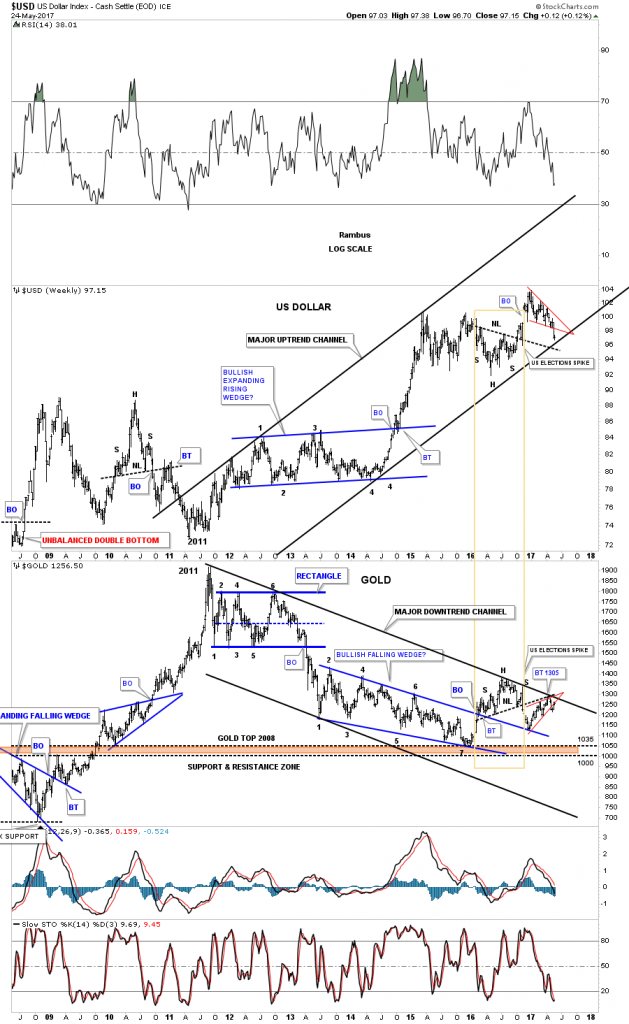
This next chart is another combo chart which has the US dollar on top and gold on the bottom which shows the inverse correlation these two generally have. The last time we looked at this chart the US dollar was still trading inside the red falling wedge and gold was still trading inside the red rising wedge. The only change I made was on the US dollar chart where I made the bottom rail of its uptrend channel parallel to the top rail. Gold was already in a parallel downtrend channel.


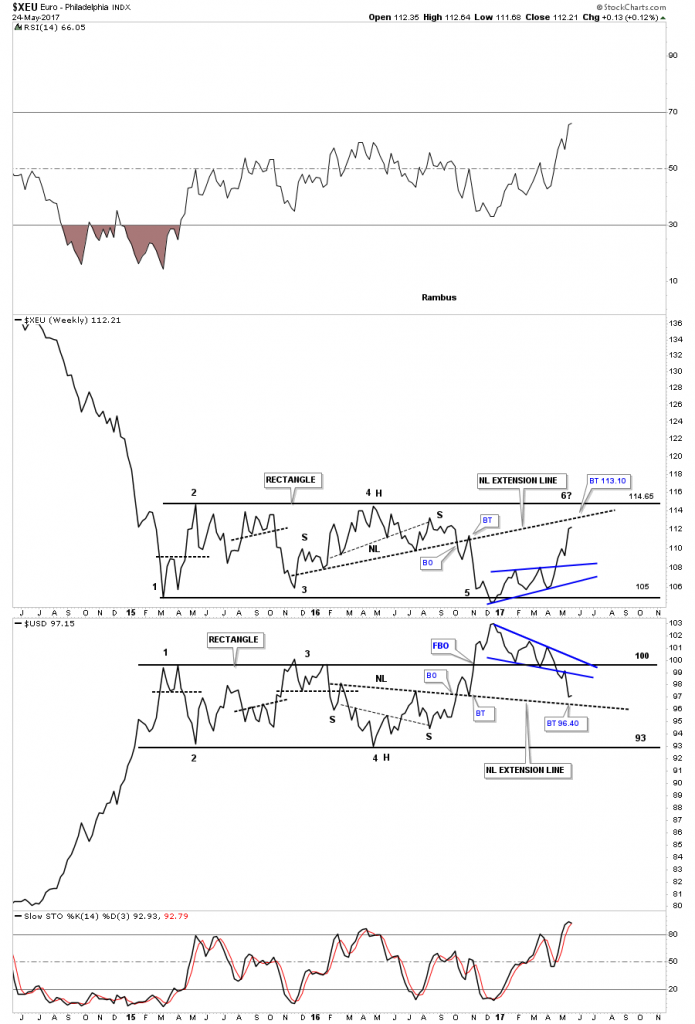
Below is a weekly line combo chart which has the $XEU on top and the US dollar on the bottom. As you can see the XEU on top is showing the blue bullish rising wedge while the US dollar is showing the blue bearish falling wedge. I’ve extended the necklines from the previous H&S patterns, labeled neckline extension line, which can be a place to look for a reversal to occur. The backtest to the neckline extension line on the XEU would come in around the 113.10 area while the neckline extension line on the US dollar would come in around the 96.40 area. Again, the million dollar question remains, is the XEU building out a consolidation pattern to the downside, and is the US dollar building out a consolidation pattern to the upside? Whichever direction these 2 year trading ranges breakout will have a big impact on many markets.


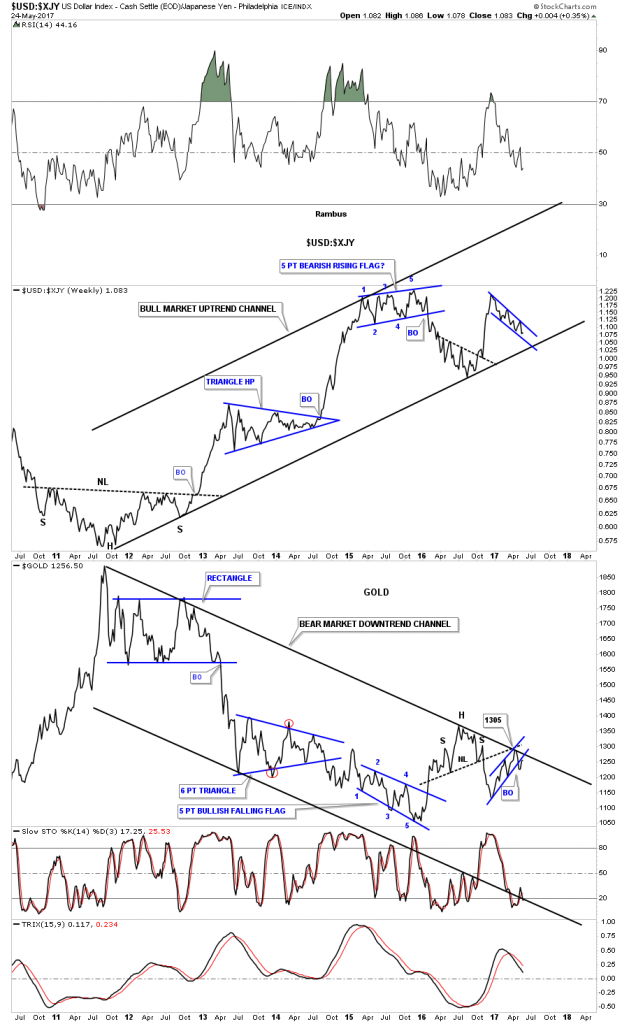
This last chart for tonight is a ratio combo chart which has the US dollar to the XJY on top, and gold on the bottom. Keep in mind we’ve been following these major trend channels since late last year before gold hit its top rail at 1305 and declined, so up to this point they have been following the script to a tee. The big question is, will they continue to follow the script to a tee? As you can see the ratio chart on top is building out a blue falling wedge while gold has built out a blue rising wedge.

It’s not everyday that you find charts like this at a very critical juncture which can change the major trend in a big way. Up to this point nothing is broken yet in regards to the big picture, but that could change in a heartbeat.

The Dollar is now at the currency equivalent of The Little Big Horn. Stay tuned.

All the best…Rambus

https://rambus1.com/wp-content/uploads/2017/05/usd-xjy-184×300.png 184w, https://rambus1.com/wp-content/uploads/2017/05/usd-xjy-768×1250.png 768w, https://rambus1.com/wp-content/uploads/2017/05/usd-xjy.png 900w” sizes=”(max-width: 584px) 100vw, 584px”>