
Currency
Victor on some data that just came out about the Canadian Dollar that shows massive negative sentiment on the Canadian Dollar.
….alsoL Featured Guest Tyler Bollhorn on Interpreting What the Market is Telling Us

Summary
Shares of the Grayscale Bitcoin Trust traded at an 80% premium at one point this week.
The GBTC is still the only brokerage-tradable asset to transact Bitcoin, putting it in demand.
The price of BTC has also soared this past week.
Don’t buy one BTC for the cost of two BTC. Here’s how to avoid this premium and get exposure to BTC.
The bitcoin craze has really picked up steam over the last couple of weeks. The price of the digital currency has skyrocketed from previous all-time highs around $1,300 to an additional almost 40% on top of that, trading over $1,700 at several points this past week and over $1,800 this morning.
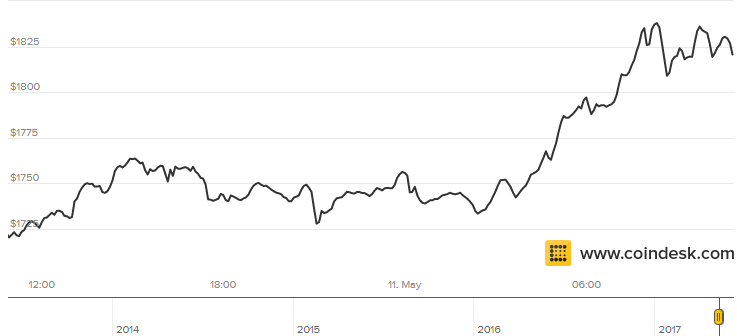
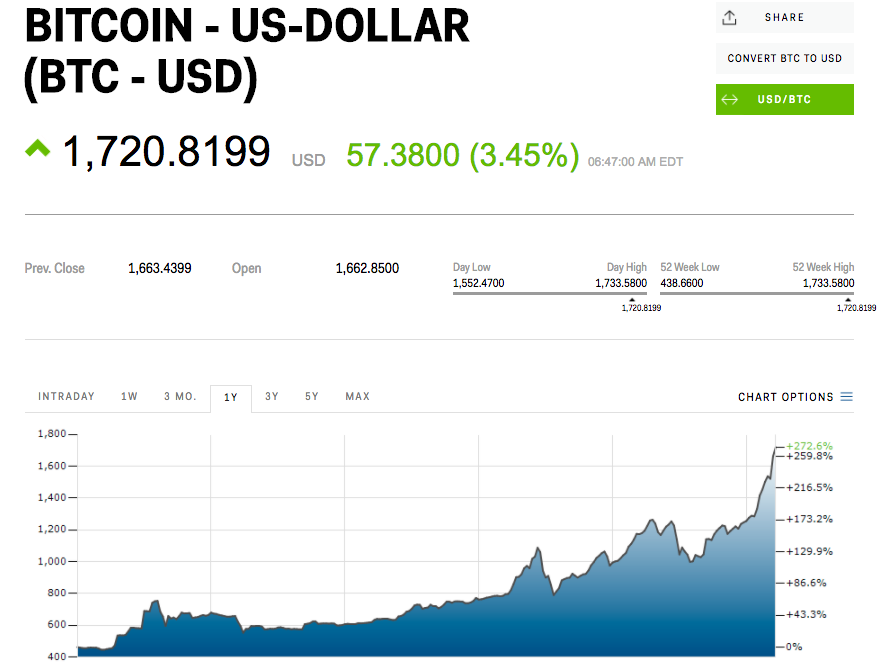
Bitcoin seems unstoppable, topping $1,700 for the first time on Tuesday.
The cryptocurrency trades up 3.45% at $1,720.82 a coin, as trade grinds higher for the 16th time in 18 sessions. It has gained nearly 50% during its run.
Tuesday’s gain comes without any obvious catalyst as traders await the US Securities and Exchange Commission’s ruling on whether it will reverse its decision to reject the Winklevoss twins’ exchange-traded fund.
The SEC rejected two bitcoin ETFs back in March, saying it “is disapproving this proposed rule change because it does not find the proposal to be consistent with Section 6(b)(5) of the Exchange Act, which requires, among other things, that the rules of a national securities exchange be designed to prevent fraudulent and manipulative acts and practices and to protect investors and the public interest.”
Bitcoin recently has shrugged off China restricting trade, the SEC’s rejecting of the two bitcoin ETFs, and threats from developers to create a “hard fork” that would split the cryptocurrency in two.
…also from Business Insider:
JAMIE DIMON: There is a ‘national catastrophe’ and ‘we should be ringing the alarm bells’
The USD Index has been declining in the past several weeks (and in general in 2017). The question is if this weakness changed anything regarding USD’s long-term uptrend?
Let’s take a look at the charts (chart courtesy of http://stockcharts.com).
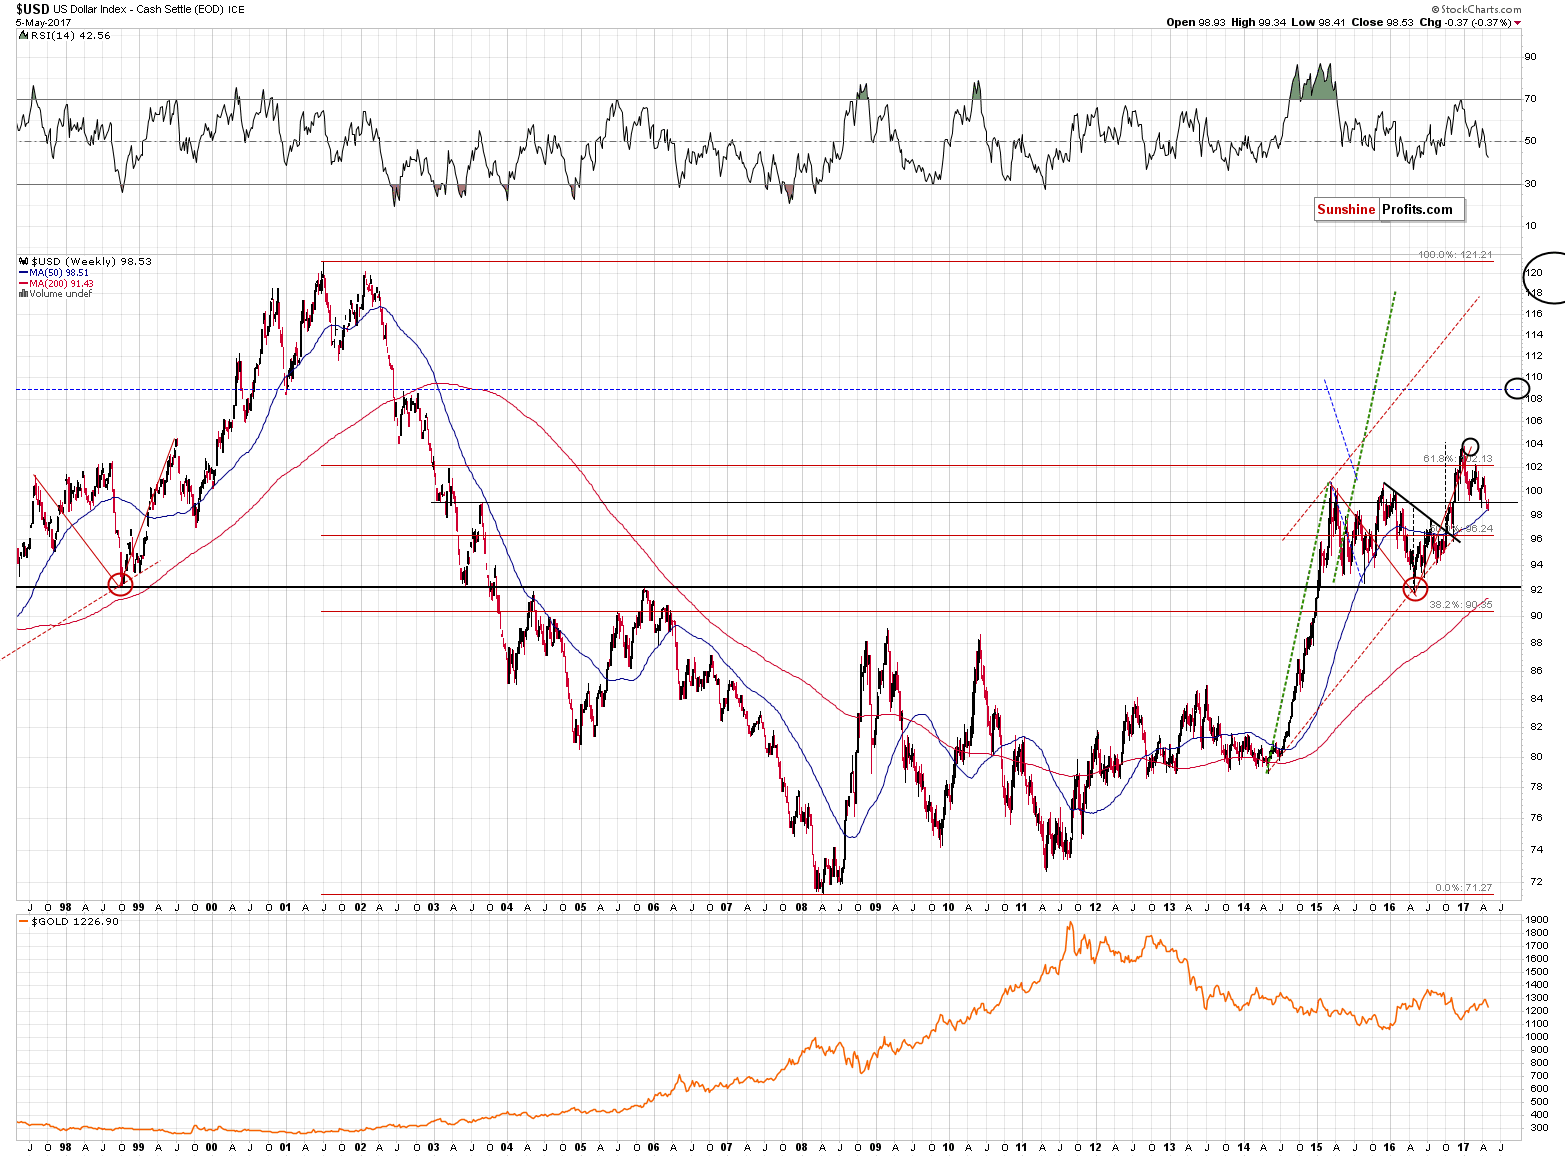
We don’t think so. Another very important long-term support level was reached last week (the 50-week moving average), which stopped the declines 3 times in 2015 and served as support and resistance on other occasions.
Besides, the French elections and (low, but still) uncertainty are factors that heavily impact the EUR/USD exchange rate at this time in a more or less random way. Therefore, any technical developments such as breakouts or breakdowns should not be viewed as important and binding until a reliable confirmation is seen. For now, the analogy to the 2002 – 2003 decline remains intact.
We had discussed the above-mentioned analogy several months ago in our Gold Trading Alerts, but if you haven’t had the chance to read it, the following quote should make things clearer:
The (…) self-similar pattern that we can see above is the mirror nature of the 2009 – now bull market and the pre-2009 bear market. The move below 100 in 2003 was corrected only once and in a rather sharp way. After the correction, the decline resumed and continued until the level of 92 was reached. The pre-correction (which was about 4 index points – just like the current one at this time) decline in the USD Index started a bit above 108.
Back in 2016, the USD Index rallied from about 92 to about 104 and corrected about 4 index points in a rather sharp (from the long-term point of view) manner. If the history rhymes and the “reflection” continues, the USD Index is about to quickly rally to the 108 level or slightly higher (adding the size of the 2015 – 2016 correction to the 2015 highs provides us with 110 as the target).
What are the implications of the above? Naturally, they are bearish for gold and the rest of the precious metals sectors and there are 2 direct reasons for it:
- The potential size of the rally in the USD (and thus the potential size of the decline in gold) is huge.
- The corrective downswing is very similar to the 2003 correction, which suggests that it’s either over (which would be in tune with the below seasonal USD chart) or extremely close to being over.
Even if we didn’t pay attention to the reflective nature of the USD Index, its medium-term outlook would still be bullish.
The key fundamental reason is the situation in interest rates – they are moving higher in the U.S., while the rest of the world (here: the key currencies in the USD Index: the euro and the yen) is still in favor of dovish monetary policy and it doesn’t seem likely that this is going to change anytime soon. The key technical fact is the USD’s breakout above the 2015 highs and the verification thereof (even though USD is now a bit below them).
What about the short-term indications?
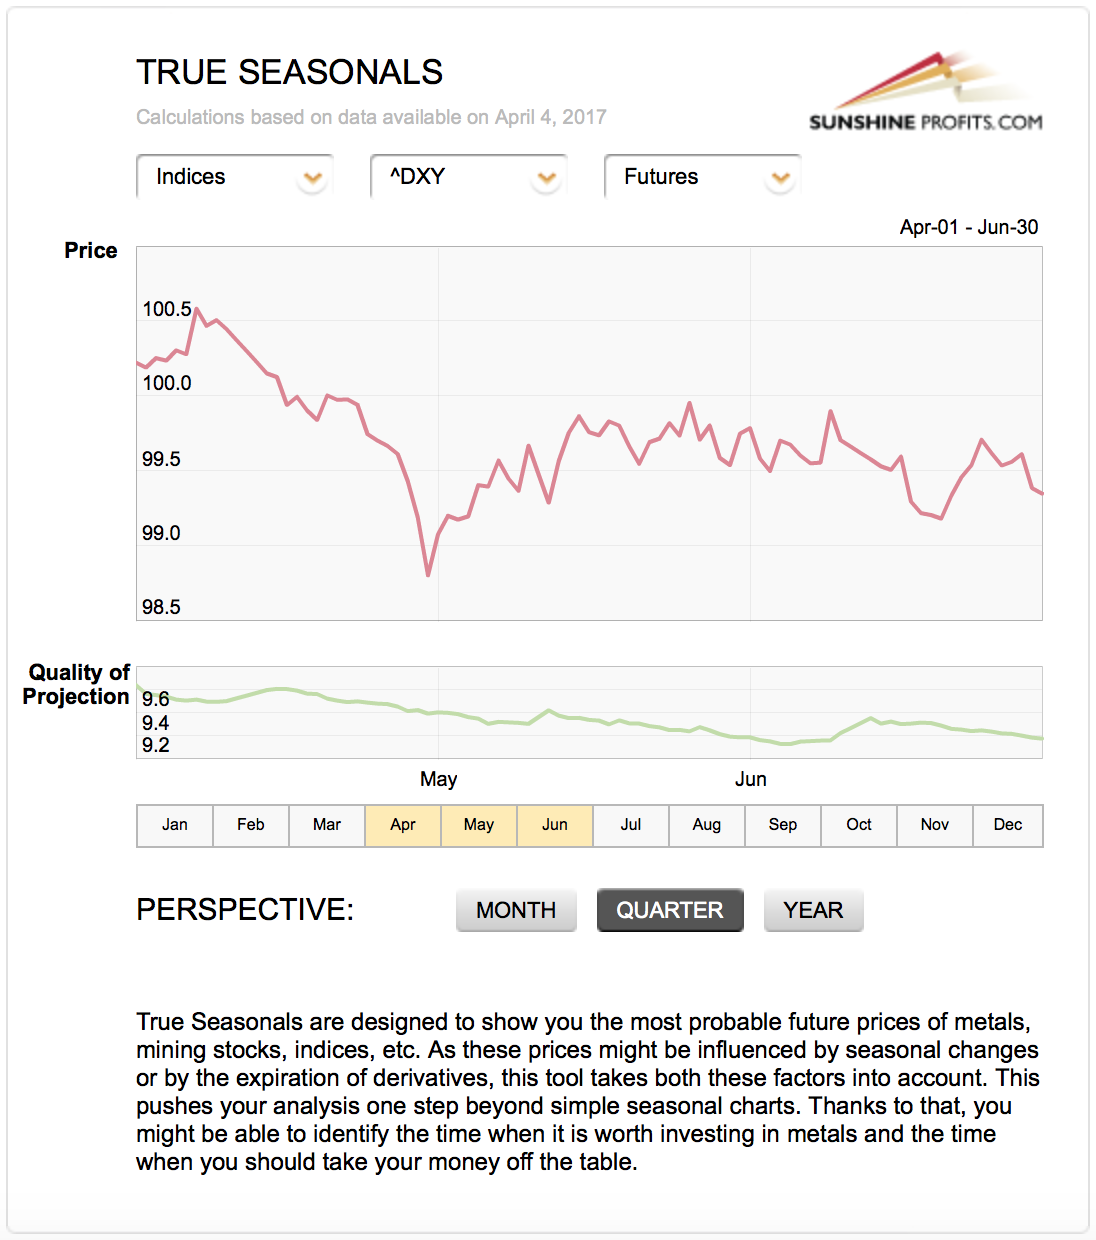
The True Seasonal tendencies for the USD Index heavily favor a bottom in late April / early May. As the uncertainty regarding the French elections likely peaked right before them, the bottom may have already formed and higher prices are likely to follow in tune with seasonal patterns. The implications are bullish for the USD Index and bearish for the precious metals sector.
What about gold?
The medium-term trends in gold are reflected by the medium-term trends in the USD Index and that’s been the case for many years. Naturally, there are deviations from this rule, but generally, it has to be the case simply because gold is priced in the US dollar. Consequently, it is very important for precious metals investors and traders to monitor the USD Index as signs of bottoms likely indicate lower prices for PMs in the following weeks.
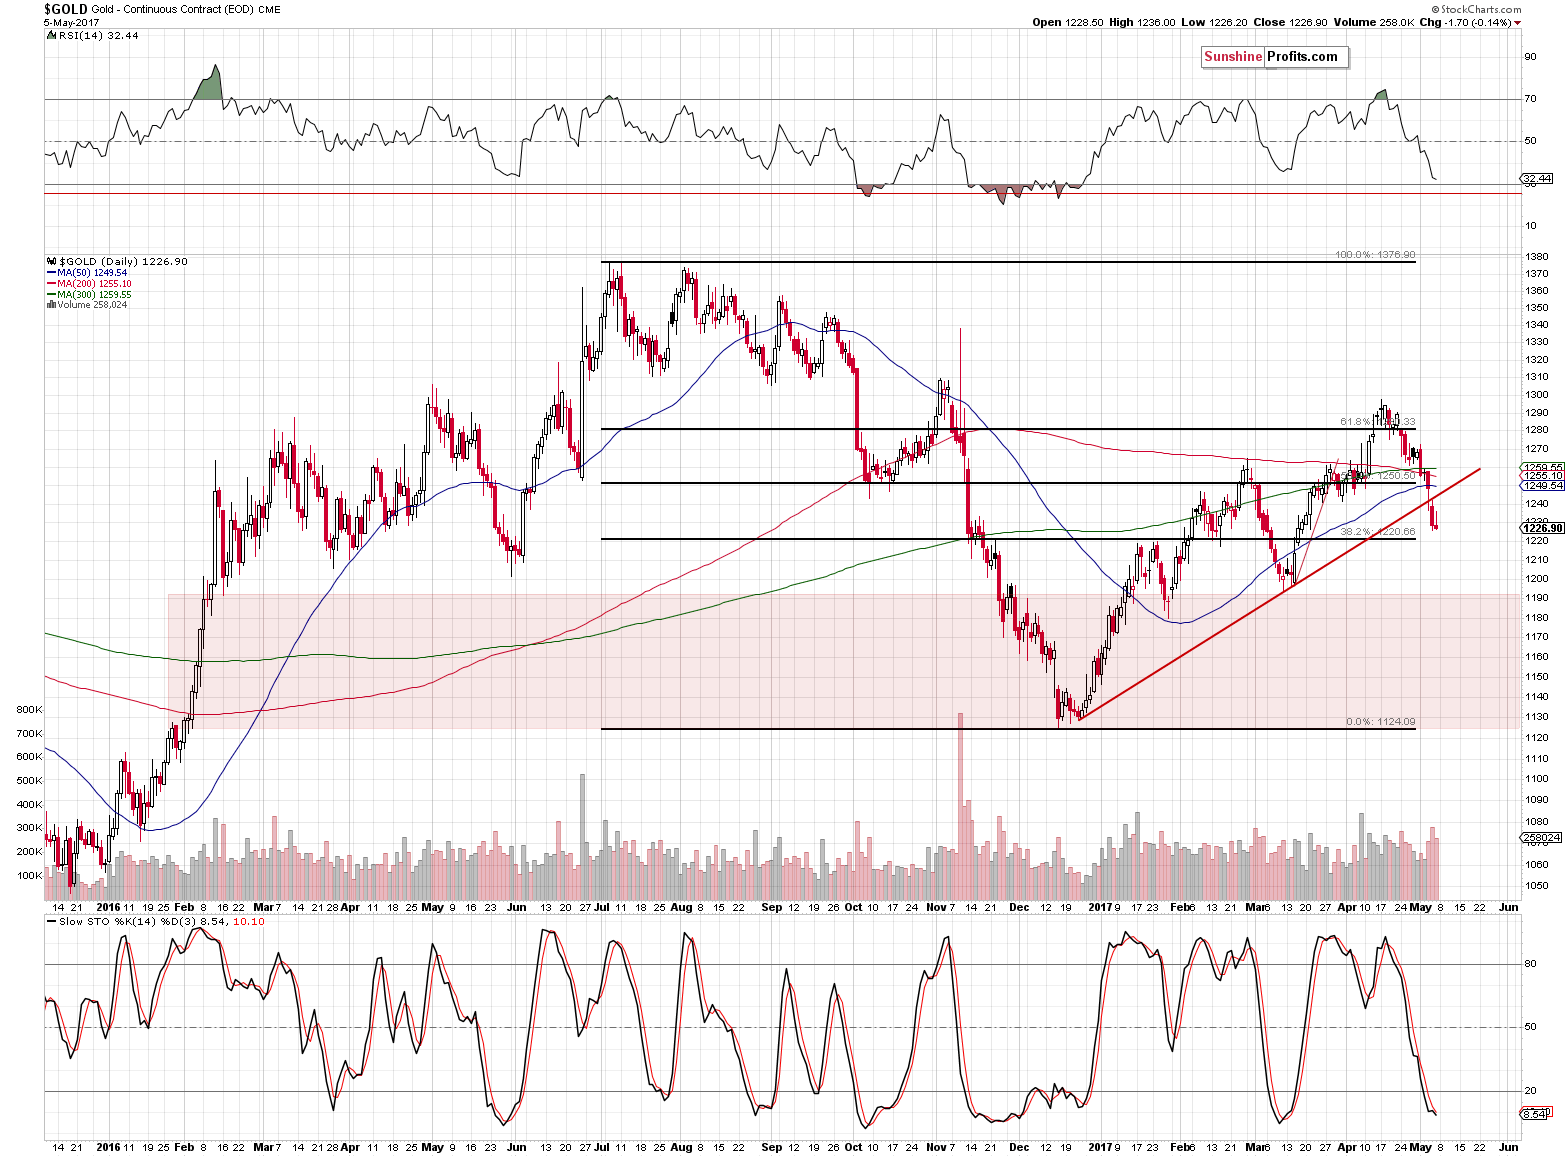
In our Friday’s alert, we wrote the following:
First of all, saying that gold was the last to break below its support line is another way of saying that it didn’t initiate a breakdown in the precious metals sector – it confirmed it. The initial breakdown took place in silver and mining stocks and since now the entire trio: gold, silver and miners are after a breakdown, the implications are most bearish.
Now, some may say that the breakdown in gold is not yet confirmed and thus that it really doesn’t count. There is some truth to it, however, since gold was the last to break lower, the implications are somewhat bearish anyway, and – most importantly – the breakdown was actually verified, in a way. The confirmation (which is necessary to determine if a move is accidental / triggered artificially or a real one that truly represents market participants’ views) can come from several things – 3 consecutive closes below a certain level, big size of the move, big size of the volume and – at times – from a weekly close below a certain level. The week is not over yet, but the move in gold was accompanied by big volume, so it was already somewhat confirmed. If gold closes today’s session (and, at the same time, the whole week) below the rising red support line ($1,242), the breakdown will be completely confirmed in our view.
Gold indeed managed to close the week below the rising support line, which indicates that lower prices of the yellow metal are to be expected. Naturally, the bearish implications extend to the rest of the precious metals sector as well.
Summing up, the outlook for the USD Index remains bullish and the implications are bearish for the precious metals market. Naturally, the above could change in the coming days and we’ll keep our subscribers informed, but that’s what appears likely based on the data that we have right now. If you enjoyed reading our analysis, we encourage you to subscribe to our daily Gold & Silver Trading Alerts.
Thank you.
Sincerely,
Przemyslaw Radomski, CFA

Quotable
“He who establishes his argument by noise and command shows that his reason is weak.”
–Michel de Montaigne
Commentary & Analysis
Will Aussie follow Cad’s path – down against the dollar? I don’t know, but willing to bet…
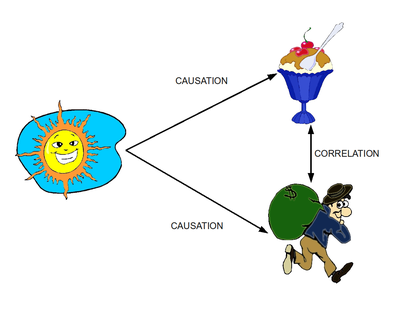
My editor’s note is this: I realize correlation isn’t causation. I realize correlations can change at any moment because every moment in the market is unique. I realize it isn’t always easy to determine which variable leads and which follows in a seeming correlation; it may be neither as both may be driven by some other narrative/variable/rationale, etc. But sometimesdivergences in prior correlations which have stood for a while can represent nice setups for a winning trade.
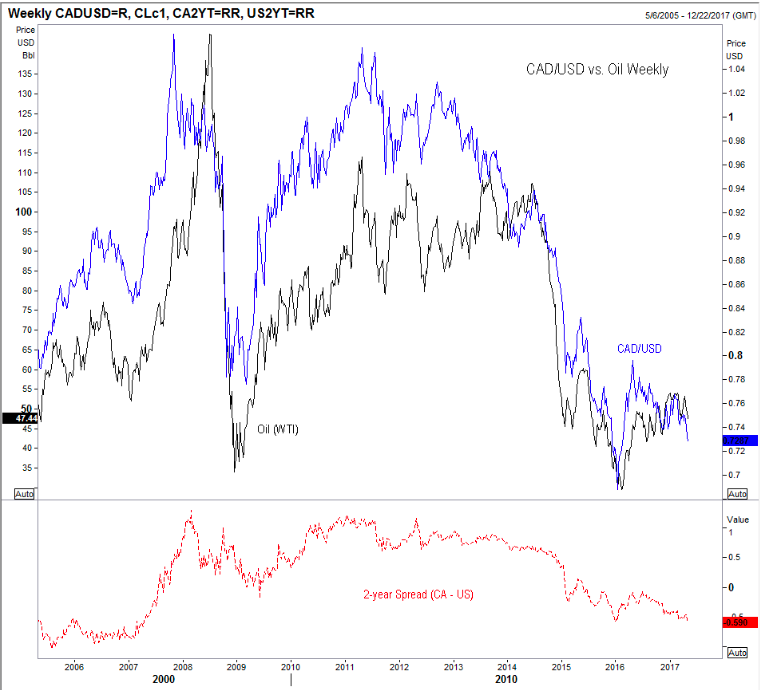
A divergence setup between CAD and Aussie may be in play.
On the next chart, we have overlaid CAD/USD (red line) on our Australian dollar weekly Wave chart; and have included the 2-yr yield spread AU-US in the bottom pane:
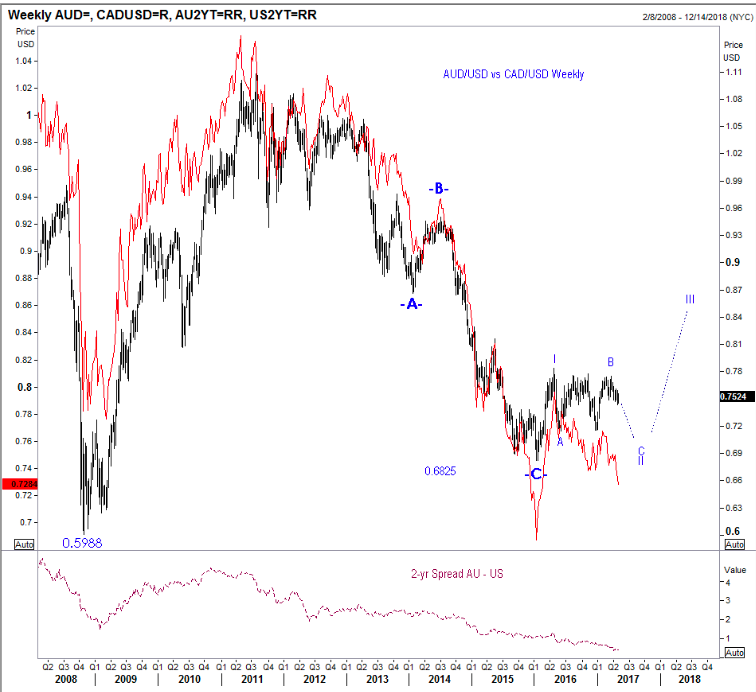
Note the relative weakness in CAD versus Aussie as compared to the US dollar. That is a divergence. It’s the same story on the yield spread; Aussie’s once dominate 2-year spread over the US has fallen from a high of around 4.6% when the Aussie peaked (1.1089) back on 8/12/2011 to 0.41 today. If the Fed meets current expectations, this spread will likely go negative in 2017.
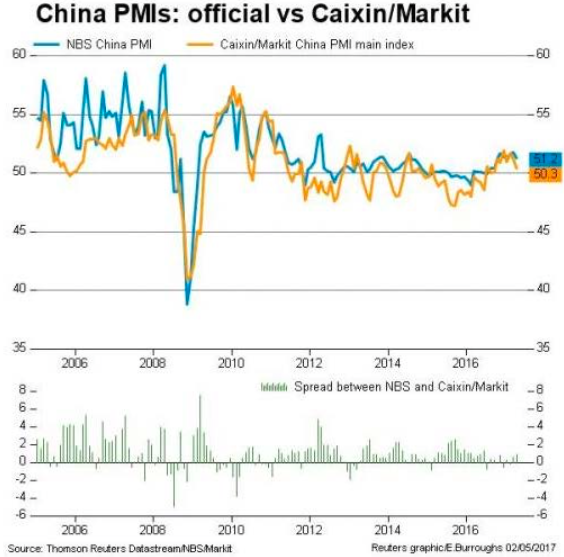
I say the same story because it seems the US Fed will be moving sooner than the Reserve Bank of Australia. And maybe today’s Chinese PMI news adds more validity to that expectation…
China’s April Purchasing Managers Index (PMI) was weaker than expected in April…if you compare the China PMI chart below to the AUD/USD weekly chart above, I think you will see a positive correlation there too.
We used this type of analysis to position for a decline in the Canadian dollar, establishing a put postion in our Currency Options Strategist service back on April 12th. So far so good. Our subscribers have pulled off half postiion gains on those puts for a133% profit and are still sitting on a 1⁄2 position now showing open gains of 167%. And yes. Our subscribers have added Australian dollar puts, just yesterday, hoping Aussie follows the path blazed by CAD lower.
Thank you.
Jack Crooks
President,
Black Swan Capital
772-349-6883/ Twitter: bswancap

-
I know Mike is a very solid investor and respect his opinions very much. So if he says pay attention to this or that - I will.
~ Dale G.
-
I've started managing my own investments so view Michael's site as a one-stop shop from which to get information and perspectives.
~ Dave E.
-
Michael offers easy reading, honest, common sense information that anyone can use in a practical manner.
~ der_al.
-
A sane voice in a scrambled investment world.
~ Ed R.
Inside Edge Pro Contributors

Greg Weldon

Josef Schachter

Tyler Bollhorn

Ryan Irvine

Paul Beattie

Martin Straith

Patrick Ceresna

Mark Leibovit

James Thorne

Victor Adair