Currency

Latest Oil Price Drop Drags Canadian Dollar To 14-Month Low

74a2158c23b7ba1f62fab39fabd74460
The Canadian dollar dropped against the U.S. dollar to a 14-month low on Tuesday as the lower oil prices earlier this week added to the downside for the currency of Canada, whose key export commodity is oil.

Oil prices fell on Monday and Tuesday as hedge funds and money managers started to cut bullish positions in a reaction to quickly growing supply. At 3:40pm EST on Tuesday, WTI was trading down over 2 percent on the day, well below the US$50 mark at US$47.59. Brent Crude was trading at US$50.38. Brent Crude hit a low early on Tuesday of US$50.14—the lowest point this year.

Brent prices have now erased all the price gains since OPEC agreed at end-November to a collective production cut in an effort to help draw down bloated global inventories and prop up the price of oil.

According to Reuters data, at 4:00pm EST on Tuesday, the Canadian dollar was trading at US$0.7291, down from the US$0.7309 at close on Monday. 

On Tuesday, the American Petroleum Institute (API) reported a healthy draw of 4.2 million barrels in United States crude oil inventories for the week ending April 28, compared to analyst expectations that markets would see a bit of relief with a crude oil draw of 2.2 million barrels.

Early on Wednesday, oil prices were ticking higher, with the EIA inventory report expected later in the day.

While the inventory reports are expected to influence the oil prices, the biggest currency market mover this week will be the Fed interest rate decision on Wednesday. The Fed is expected to hold, but may point to future policies, or a possible increase in June, in its statement, analysts reckon.

For the loonie, apart from oil prices, the currency movers are the future of the North American Free Trade Agreement (NAFTA), concerns over the Canadian mortgage market, and expectations that the Bank of Canada will likely not raise interest rates this year.

By Tsvetana Paraskova for Oilprice.com

More Top Reads From Oilprice.com:


2 Extremely Crowded Currency Trades

Summary

Bonds: Traders are betting on a steeper Treasury yield curve. They’re short the 30-year bond and long the 5-year.

Commodities: Hedgers are extremely long cocoa and short feeder cattle. Speculators have ramped up their long exposure to gold since March. They’re also extremely short soybeans.

Currencies: Traders are betting on a stronger AUD/USD and MXN/USD. We saw some fairly aggressive short covering in GBP/USD last week.

Stocks: Money managers are still less bullish on the Nasdaq vs. the Dow. Traders covered a few VIX shorts last week.

Note: My approach for analyzing CoT data to reveal how different types of traders are positioned in the futures markets is outlined here. If you missed it, give the article a read to see the method behind my analysis. All data and images in this article come from my website.

This article outlines how traders are positioned and how that positioning has recently changed. I break down the updates by asset class, so let’s get started.

Bonds

Traders covered shorts in 30-year bond (NYSEARCA:TLT) futures last week. Overall though, they still have a significant short bias.

47125416-1493674554139528 origin


….continue reading HERE

Forex Trading Alert: USD/CAD – Invalidation of Breakout or Further Rally?

Sent to subscribers on April 27, 2017, 7:22 AM.

Earlier today, the greenback moved lower against the Canadian dollar, which pushed USD/CAD below the December high and the previously-broken resistance zone. Is it enough to trigger further deterioration?

In our opinion the following forex trading positions are justified – summary:

EUR/USD

2017-0-27-EURUSDWeekly


EUR/USD - the daily chart

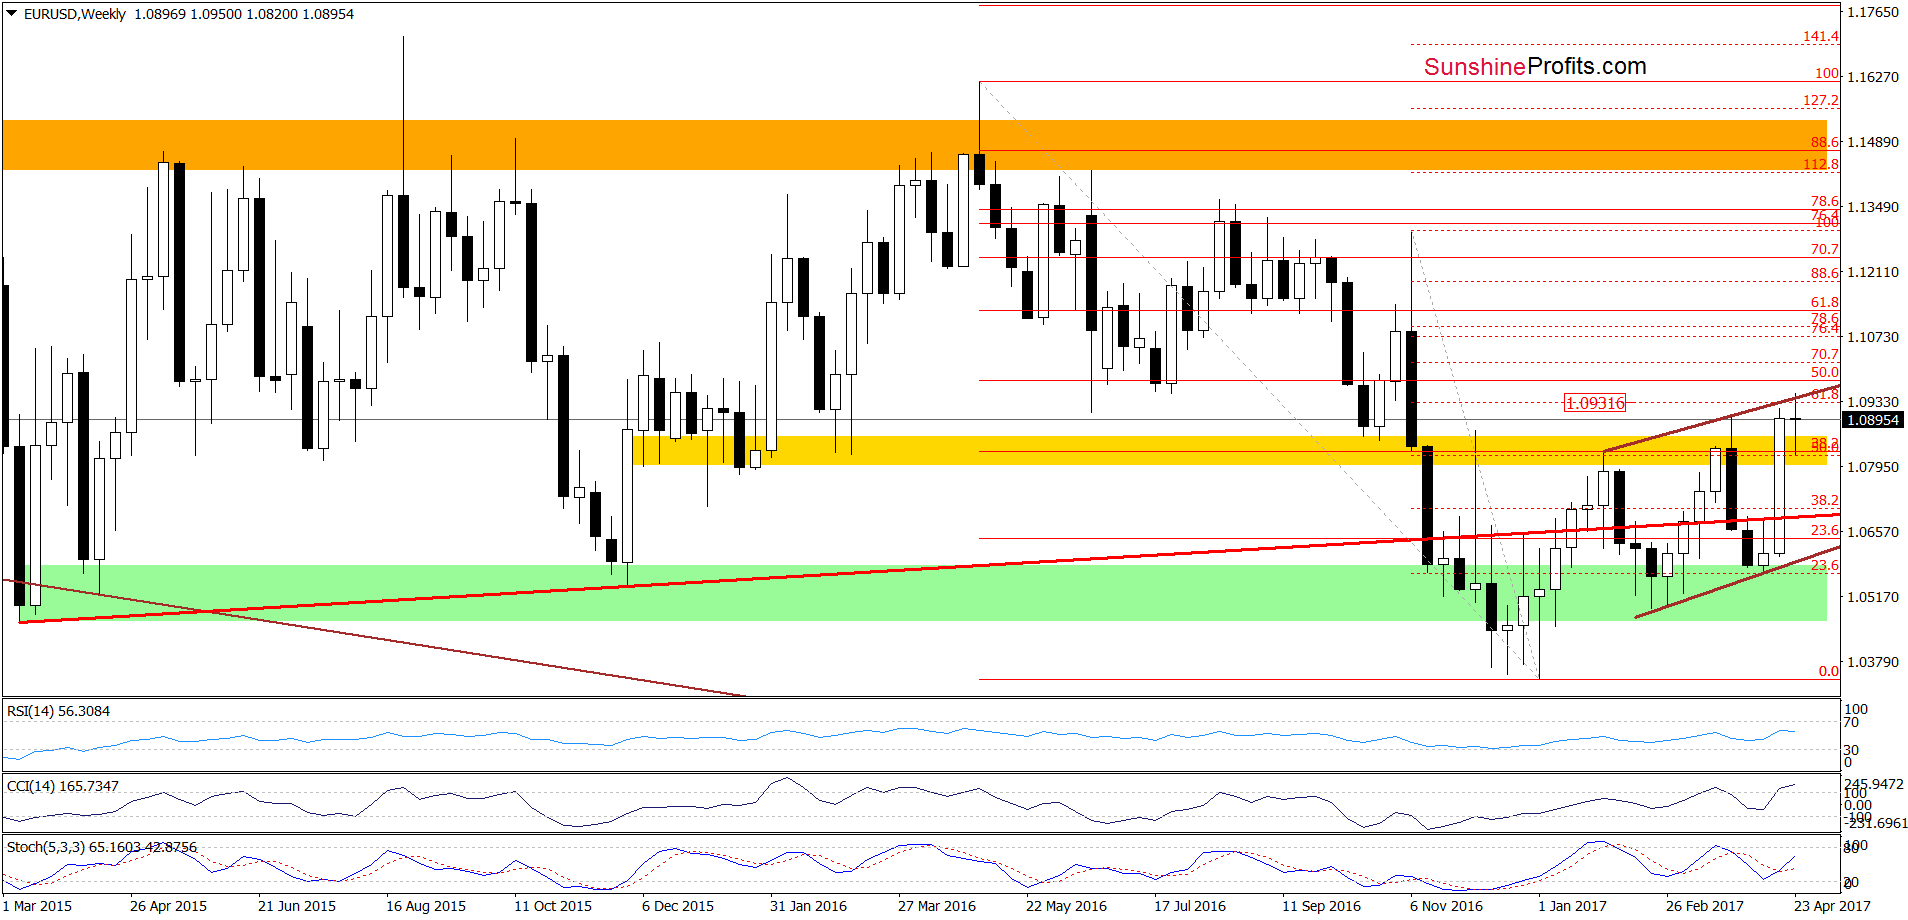
Looking at the charts, we see that although EUR/USD rebounded slightly yesterday, this “improvement” was very temporary and currency bears pushed the exchange rate lower earlier today. Thanks to this drop the pair came back under the March high, which means that our previous commentary on this currency pair is up-to-date:

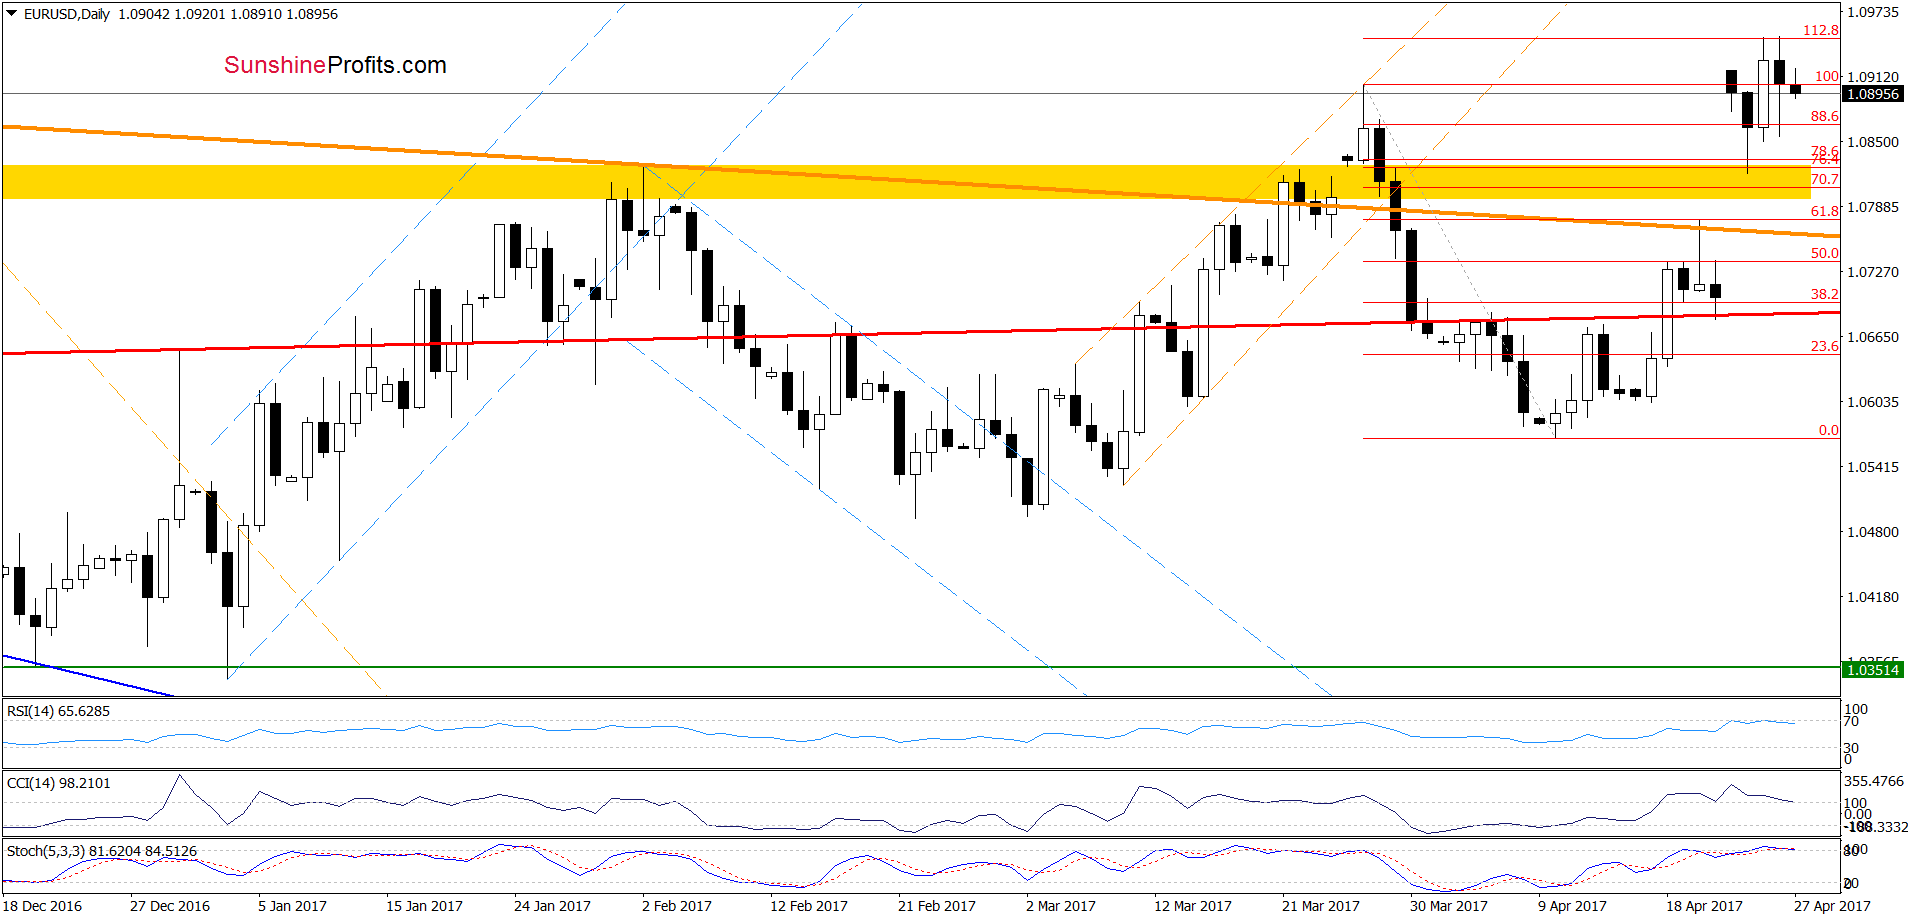
(…) EUR/USD tested the strength of the upper border of the brown rising trend channel, the 61.8% Fibonacci retracement (both marked on the weekly chart) and the 112.8% Fibonacci extension (seen on the daily chart), which resulted in a comeback below the March high. Additionally, the sell signal generated by the RSI remains in place, supporting currency bears. On top of that, the CCI and the Stochastic Oscillator are very close to generating sell signals, which suggests that reversal and lower values of the exchange rate are just around the corner.

Very short-term outlook: bearish
Short-term outlook: mixed with bearish bias
MT outlook: mixed
LT outlook: mixed

Trading position (short-term; our opinion): Short positions (with a stop-loss order at 1.1052 and the initial downside target at 1.0521) are justified from the risk/reward perspective. We will keep you informed should anything change, or should we see a confirmation/invalidation of the above.

USD/JPY

USD/JPY - the daily chart

Quoting our last commentary on this currency pair:

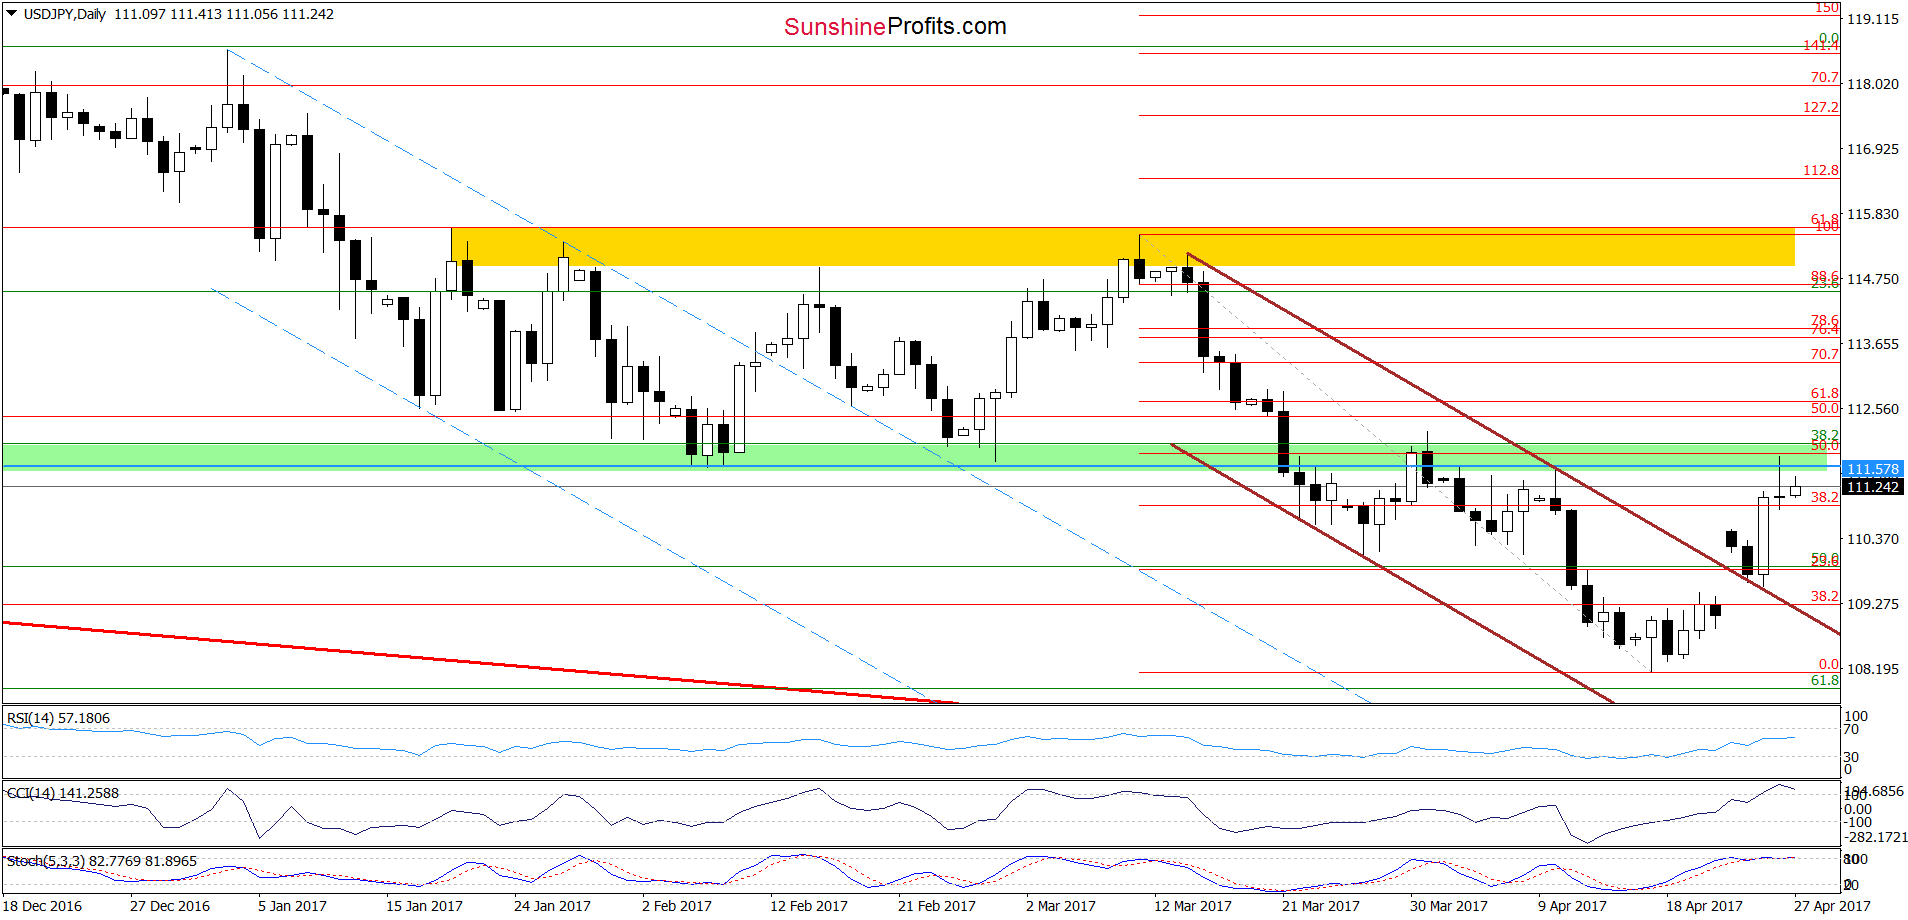
(…) the combination of the lower border of the brown declining trend channel and the lower line of the blue trend channel (both marked on the weekly chart) triggered a rebound, which took the exchange rate above the upper line of the brown declining trend channel seen on the daily chart. Earlier today, the pair moved a bit lower, which looks like a verification of the earlier breakout. If this is the case, we’ll see further improvement and a test of the green zone (marked on the daily chart in the coming days.

From today’s point of view, we see that the situation developed in line with the above scenario and USD/JPY extended gains, making our long positions more profitable and reaching our first upside target yesterday. What’s next? Taking into account the green resistance zone and the current position of the daily indicators it seems that we may see a pullback in the coming days. 

Nevertheless, when we zoom out our picture and take a closer look at the medium-term chart below, we see that the buy signals generated by the weekly indicators remain in cards, supporting currency bulls and further improvement.

USD/JPY - the weekly chart

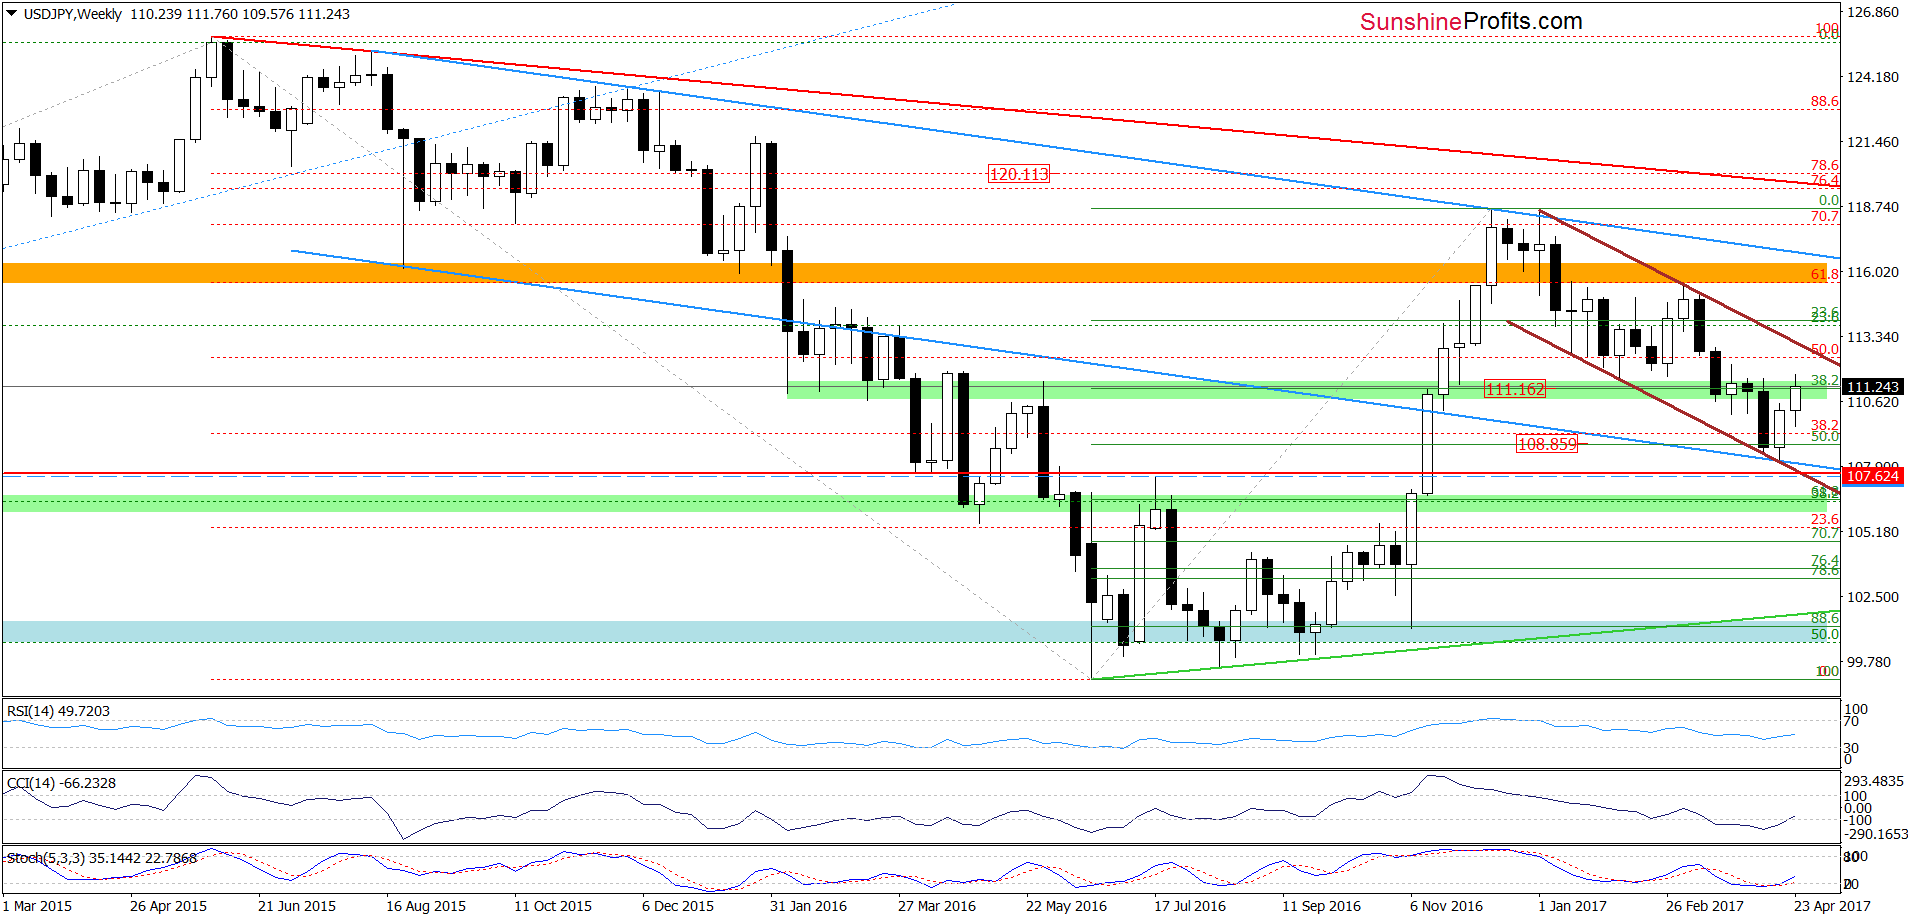
Therefore, even if USD/JPY moves a bit lower in the very short-term perspective, we believe that higher values of the exchange rate are just a matter of time. This means that if the exchange rate breaks above the green zone, we’ll see (at least) a test of the upper border of the medium-term brown declining trend channel in the following days.

Very short-term outlook: bullish
Short-term outlook: bullish
MT outlook: mixed
LT outlook: mixed

Trading position (short-term; our opinion): Long (already profitable) positions (with a stop-loss order at 107.62 and the initial upside target at 111.16) are justified from the risk/reward perspective. We will keep you informed should anything change, or should we see a confirmation/invalidation of the above.

USD/CAD

USD/CAD - the weekly chart

USD/CAD - the daily chart

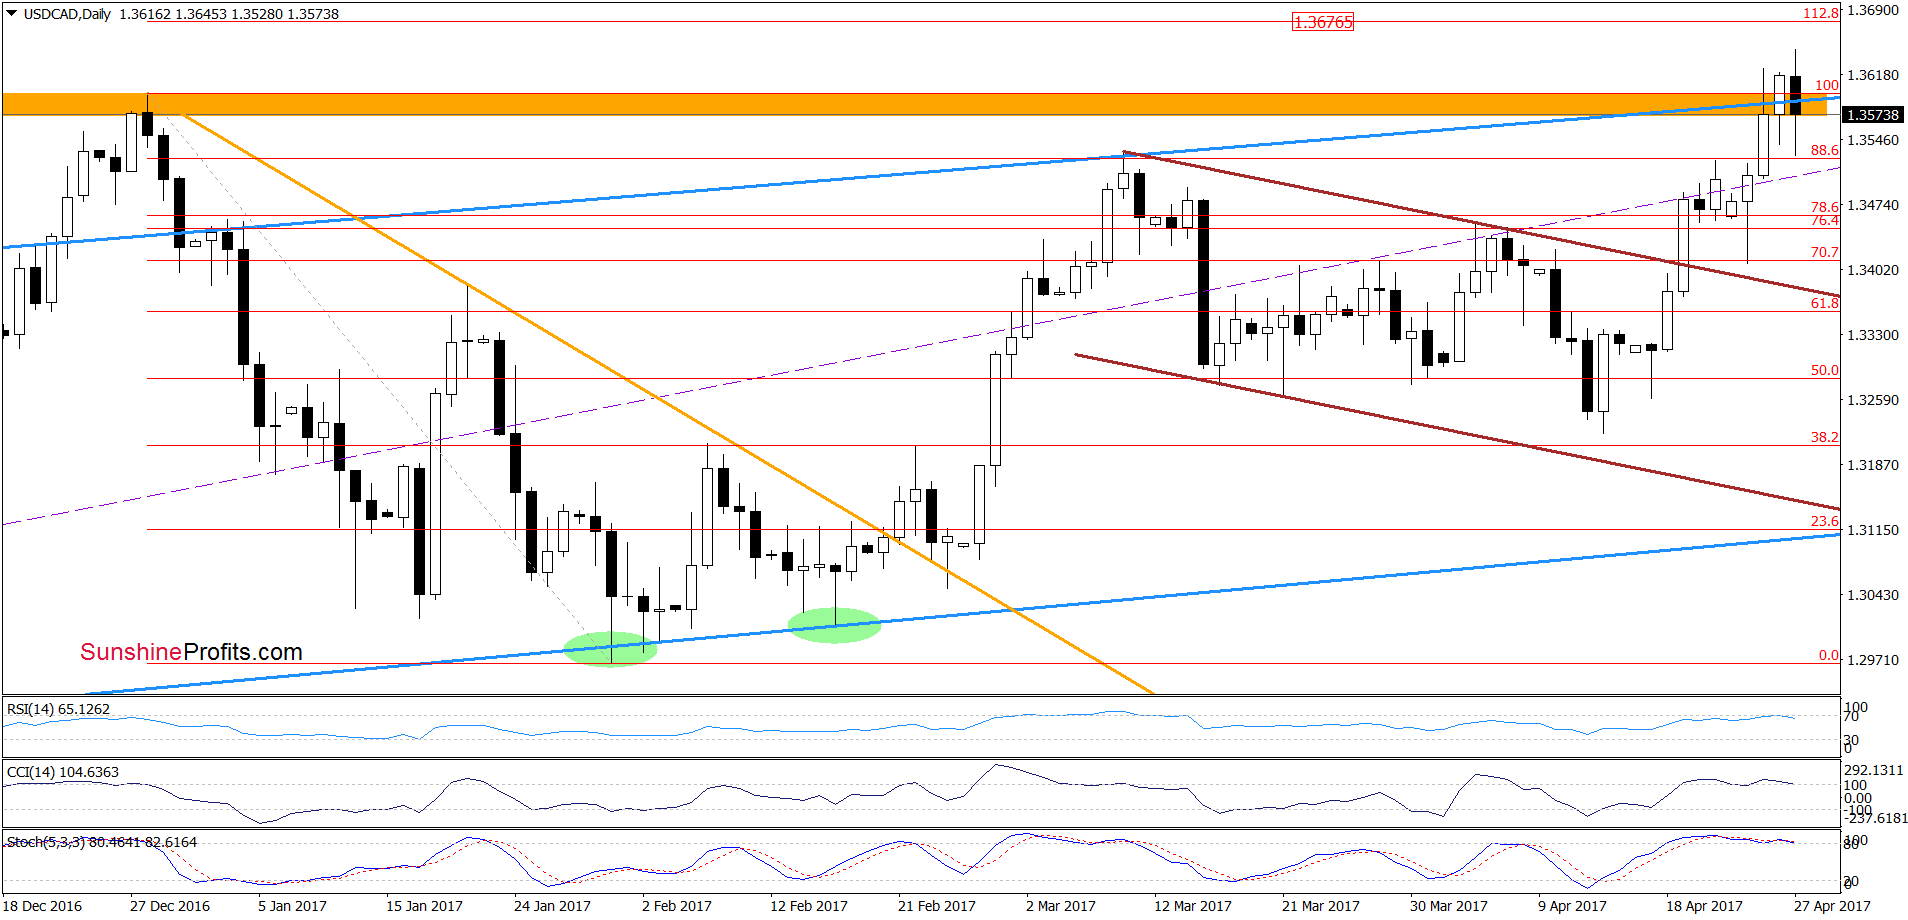
On the daily chart, we see that although USD/CAD broke above the December high and the orange resistance zone, currency bulls didn’t hold gained levels, which resulted in a pullback earlier today. Thanks to this move, the pair invalidated the earlier breakout, which is a negative development – especially when we factor in the current position of the daily indicators. Nevertheless, this event will be more bearish and reliable only if USD/CAD closes today’s session under the previous peak and the orange zone.

Very short-term outlook: mixed
Short-term outlook: mixed
MT outlook: mixed
LT outlook: mixed

Trading position (short-term; our opinion): No positions are justified from the risk/reward perspective. We will keep you informed should anything change, or should we see a confirmation/invalidation of the above.

Thank you.

Nadia Simmons
Forex & Oil Trading Strategist
Przemyslaw Radomski, CFA
Founder, Editor-in-chief, Gold & Silver Fund Manager

Shorting Euro today…cautiously…

Quotable

“Come what may, all bad fortune is to be conquered by endurance.”  –Virgil

Commentary & Analysis

Shorting Euro today…cautiously…

1492715229525

Clarity in the currency markets of late has been cloudy at best.  The competing rationales continue to be: 1) End of the Trump reflation trade and therefore the US dollar has peaked: or 2) It wasn’t necessarily the reflation trade (which still may be on but delayed) but the rising US yield differential supporting the dollar on the back of three Fed hikes in 2017 which was the driver anyway. 

Some news from today and yesterday gave us a bit more confidence in our Wave chart setup….

This headline story from Reuters, coupled with some data that suggest a decline in US growth momentum supports the dollar bearish view (or the euro bullish view):

  • WASHINGTON, April 20 (Reuters) – Dallas Federal Reserve President Robert Kaplan said on Thursday that three interest rate hikes this year remains possible but that the U.S. central bank has the flexibility to wait and see how the economy unfolds. “The median for three rate increases this year…is still a good baseline. If the economy develops a little more slowly, then we can do less than that and if the economy is a little stronger, we can do more than that,” he said in an interview with Bloomberg TV.

Yesterday’s inflation data out of the Eurozone likely plays into ECB rate expectations:


…so we went short a ½ position EUR/USD on this setup this morning, as we had an extension target of 1.0776, which it hit right on the button today.  The target, technically, based on an extension of Wave C equaling 1.618 x Wave A and also a key retracement, 61.8% of Wave [1] down, coming in at the same level…1.0776…it seems to be holding now and looks as if this is a good risk/reward short:

You never know; but so far so good… 

You can sign up for a free trial of our services at our home page www.blackswantrading.com

Thank you.

Jack Crooks

President, Black Swan Capital

jcrooks@blackswantrading.com

www.blackswantrading.com

772-349-6883/ Twitter: bswancap

Connecting The Dots

Headed into what we anticipate will bring some fireworks to the currency markets this month, the US dollar index has again turned down modestly in the front half of this week. 

Screen Shot 2017-04-13 at 10.31.35 AM


Currently trading behind a series of lower highs and lows from this past December’s cycle peak, our expectations remain for a breakdown below the index’s long-term uptrend extending from the July 2014 breakout.

usdtoday3

Over the past few months…

….contiinue reading and viewing 10 more large charts HERE