
Currency
 Transcript Below:
Mike Gleason: Well, to start out here Dr. Faber, before we get into some other stuff I wanted to hear your comments on the state of the U.S. economy. Now, it appears the Federal Reserve has finally gotten serious about moving rates higher at least modestly. U.S. equity markets seem to be discounting that fact, focusing instead on the so-called Trump trade. Markets are pricing in a huge infrastructure spending program and tax cuts stimulates that could overwhelm any modest tightening at the Fed. Now that efforts to reform healthcare seem to be failing we expected some of the optimism surrounding president Trump’s other initiatives would leak out of the stock market but so far that hasn’t happened.
Stocks remain near record highs and there isn’t a whole lot of interest in safe haven assets including precious metals. So, what are your thoughts here Marc? Is now a time to take some profits and move towards safety or is there still some good upside in equities?
Marc Faber: Well, I think that in terms of the economy I don’t think the economy is as strong as people believe or as the statistics would show and recent trends have rather been indicating some weakness is auto sales, not a particularly strong housing market and we have several problems as a result of excessive credit. So, I think that the economy is not going to do as well as people expect and concerning the huge infrastructure expenditure that Mr. Trump has been talking about, it is about a trillion dollars over ten years, maximum. In other words, a hundred billion a year.
In China in 2016 in the first ten months the infrastructure expenditures were 1.6 trillion, in other words 16 times higher than what Mr. Trump is proposing. So just to put this in a perspective. Now throughout Asia and the emerging world there will be a lot of infrastructural expenditures in the years to come. The question is will stocks go up because of that, maybe some stocks will go up and some will not. So, we have to be now increasing the selective in what we purchase in terms of equities. My sense is that the economy in the U.S. is weakening and not strengthening.
Mike Gleason: It is also possible markets aren’t responding to fundamentals and we ought to consider those ramifications. The advent of high frequency trading and massive intervention by central bankers could mean markets become more irrational than ever. It is possible for instance to see stock prices being bid higher despite slowing GDP growth, rising interest rates and congress failing to deliver fiscal stimulus here in the U.S. I mean, how artificial do you think markets are and to the extent today’s markets aren’t real, how much long will the central planners and bankers be able to maintain this illusion that they’ve created?
Marc Faber: Well, basically some people say that the central banks are out of bullets. This is not my impression. They can keep on printing money and boost asset prices where by not all asset prices will go up, some will go up and some will go down. But the point I want to make is the central banks are not really out of bullets. The economy, if it weakens some stocks will outperform others, in other words recently you’ve seen the weaker in automobile stocks, so there is still a selective process in the market. The stocks that have gone up the most recently are actually mostly companies with very little earnings, very high evaluations, Tesla, Amazon, Netflix and so forth and we’ll have to see.
All I can say is when I look around the world, I don’t see any particularly good values in the U.S. except in mining companies and I think some of the interest rate sensitive stocks are again relatively attractive because I expect the economy to disappoint, especially if the Fed continues to increase interest rates and so a short increase in interest rates could mean some further weakness in bond prices but eventually bond prices could rally again and this is my view that the U.S. by any standards compared to historical evaluations, compared to Europe, compared to Asia, compared to emerging markets the U.S. is very expensive. Now, can it go up another ten percent? Maybe 20 percent? Yes, between December 1999 and 2000 March 21 when the stock markets peaked out the Nasdaq was up more than 30 percent, but was it a good buy? No, everybody who bought at the time in the first three months of 2000 lost money.
So, my sense is that yeah people can buy stocks here but most of them are going lose money with the exception in my view, that mining stocks will perform reasonably well.
Mike Gleason: Let’s shift focus now and talk about what is happening elsewhere in the world, you’ve alluded to it in prior answers but you’re originally from Europe and now you live in Asia. Now, it’s easy for Americans to focus on domestic affairs such as the new president and lose track of important developments in other parts of the world. Can you update our listeners on developments you are watching in Asia? China in particular.
Marc Faber: Well, whether it’s sustainable or not the fact is that the Chinese economy has been improving recently, somewhat. Maybe it’s all driven by credit but for now they have stabilized the economy, it’s improving and it has had a huge impact on the prices on resources including copper and zinc and nickel and so forth and it has had a favorable impact on the Asian market. Earlier you asked me about the U.S… this whole euphoria about the performance of U.S. stocks, the fact is in Asia just about every market has outperformed the U.S. In Europe, just about every market has outperformed the U.S. measured in U.S. dollar terms. So, I think that the impact of an improving Chinese economy is being felt more in other emerging economies than say, in the United States.
Mike Gleason: How about Europe? The future of the European Union is in question with some important elections upcoming, banks there remain at risk and several if not most countries continue to struggle with slow growth and overwhelming debts. Give us your thoughts on Europe and how things might unfold there over the remainder of the year.
Marc Faber: Well, I’ve just written two reports recently highlighting that in Europe there are some companies, mostly utilities and infrastructure related companies that on a valuation screen appear relatively attractive. They have dividend yields of between four and six percent, the Euro is weak or has been weak and is at the low level and these yields of four to six percent are very attractive considering the bonds yield in Europe. And so, I think that this year European stocks and especially the stock I mentioned, infrastructure plays, utilities and also food (stocks) will way out perform the U.S. I also happen to think that there will be more and more American companies and foreign companies that will be interested to acquire European companies.
Mike Gleason: How about the geopolitical side, I know many of those nations over there the people are watching what happens with Brexit and have watched what’s taken place there. France, the Netherlands, some other nations have some important votes coming up. What do you make with everything that’s happened there with the state of the European union and how those votes might go as we go throughout the year and see some of these important elections come to fruition.
Marc Faber: Well, this is the big question and we all don’t know exactly what the answer is. My sense is that the Euro will stay and if some weak countries decide to leave the Eurozone, their currencies will be obviously punished. And if some weak countries decide to leave the Eurozone, I think the euro will strengthen. It’s just that if Italy decides to leave the Eurozone, the euro will strengthen but obviously, the new currency (of Italy) will weaken. And so, I think that this Is not a big concern for me.
Furthermore, with the euro having declined so much against the U.S. dollar, if there is further weakness in euro, European stocks will adjust on the upside and foreign companies from Asia… China, Japan and the U.S. will increasingly acquire European companies and European assets.
Mike Gleason: Gold is often referred to as the anti-dollar, if we see the euro strengthen and last as a currency, does that then weigh heavily on the U.S. dollar and might we see gold spike as a result of that because the dollar finally is starting to weaken a little bit?
Marc Faber: Yes, I mean the consensus was, at the beginning of the year that the only game in town are U.S. stocks and the U.S. dollar. I don’t believe that the U.S. dollar is structurally a strong currency. Now can it stay high as it’s rallied a lot against the euro but at this level, I don’t think that the U.S. is very competitive. So, my sense would be the U.S. dollar is vulnerable as well as asset prices in the U.S. both.
Mike Gleason: Dr. Faber, do you see the tide changing world wide when it comes to the importance of gold ownership? We know Asians are buying it relentlessly and so are folks in Europe, maybe that mindset hasn’t made its way to the U.S. yet, but do you sense that may be coming? And once it does do you foresee any problems with being able to get physical metal once the masses, especially in the western world, wake up to the idea that they ought to own some?
Marc Faber: Well, the gold market is very interesting because it consists of a very limited number of people who are “gold bugs” as they call them. And these are people that will accumulate gold, physical gold and gold shares and so forth, but this is the minority. And then there are the gold detractors. These are mostly fund managers and so-called central bankers. And central bankers are not particularly smart. And then there are people who simply haven’t heard about gold as an investment… and don’t forget that in the U.S. 50 percent of the people have no interest in investments for the simple reason that they have no money. You could show them any proposal for an investment, they wouldn’t be interested because they have not the money to invest in the first place.
But in general I think that people will gradually wake up to the fact that in absence of knowing how the world will look like in five or ten years, you need some diversification and in this environment, I think that some people will say “well, let’s own some gold.” Most people will only own five or ten percent but some people will own 20 percent and I think that if the whole world decides to own, just say three percent or five percent, and the fund managers who are very anti gold see gold prices running up again… the whole investment business has become a momentum game… so if they see that gold is moving up in a convincing way they’ll buy gold.
So, my sense is that you need some gold strength and then people will come in and buy gold simply because it moves up. I buy gold all the time, of course within my asset allocation… I also have shares and bonds and real estate… but I always buy some gold to maintain the proper weighting.
Mike Gleason: Well, as we begin to close here, what do you expect for the remainder of 2017 and what kind of second half of the year do you think it will be for hard assets like gold and silver specifically?
Marc Faber: Well, at the beginning of the year so many people have started to write reports about the surprise of 2017 and projections of 2017, so everybody has a view, nobody knows precisely and the lot will depend on central banks’ monetary policies. I don’t believe central banks can tighten meaningfully, maybe optically they do some, but in general I think they’ll keep money printing on the table as far as we can see, in other words, for the next few years. And eventually it will be friendly for precious metals and hard assets. Number two, hard assets such as precious metals are at the historical low point compared to financial assets, so I think that’s going forward there’s a huge discrepancy in the performance between financial assets which has been very good since 2009 and gold which has been more mixed… it’s also up but it’s been more mixed especially after 2011… that these hard assets will come back into favor.
So, if you’re asking what is my expectation for the rest of 2017, I think that gold shares are an attractive asset class. I think precious metals can easily move up another 20, 30 percent, possibly 100 percent or so. In general, I would say American investors should take the opportunity that the dollar is strong and that asset prices, in other words stocks and bonds in the U.S. has been strong to reduce their positions in the U.S. in terms of equities.
Mike Gleason: Yeah and certainly you hit the nail on the head earlier there with the whole momentum trade and it will be interesting to see what happens if we do start to see some positive upside momentum in the metals… more and more hedge fund managers getting into that space and it really feeding on itself and creating a snowball effect there, it could be interesting to see that play out. Well, Dr. Faber thanks very much for your time and your wonderful insights and we certainly appreciate you staying up late in Thailand to speak with us today. Now before we let you go, tell people how they can subscribe The Gloom, Boom and Doom Report and get your fantastic commentaries on a regular basis.
Marc Faber: It’s my pleasure, the best is to go on the website www.GloomBoomDoom.com – it’s all written in one word.
Mike Gleason: Well, excellent stuff. It’s been a real honor to speak with you Dr. Faber. I hope we can catch up with you again sometime soon, thanks very much for joining us.
Marc Faber: My pleasure, thank you. Have a nice day.
Mike Gleason: Well, that will do it for this week. Thanks again to Dr. Marc Faber, editor and publisher of The Gloom, Boom and Doom Report, again the website is GloomBoomDoom.com be sure to check that out.

The Canadian dollar will weaken over the coming months, pressured by an uncertain economic outlook and the prospect of higher interest rates in the United States even as the Bank of Canada stays on the sidelines, a Reuters poll showed.
While the loonie may gain a little in the short term on expectations of stronger first-quarter economic growth in Canada, the survey of close to 50 foreign exchange strategists showed it will weaken to C$1.35 per U.S. dollar in three months and close the year at the same level.
It is already 3 % lower than at this time last year.
Even as the U.S. Federal Reserve raised rates in March – its second hike in three months – and plans to hike twice more this year, the Canadian central bank is not expected to boost rates until 2018. It cut them twice in 2015.
“It is essentially a policy differential story,” said Shaun Osborne, chief currency strategist at Scotiabank.
“Some people have started … thinking that perhaps with the Federal Reserve now appearing a bit more fully committed to raising interest rates, that may mean something for Canada in the near- to medium-term … which I think is way too premature.”
Even though respondents expected the loonie to rise marginally in one month to C$1.34 from Wednesday’s close of C$1.3434, the forecast range remained wide, running from C$1.28 to C$1.39.
“We are possibly looking at the early stages of a renewed sell-off in the Canadian dollar in the next few weeks,” Osborne said. “There is just a lot of uncertainty here at the moment that rather suggests to me, anyway, that some of the strength we have seen in the Canadian data over the past few weeks is probably not sustainable.”
 Data from the Commodity Futures Trading Commission and Reuters calculations showed that speculators have increased bearish bets on the Canadian dollar to the most since March 2016.
Wells Fargo, the top forecaster in Reuters FX polls in 2016, expects the currency to weaken 5 % over the coming year to C$1.41.
Caution ahead
Despite a recent run of strong domestic data, Bank of Canada Governor Stephen Poloz has maintained a cautious stance on monetary policy, saying a premature rate hike could cause a recession in Canada as the economy has not yet fully recovered from the shock of weak oil prices.
The price of oil, one of Canada’s key exports, at around $55 a barrel, is still down over 50 % from its mid-2014 high. Commodity analysts polled by Reuters are still unsure if output curbs by OPEC members will be enough to offset the increase in U.S. production.
That does not support Canada’s highly indebted households that on an average owed C$1.67 for every dollar of disposable income in the fourth quarter, much of it because of cheap mortgage borrowing to chase ever-rising house prices.
The property market has turned into a key vulnerability for Canada’s financial system, posing a challenge to policymakers who can neither lower rates to stoke growth nor raise them to discourage further borrowing.
Another threat is rising anti-trade sentiment in the United States under President Donald Trump that has put the outlook for Canadian exports and the loonie under closer scrutiny.
Exports tumbled by the most in nearly a year in February, sending the loonie to a nearly three-week low of C$1.3455 on Tuesday, suggesting the monetary policy gap between the U.S. and Canada is unlikely to be plugged anytime soon.
“The policy divergence story will be in play until the end of this year. We don’t expect the Bank of Canada will raise rates until the first half of next year now,” said Royce Mendes, director and senior economist at CIBC Capital Markets in Toronto.
“We still see that there has been little evidence of a sustainable acceleration in underlying export growth or investment spending, and that’s a key component of the recovery we need to see for the Bank of Canada to really be comfortable with tightening policy.”
….also:

In yesterday’s alert we emphasized that the breakdown in the USD Index should not be trusted as it was not confirmed and there were several good reasons to think that it would not be confirmed. The breakdown is already invalidated and – again, as discussed yesterday – this is actually a strong bullish sign. Is the decline in the USD Index over and is the big slide in the precious metals sector just around the corner?
In short, that seems quite likely. Naturally, there’s much more to the precious metals market than just the USD Index and it’s prudent to analyze more factors than just this specific index. In other words, it is of utmost importance especially at this time, but there are many other important signs to keep in mind. Still, let’s start today’s analysis with the U.S. currency (charts courtesy of http://stockcharts.com).
In yesterday’s alert, we commented on the above chart in the following way:
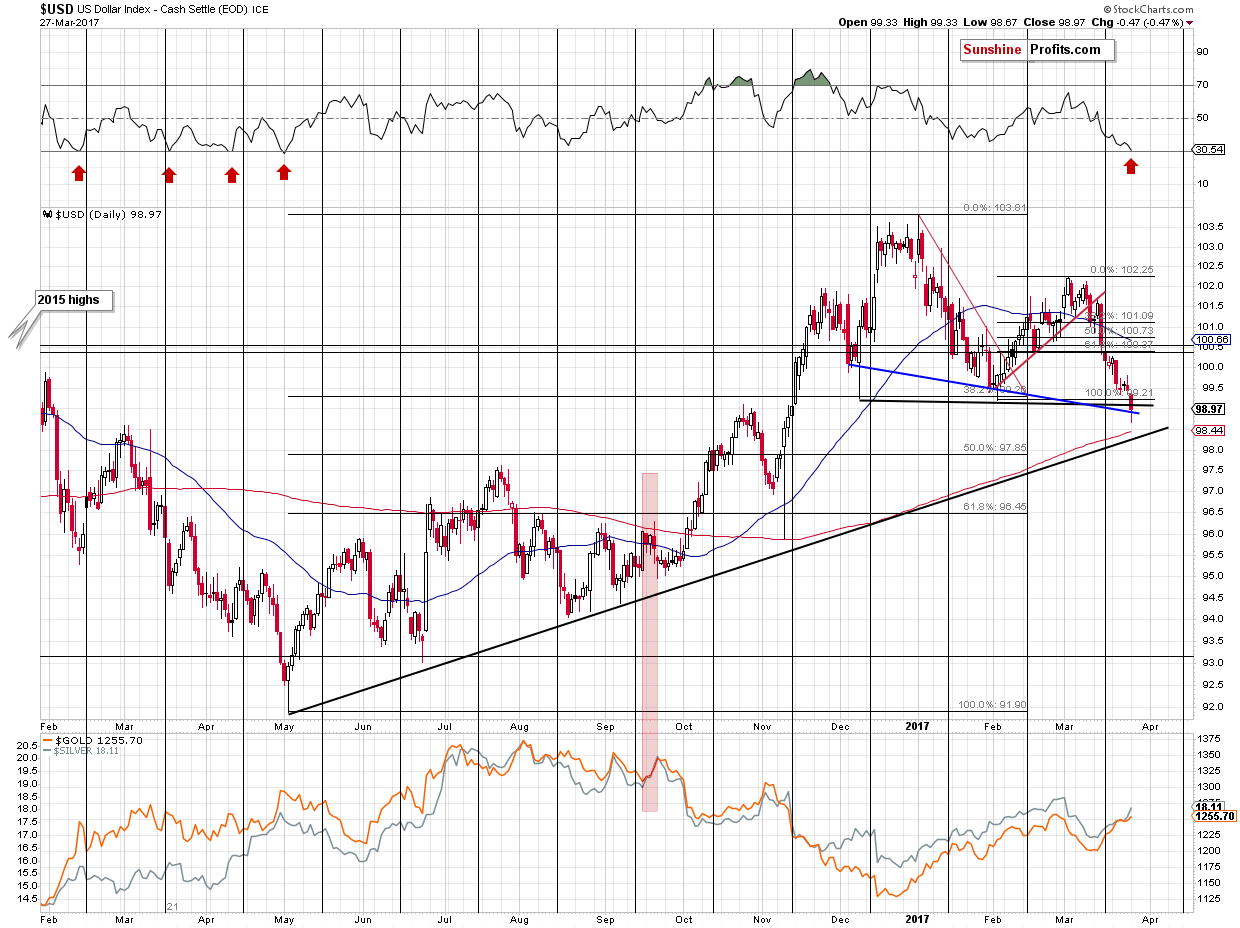
Today’s move to 99 is a small breakdown below the previous lows. Because the move is relatively small and the session in the U.S. is far from being over, it is definitely not confirmed. In fact, it could be quickly erased and the supposedly bearish event could turn into an invalidation of the breakdown, which would be a very bullish sign. For now, today’s move is not something that changes the short-term outlook.
Based on the above chart, the USD Index reversed and closed the session at 98.97 – there reversal is visible, but the breakdown was not really invalidated. However, if we take the closing price from Bloomberg – 99.166, we see that the USD Index closed extremely close to its February low (99.19). Still, no invalidation of the breakdown, but we now see that the breakdown was indeed very tiny. How much does it matter as of this moment? At this moment, the USD Index is trading at 99.21, having earlier moved to 99.347. This means that however one chooses to interpret yesterday’s breakdown or the daily reversal, the breakdown was still invalidated today and the bullish implications are in place anyway.
Additionally, if we focus on daily closing prices alone, then one can argue that there was actually no breakdown at all – the USD Index closed above the declining support line based on the daily closing prices (marked in blue). Either way, the implications of yesterday’s session are not bearish, but bullish.
The RSI indicator has just flashed / is about to flash a major buy signal as it moved to the 30 level. It didn’t move below it, but its proximity seems to be enough to be viewed as a buying opportunity. As you can see on the above chart, the last time when we saw this signal, the USD Index formed a major bottom in early May 2016. This signal also corresponded to a few local bottoms earlier that year.
The outlook for the USD Index is bullish, which has bearish implications for the precious metals market, especially that the latter is responding to the USD’s signals with much smaller strength than one might expect – the USD Index is well below its February monthly close, while gold and silver are relatively close to their own respective February closes. The USD Index’s long-term outlook and its implications for precious metals are even more important than the short-term one and our recent alerts include details. Having said that, let’s move to gold.
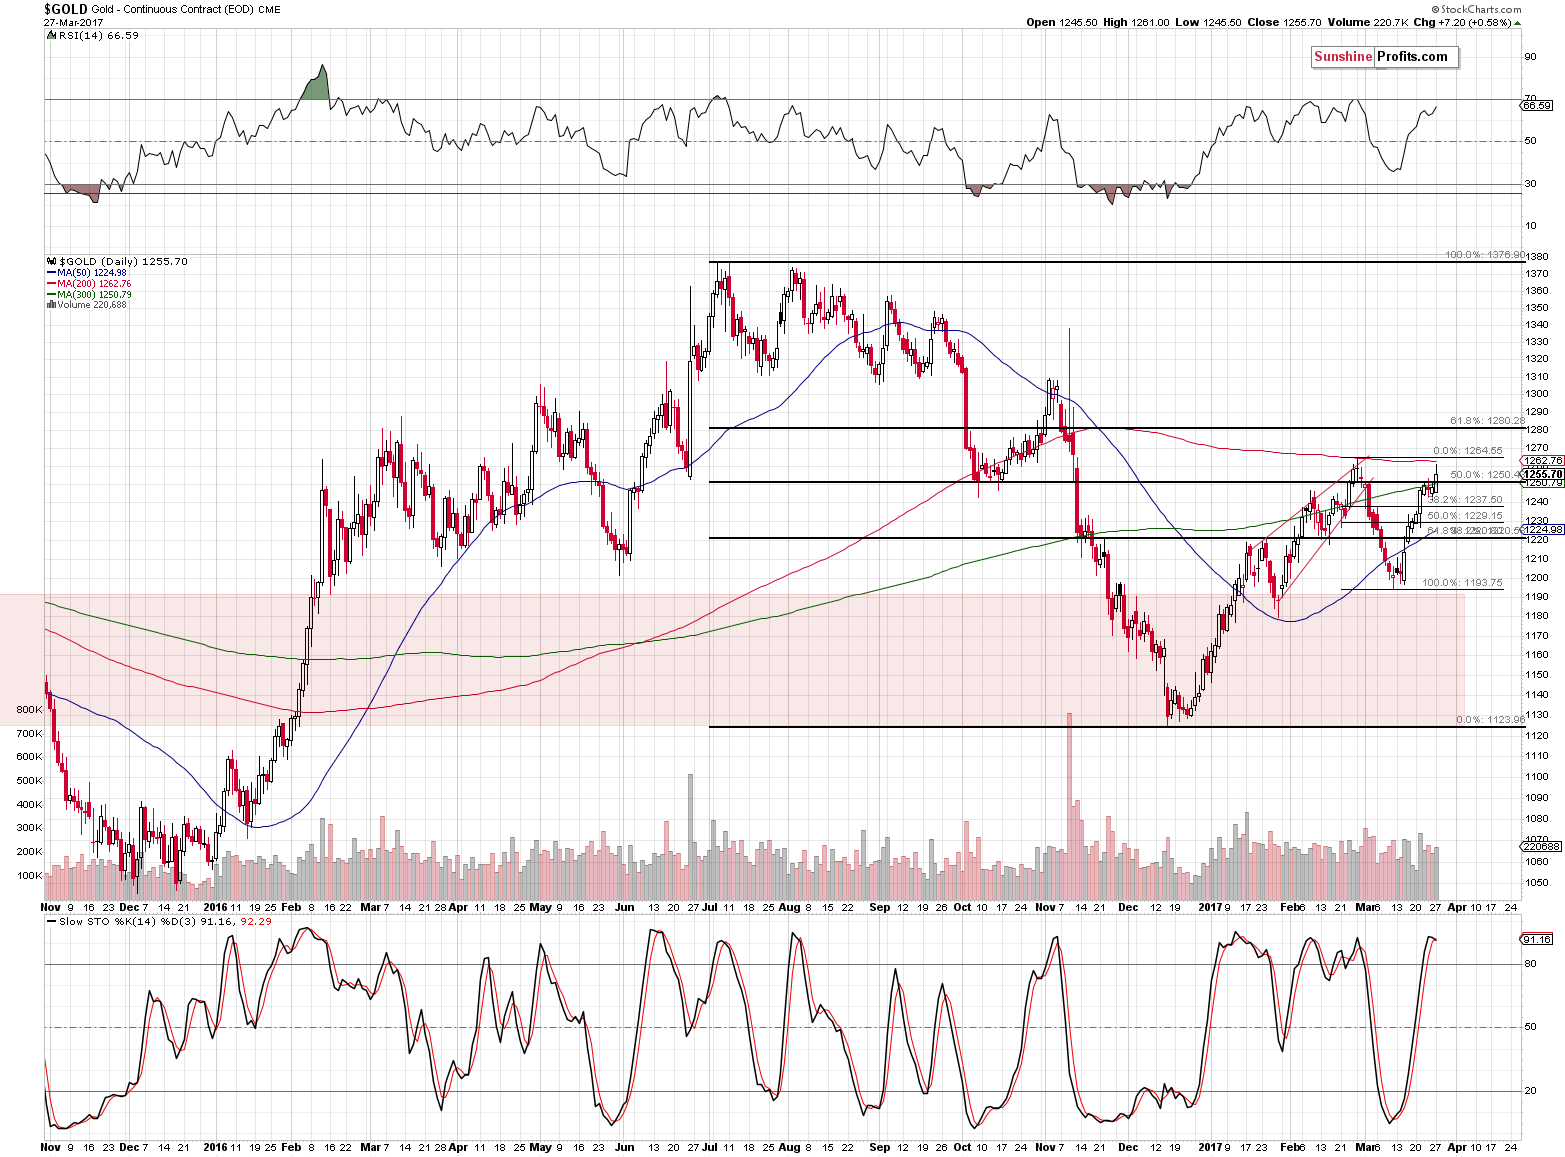
Just as the USD Index reversed yesterday, before the end of the session, gold did the same thing. As we discussed yesterday, gold moved to its February high and the 200-day moving average. Both are strong resistance levels and their combination is even stronger. Will it be enough to stop gold’s rally? It’s quite likely, especially that the volume on which gold moved higher on Friday was relatively low and this move was accompanied by silver’s outperformance (the white metal tends to outperform in the final parts of an upswing).
Gold’s volume that we saw yesterday wasn’t low, but that’s not what’s expected during reversals and thus it’s not necessarily a bullish phenomenon. Gold touched, but didn’t break the mentioned combination of resistance levels and – given the situation in the USD Index and also other factors – it’s not likely to break it or confirm such a breakout. There is a small sell signal from the Stochastic indicator, but it’s not one of the most important signals.
The mentioned outperformance of the white metal is.
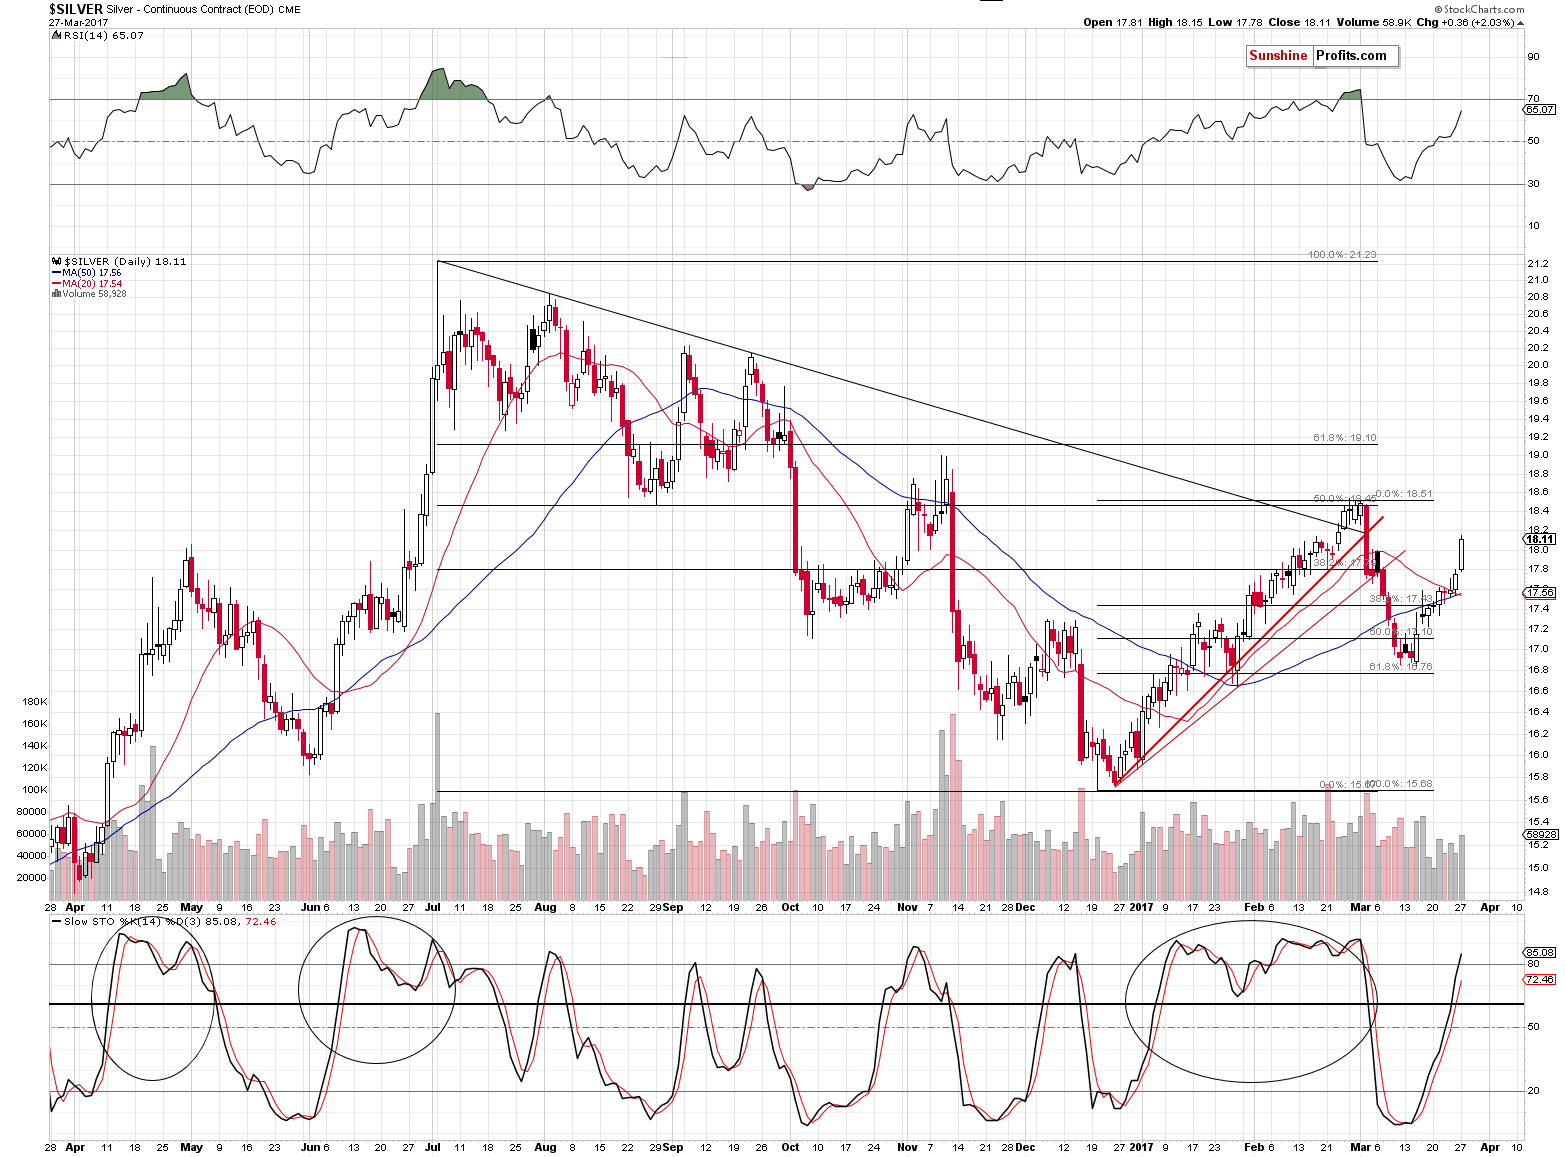
In the past years, there were numerous times when silver faked a rally, breakout or even outperformed just on an intra-day basis right before turning south. Why is this the case? There is no way to say with 100% certainty why a given move has really happened, but it’s quite likely related to the fact that the silver market is much smaller than the one for gold and thus the share of individual investors compared to the share of big, institutional (professional) investors is much bigger.
One of the lesser known gold trading tips is that the general public is usually most eager to buy close to tops and thus we see that silver (to a bigger extent driven by these investors) outperforms gold right before tops. This is not always the case and doesn’t have to be the case, but it very often is – often enough to view silver’s outperformance (especially when accompanied by mining stocks’ underperformance) as something important and bearish.
Speaking of mining stocks’ underperformance, let’s take a look at the GDX.
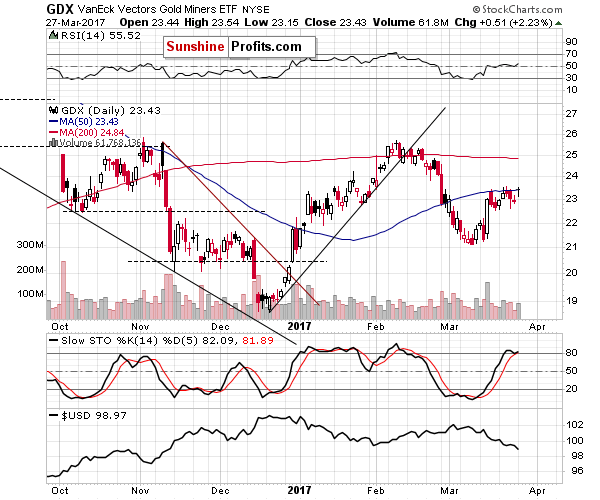
Mining stocks are not following gold higher. GDX closed at its 50-day moving average, unable to generate a visible rally even though gold and silver moved visibly higher. Miners simply moved to last week’s high – not above it. Moreover, please note that mining stocks are not even close to their February highs, which proves that their underperformance is not only a one-day event.
Summing up, the move to the February high in gold might highlight this rally’s end just as the USD’s temporary breakdown below 99 and its invalidation could mark the end of the decline in the U.S. dollar. Moving back to the title of today’s alert, please note that we have a strong bullish case for the USD in the short term, gold reaching strong resistance levels and its underperformance relative to the signals from the USD Index, silver’s visible short-term outperformance and general underperformance of the mining stocks sector (both short-term and medium-term). The buy signal from the RSI indicator (in case of the USD Index) and sell signal from Stochastic in gold supplement the already-bearish picture. Still, it is not the multitude of short-term signals that’s most important – it is the long-term outlook for the USD Index and the critical moment in it. If you enjoyed reading our analysis, we encourage you to subscribe to our daily Gold & Silver Trading Alerts.
Thank you.
Sincerely,
Przemyslaw Radomski, CFA
Founder, Editor-in-chief, Gold & Silver Fund Manager

 Summary
Here is a new list ranking currencies based on relative purchasing power. Overvalued and the least undervalued currencies are at the top. The most undervalued currencies are at the bottom.
This list is combined with a list of currencies ranked on differences in interest rate with the US. Based on these numbers, I discuss some carry trades.
Finally, I will discuss developments and opinions for a number of currencies with relative purchasing power in mind.
….related:
Some Thoughts About The Recent Price Action
Summary
Dollar losses appear to be part of a larger adjustment in the capital market.
Yellen, Dudley, a reversal higher in the price of oil, and the passage of healthcare reform by the US House of Representatives could help underpin the dollar.
The dollar bloc has lagged in recent days.
The gains the US dollar scored last month have been largely unwound against the major currencies. The dollar’s losses against the yen are a bit greater, and it returned to levels not seen late last November.
The downdraft in the dollar appears part of a larger development in the capital markets that has also seen the US 10-year yield slide 25 bp in less than two weeks.

All attention is once again on Janet Yellen and the Federal Reserve this week, as the FOMC meets to determine whether an interest rate hike is warranted.
At this point, with Fed Funds futures prices pointing toward a 95% chance of a rate hike, an increase to the federal funds rate is a near certainty. But the implications and consequences of a rate hike are less so. Let’s dig into that further.
One thing I’ve noticed in speaking to investors is that there is often an inclination to group all interest rates together. When they hear about the Fed “raising rates,” many assume that interest rates across the board, for nearly everything, will rise. This couldn’t be further from the truth and warrants more explanation.
Interest rates come in all shapes, sizes and most importantly, maturities. That is, the length of the term over which money is borrowed, and therefore accrues interest.
Take US Treasuries as an example. If you want to loan the US government money, they’ll pay you a different interest rate based on the term of the loan. You can see today’s pricing for a few select maturities in the table below:
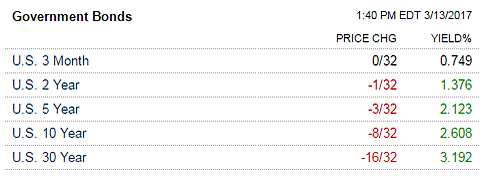
If we take these maturities and their respective interest rates and plot them on a chart, we end up with what’s known as the yield curve. You can see this as the red line in the chart below.

The yield curve contains an immense amount of information about the health of an economy. Watching how it behaves over time is one of the best indicators of upcoming economic performance that we have.
Now let’s get back to our original question: what’s going to happen on Wednesday when the Fed hikes rates by a quarter point?
While most people have a tendency to see the Federal Reserve as masters of the universe, the truth is that they have less control than most people think. When the Fed raises and lowers interest rates, they are only changing the rate at which depository institutions (banks and credit unions) lend to each other on an overnight basis.
Since there’s a good chance that neither you or I represent depository institutions, what does this mean for us? Asked differently, how will depository institutions change their debt pricing as a result of the increase in their overnight rate?
When the federal funds rate increases, as it likely will on Wednesday, there is an immediate impact to certain types of adjustable-rate debt. Banks are quick to pass along this additional cost to consumers, and we typically see this in the form of a higher prime rate.
The prime rate is a key benchmark rate and represents the rate at which commercial banks lend to their least-risky customers. While each bank sets their own prime rate, the average consistently sits 3% above the federal funds rate. Therefore, any adjustable rate loans tied to the prime rate will see an increase by roughly the same amount that the Fed raises rates.
An increase in the Federal Funds rates also impacts LIBOR – the London Interbank Offered Rate – another key benchmark to which much adjustable-rate debt is tied. LIBOR is considered one of the most influential benchmark rates in the world and represents the rate banks charge each other for Eurodollars (US dollar-denominated deposits at foreign banks) on the London interbank market.
The relationship between LIBOR and the Federal Funds rate is not as direct as with Prime, but LIBOR also has a strong tendency to track the Federal Funds rate and usually rises when the Fed hikes rates.
This means that almost immediately after a Fed rate hike, many adjustable rate debts begin to accrue interest at a faster rate. As you can imagine, this forces more resources to be applied to debt servicing, leaving less for consumption, investment etc.
The net result of this is a minor slowing of the economy, which is exactly the Federal Reserve’s intention.
But interestingly, there is a feedback mechanism in place in which higher rates can actually beget lower rates, albeit for different types (and maturities) of debt.
Taking another look at our yield curve, many people adopt the simplistic view that if rates at the short end of the curve rise (the federal funds rate), it means that interest rates across all maturities will rise. This is simply not the case, and understanding why is critical to understanding the immense predictive power of the yield curve.
As mentioned earlier, when the Fed raises or lowers rates, it is only changing the rate at which banks lend to each other on an overnight basis. As we extend out in maturity, we find that the Fed’s control over rates is relinquished to that of the market.
Let’s use the 10-year Treasury note as an example. When borrowing or lending money for 10-year periods, do you really care what the overnight rate that banks lend money to one another is? Probably not. In this case, there’s a good chance you care more about things like oh, say, future economic performance and inflation, right?
Now consider this: When the Fed hikes rates, we just saw that it has an immediate impact on debt servicing costs for adjustable rate debt tied to prime and LIBOR. As we discussed earlier, this means fewer resources are available for consumption and investment, which implies a minor restraint to economic growth.
Since economic growth and inflation go hand in hand, a Fed rate hike actually works to quell rising inflation (one of its main purposes). And this, interestingly enough, can cause longer-term interest rates to fall.
This is exactly what we saw after the Fed’s first rate hike back in December of 2015. Notice in the chart below that following the Fed’s rate hike (green line) the yield on the 10-year Treasury went down, rather than up.
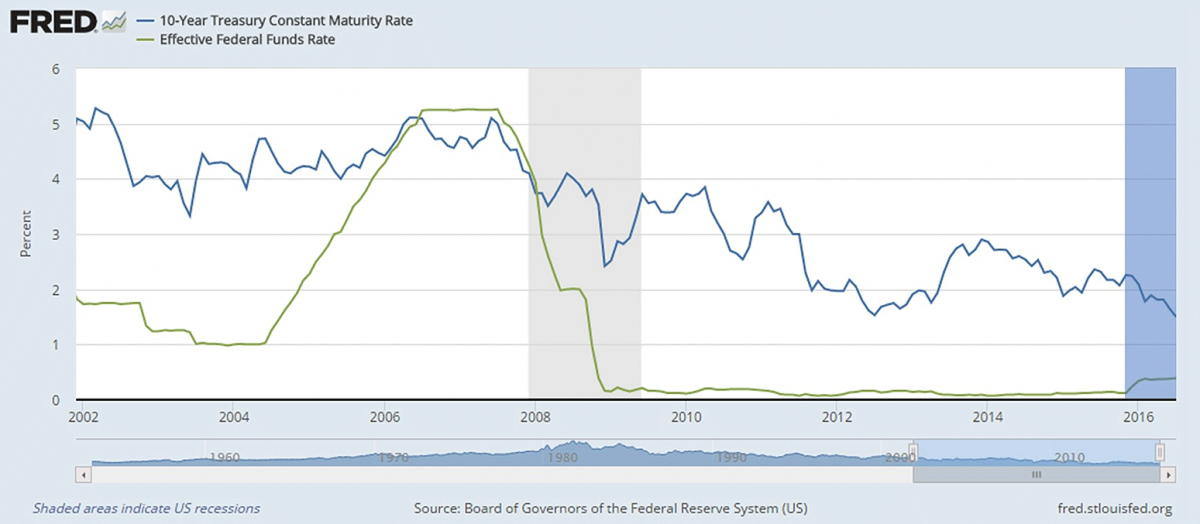
Since mortgages and other types of long-term debt tend to be priced off of the 10-year note, this means that some borrowers actually saw a reduction in interest rates following the Fed’s first hike.
But a lot has changed since then. In the roughly five quarters since we saw the first rate hike, the 10-year note yield has gone from 1.5% to 2.6%. And during that time period, the Fed only raised rates by a quarter point…
We can see how this has played out in the chart of the yield curve below. This time, I’ve included black lines that show how the yield curve has shifted from its previous state.

Due to an improved economic outlook and the prospect of higher inflation, the long end of the yield curve (right side) has moved up substantially, while the left side (where the Fed exerts control) has remained relatively anchored. The result has been a steepening of the slope of the yield curve, which indicates a healthy economy that is capable of handling higher short-term interest rates.
This is one of the primary reasons that the market is both expecting a rate hike, and at the same time, we’re not seeing a sharp negative reaction in equity markets. This time around, the long-end of the yield curve has been leading the way higher, rather than the other way around.
In our current interest rate environment, the Fed has room to raise rates a few times without worrying about drastically flattening the slope of the yield curve. This is a good sign and suggests that investors will take Wednesday’s rate hike in stride, viewing it as another signal of an improving economy.
While higher interest rates and particularly an upward ratcheting federal funds rate have historically swung the pendulum too far, eventually throwing the economy into recession, that time is not now. For at least the short, foreseeable future, higher interest rates can go hand in hand with an improving economy.
The preceding content was an excerpt from Dow Theory Letters. To receive their daily updates and research, click here to subscribe.
….also: Hear Craig Johnson on Stocks, Bonds; Frank Holmes on Gold, Oil
Hear also Jim O’Sullivan on US Economy, Fed Rate Hikes, Market Outlook

-
I know Mike is a very solid investor and respect his opinions very much. So if he says pay attention to this or that - I will.
~ Dale G.
-
I've started managing my own investments so view Michael's site as a one-stop shop from which to get information and perspectives.
~ Dave E.
-
Michael offers easy reading, honest, common sense information that anyone can use in a practical manner.
~ der_al.
-
A sane voice in a scrambled investment world.
~ Ed R.
Inside Edge Pro Contributors

Greg Weldon

Josef Schachter

Tyler Bollhorn

Ryan Irvine

Paul Beattie

Martin Straith

Patrick Ceresna

Mark Leibovit

James Thorne

Victor Adair