
Currency
The low oil price continues to wreak financial havoc on the largest oil producer in the Middle East. While the Mainstream press has published articles forecasting a rebound in Saudi Arabia’s financial outlook, due to higher oil prices this year, it seems like the Kingdom’s problems are just beginning.
In order to make up for falling oil revenues, Saudi Arabia has been liquidating its foreign currency reserves at a pretty good rate over the past two and a half years. I discussed this in my article, Bankrupting OPEC… One Million Barrels Of Oil At A Time. In that article I published this chart:

Due to the rapid oil price decline, Saudi Arabia liquidated 27% of its foreign currency reserves. At its peak, Saudi Arabia held $797 billion in foreign currency reserves. In just two and a half years, Saudi Arabia’s currency reserves declined $258 billion (U.S. Dollars) to $536 billion currently (Dec 2016).
I also published the following chart showing Saudi Arabia’s foreign currency reserves declined in 2016, even as the oil price recovered from a low of $30.7 in January to a high of $53.3 in December:

Now, what’s even more interesting… is that Saudi Arabia’s foreign currency reserves took another BIG HIT in January, by falling $12.5 billion in just one month:
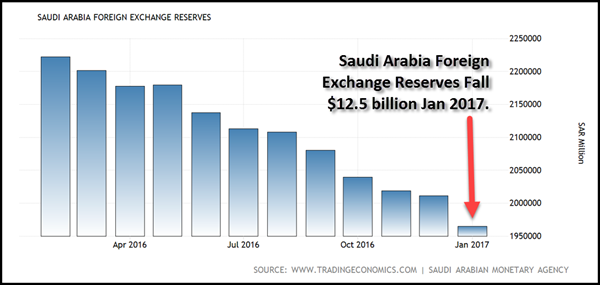
Saudi Arabia’s foreign currency reserves fell from $536.3 billion in Dec 2016, to $523.8 billion in January. The chart displays the figures in Saudi Arabia Riyal. They were converted to U.S. Dollars. This is a pretty good drop in just one month. Moreover, this occurred even as the oil price increased to $54.6 a barrel in January versus $53.3 in December.
I would imagine some would assume that this fall in exchange reserves may have been due to the recent Saudi oil production cut. While it is true that Saudi Arabia has cut oil production, as well as exports, this only accounts for a small portion of the $12.5 billion decline in foreign currency reserves.
For example, according to the Bloomberg article, Saudi Arabia Oil Tanker Tracking Shows Exports Slide In February:
While Saudi Arabia has the ability to store crude — meaning that its exports aren’t perfectly correlated with production — a month-on-month decline in exports would support the country’s assertion it’s cutting back. Exports fell from about 7.16 million barrels a day in January, according to Bloomberg calculations based on industry standard cargo sizes.
Saudi Arabia exported about 7.64 million barrels a day in October, according to figures from the Joint Organisations Data Initiative. Riyadh-based JODI collates data including production and exports directly from countries. Shipments exceeded 8 million barrels a day in both November and December. The deal to cut supply took effect at the beginning of the year.

The article states that Saudi Arabia’s oil exports declined from 8+ million barrels per day in November and December, down to 7.16 million barrels per day in January. If we do some simple math, we have the following:
JAN 2017 = 1 million barrel per day cut x 31 days = 31 million barrels X $54.58 = -$1.7 billion
If we assume that Saudi Arabia was paid spot price of $54.58 for each barrel (they didn’t, they have long-term contracts), then they would have lost $1.7 billion in oil revenue for the 1 million barrel per day cut in exports in January. So, if we subtract the $1.7 billion in lost oil revenues in January from the $12.5 billion in foreign exchange reserve liquidation, there’s a difference of about $10.8 billion.
For whatever reason, Saudi Arabia had to sell off another $12.5 billion of its foreign exchange reserves in January to make up for lost oil export revenue. To make matters even worse, Saudi Arabia To Slash Capital Expenditures by 71%:
With the largest budget shortfall among the world’s 20 biggest economies, Saudi Arabia is planning more austerity measures this year. The kingdom will scrap projects worth more than $20 billion as it comes to terms with cheaper oil.
According to the Saudi government’s bond prospectus obtained by Bloomberg, capital expenditure is expected to fall to $20.6 billion (75.8 billion riyals) this year compared with $70.2 billion (263.7 billion riyals) in 2015. Two years ago, the country’s capital spending was $98.6 billion (370 billion riyals).
Saudi Arabia is in serious trouble if it has to cut its capital expenditures by 71% this year. In addition, the Kingdom is placing its hope on the upcoming Saudi Aramco IPO. Saudi Aramco values its assets at $2 trillion and its five percent initial offering could be worth $200 billion. However, Wood Mackenzie believes Saudi Aramco’s assets are worth much less…. 80% less. From the article linked above:
Now, analysts at Wood Mackenzie have conducted their own study of Saudi Aramco, and came up with a completely different (and much lower) figure. WoodMac puts Aramco’s true value closer to $400 billion, eighty percent less than the Saudi estimate, and it arrived at the figure by considering future demand and the anticipated average price of oil (on which profits will depend), as well as Saudi Aramco’s status as a state-run company.
If I had to choose between these two different asset valuations, I would probably side with Wood Mackenzie. I have read several of their reports and trust their figures over the Saudi’s as they are more objective. Regardless, if the oil price continues to decline, Saudi Arabia will likely have to liquidate more of its foreign currency reserves to fill in the gap from insufficient oil export revenues.
According to the data by the EIA – U.S. Energy Information Agency, Saudi Arabia’s oil export revenues fell nearly 50% from $247 billion in 2014 down to $130 billion in 2015. And the figures for 2016 were even worse. The EIA only has data for the first five months of the year, which reports Saudi Arabia’s oil export revenue was a measly $39 billion. Even though the oil price rebounded towards the end of the year, Saudi Arabia’s oil export revenue was probably less than $110 billion in 2016.
Investors need to keep an eye on the U.S. and global oil industries this year. If we do see continued weakness in the oil price, this could spell BIG TROUBLE for an industry that is the backbone of the global economy.
Check back for new articles and updates at the SRSrocco Report.

Forex Trading Alert originally published on March 8, 2016, 9:32 AM
Earlier today, the U.S. dollar extended gains against its Canadian counterpart as declining crude oil prices pushed the Canadian currency lower. As a result, USD/CAD reached the next resistance zone. Will it stop currency bulls in the coming days?
In our opinion, the following forex trading positions are justified – summary:
EUR/USD: short (a stop-loss order at 1.0735; the initial downside target at 1.0388)
GBP/USD: none, in other words, taking profits off the table is justified from the risk/reward perspective.
USD/JPY: long (a stop-loss order at 111; the initial upside target at 115.43)
USD/CAD: none, in other words, taking profits off the table is justified from the risk/reward perspective.
USD/CHF: long (a stop-loss order at 0.9891; the initial upside target at 1.0180)
AUD/USD: none
EUR/USD


Looking at the daily chart, we see that EUR/USD moved a bit lower, extending yesterday’s losses. Additionally, the Stochastic Oscillator generated the sell signal, which suggests that further deterioration is just around the corner. If this is the case, and the exchange rate declines from here, the first downside target will be the previously-broken upper border of the blue declining trend channel (currently around 1.0497) and the recent lows. If they are broken, we’ll likely see a drop to around 1.0460, where the 76.4% and 78.6% Fibonacci retracements are.
Very short-term outlook: bearish
Short-term outlook: mixed with bearish bias
MT outlook: mixed
LT outlook: mixed
Trading position (short-term; our opinion): Short positions with a stop-loss order at 1.0735 and the initial downside target at 1.0388 are justified from the risk/reward perspective.
GBP/USD


Quoting our Monday’s alert:
(…) Although the pair rebounded slightly on Friday, the size of the move was tiny compared to the earlier decline, which suggests that we may see a test of the recent low or even a drop to the next downside target – the 70.7% Fibonacci retracement at 1.2194. If it is broken, the way to the next support area (created by the 76.4% and 78.6% Fibonacci retracements around 1.2138-1.2157) will be open. At this point, it is worth noting that in this area is also the lower border of the red declining trend channel (marked on the weekly chart), which increases the probability of reversal.
On the daily chart, we see that currency bears pushed GBP/USD lower (as we had expected) and the pair slipped to our next downside targets. Taking all the above into account, we think that this area could trigger a rebound. Therefore, closing short positions (they were opened when GBP/USD was trading around 1.2383) and taking profits off the table is currently justified from the risk/reward perspective.
Very short-term outlook: mixed
Short-term outlook: mixed
MT outlook: mixed
LT outlook: mixed
Trading position (short-term; our opinion): No positions are justified from the risk/reward perspective now.
USD/CAD


Yesterday, we wrote the following:
(…) although USD/CAD moved a bit lower on Friday, currency bears didn’t manage to push the pair lower, which resulted in a consolidation around the January 20 high. Taking this fact into account and the current situation in the medium-term chart, we think that currency bulls will push USD/CAD to around 1.3454, where the next resistance zone (created by the 76.4% and 78.6% Fibonacci retracements) is.
From today’s point of view, we see that the situation developed in line with the above scenario and USD/CAD reached our next upside targets. Taking into account the yellow resistance zone, the 161.8% and 73.2% Fibonacci extensions and the current position of the daily indicators (they are very close to generating sell signals), it seems that the exchange rate could correct the recent upward move in the very near future. Therefore, closing long positions (they were opened when USD/CAD was trading around 1.3190) and taking profits off the table is currently justified from the risk/reward perspective.
Very short-term outlook: mixed
Short-term outlook: mixed
MT outlook: mixed
LT outlook: mixed
Trading position (short-term; our opinion): No positions are justified from the risk/reward perspective now.
Thank you.


The dollar has been one of the biggest contrarian trades I have seen in years. Every time the market is so certain about the direction it will run, it does the exact opposite and often in extreme fashion. In my last weekend update, I noted how we called the multi-year rally off the 2011 lows when the market was expecting the dollar to crash due to all the QE. And, I also noted how the dollar has been moving down after the Fed has raised rates, despite the common expectations that the dollar should rise.
Some days, if you listen really closely, you can almost hear the dollar laughing as it moves “unexpectedly.”
The same has happened with the Chinese Yuan. Recently, China spent 1 trillion US Dollars (a quarter of their FX reserves) over the past 3 years in an attempt to prop up the Yuan. However, the Yuan still lost close to 14% of its value against the USD over this time period. Moreover, our lead analyst of our Forex Service, Michael Golembesky, appropriately advised a short in this market despite the Chinese “intervention.” In fact, Mike and I wrote several public articles on this potential trade. And, as you know, he has been quite successful in that trade, even though most others in the market would not consider such a trade in the face of the unprecedented action by the Chinese government.
This past week, immediately after the Fed Chairman noted in a speech that it is likely they will raise rates at the upcoming March meeting, we saw the dollar drop lower. And, if you remember my article last weekend, I noted that I see a multi-year top forming in the dollar no matter what the Fed does, and warned you that the dollar can certainly head lower even in the face of the Fed raising rates. While I certainly can be wrong in my analysis and expectations, as I am human, I found it quite interesting that the dollar reacted exactly in the opposite manner in which everyone would expect on Friday, yet again.
And, if these examples make you wonder if any central bank has any real control over the market, then you are finally thinking for yourself in an intellectually honest manner rather than accepting the current “market-think.” This should truly make you realize that “manipulation” is not what moves the market in its larger trends.
As far as the short term, the market still has not made it abundantly clear that a long-term top has finally been struck for wave (3). The current rally has been quite overlapping, but still leaves the potential open to the market making a higher high in the 104-105 region in an ending diagonal. We still would need to break below 100.41 to invalidate that potential. But, I suspect that the market has completed wave (3), since we have struck the long-term trend line, as well as long term target we set years ago.
See charts illustrating wave counts on the U.S. Dollar Index (DXY).
Avi Gilburt is a widely followed Elliott Wave technical analyst and author of ElliottWaveTrader.net (www.elliottwavetrader.net), a live Trading Room featuring his intraday market analysis (including emini S&P 500, metals, oil, USD & VXX), interactive member-analyst forum, and detailed library of Elliott Wave education.
 This year will prove decisive for the eurozone. Between March and September, the Netherlands, France, and Germany will hold general elections whose outcomes will help determine the future of Europe’s common currency. Italy, too, may hold a vote by the end of the year. In light of the uncertainty that awaits, the eurozone’s major players are making moves to brace themselves for whatever the future brings.
…continue reading this fascinating Strafor analysis HERE
…related from Michael Campbell:
T he rumors are flying in France and the conservative candidate Fillon denounces a probe now into corruption. Fillon now vows to fight on to the end – not good for he has placed himself above the country making this personal. His top aide just resigned and Fillon was summoned to appear before investigators on March 15 to be placed under formal investigation over allegations that he paid his wife hundreds of thousands of euros of public money to do very little work if any at all.
 This corruption scandal of career politicians in France is opening the door for Le Pen and now we have France, Netherlands, Spain, Italy, and Greece all moving toward exiting the EU. With the ECB holding 40% of the national debts of the Eurozone countries, it looks like the Euro is on borrowed time. The outcome is simply inevitable.
This European crisis is pushing up the Dow and capital flows from smart money is starting to vacate Europe headed into the Dow for that is where “big money” always hides. Of course, domestically, they are attributing this as always to just local issues now praising Trump’s speech as optimistic. Trump’s speech was widely praised for its positive tone outside of mainstream media, which is increasingly becoming irrelevant in the real world.
Meanwhile, if gold closes above 1242 today, it can also rally again, but it avoided the Monthly Bullish Reversal so it is still showing there is inherent risk just yet.

-
I know Mike is a very solid investor and respect his opinions very much. So if he says pay attention to this or that - I will.
~ Dale G.
-
I've started managing my own investments so view Michael's site as a one-stop shop from which to get information and perspectives.
~ Dave E.
-
Michael offers easy reading, honest, common sense information that anyone can use in a practical manner.
~ der_al.
-
A sane voice in a scrambled investment world.
~ Ed R.
Inside Edge Pro Contributors

Greg Weldon

Josef Schachter

Tyler Bollhorn

Ryan Irvine

Paul Beattie

Martin Straith

Patrick Ceresna

Mark Leibovit

James Thorne

Victor Adair