
Currency
The US dollar has now closed lower for 6 weeks in a row which is testing the patience of the bulls. This week the price action cracked the top rail of the horizontal trading range which is a negative, but not confirmation yet the trend has reversed down. There are several more layers of support that will need to be hit before I throw up the white flag and surrender to the bears.
This first chart is just a simple daily line chart which shows the US dollar closed just below the top rail today (friday) at 99.84.


Forex Trading Alert originally published on Feb 2, 2017, 8:14 AM
Earlier today, the USD Index extended losses against the basket of the major currencies as yesterday’s Fed statement didn’t give clear signal on the timing of its next rate hike. How did this drop affect the technical picture of EUR/USD, USD/CAD and AUD/USD?
In our opinion, the following forex trading positions are justified – summary:
EUR/USD: none
GBP/USD: none
USD/JPY: none
USD/CAD: none
USD/CHF: none
AUD/USD: none
EUR/USD


Quoting our previous alert:
(…) EUR/USD reached the yellow resistance zone, approaching the 50% Fibonacci retracement. What’s next? Taking into account the fact that the proximity to this resistance area was enough to trigger a pullback in the previous week, it seems that we’ll see a similar price action and a verification of a breakout above the lower border of the blue rising trend channel in the very near future.
Looking at the daily chart, we see that the situation developed in tune with the above scenario and EUR/USD verified the earlier breakout above the lower border of the blue rising trend channel. What does it mean for the exchange rate? We believe that the best answer to this question will be the quote from our yesterday’s commentary:
(…) we should keep in mind that as long as there is no drop below this support another upswing and a test of the upper border of the yellow resistance zone is likely – especially when we factor in the fact that the buy signals generated by the weekly and daily indicators are still in play.
Very short-term outlook: mixed with bullish bias
Short-term outlook: mixed
MT outlook: mixed
LT outlook: mixed
Trading position (short-term; our opinion): No positions are justified from the risk/reward perspective.
USD/CAD


On Friday, we wrote the following:
(…)Although the pair rebounded in recent days, the exchange rate still remains under the previously-broken lower purple resistance line, which suggests that the current upswing could be nothing more than a verification of the earlier breakdown. Additionally, (…) the sell signals generated by the weekly indicators remain in place suggesting lower values of USD/CAD in the coming days. If this is the case and the exchange rate declines from here, (…), it seems that the exchange rate will move lower once again and test the lower border of the blue rising tend channel (seen on the daily chart) in the coming days.
On the daily chart, we see that currency bears pushed USD/CAD lower (as we had expected) and the pair slipped to our downside target. Although the exchange rate rebounded yesterday, the previously-broken lower border of the purple declining trend channel encouraged currency bears to act, which resulted in a pullback. Earlier today USD/CAD extended losses, which suggests a re-test of the blue support line. At this point it is worth noting that the Stochastic Oscillator generated a sell signal, which suggests that the bears could try to push the pair even lower. If this is the case and the exchange rate drops under this support line, the next downside target for the sellers will be around 1.2893, where the 61.8% Fibonacci retracement based on the entire May-December upward move is.
Very short-term outlook: bearish
Short-term outlook: mixed
MT outlook: mixed
LT outlook: mixed
Trading position (short-term; our opinion): No positions are justified from the risk/reward perspective.
AUD/USD


Looking at the daily chart, we see that AUD/USD broke above the upper border of the blue consolidation earlier today, which means that our Tuesday’s commentary on this currency pair is up-to-date also today:
(…) taking into account the buy signal generated by the Stochastic Oscillator, it seems that currency bulls will try to push the pair higher in the coming days. If this is the case, and the exchange rate breaks above the upper border of the consolidation, we’ll see not only a test of the recent highs, but also an increase to the resistance zone created by the 76.4% and 78.6% Fibonacci retracement levels (around 0.7629-0.7643). If this area is broken, the next target will be around 0.7677, where the size of the upward move will correspond to the height of the blue consolidation.
Finishing today’s commentary please keep in mind that as long as there are no sell signals further improvement is likely. Therefore if AUD/USD climbs above 0.7677, the next upside target will be the yellow resistance zone marked on the weekly chart.
Very short-term outlook: bullish
Short-term outlook: mixed
MT outlook: mixed
LT outlook: mixed
Trading position (short-term; our opinion): No positions are justified from the risk/reward perspective.
Thank you.
….related: Weaker US$ Could Send Gold & Gold Stocks to Higher Targets

 The dollar unraveled in January and some see more declines in its future
On Jan. 17, currency traders pushed the dollar lower after Trump expressed concern about the strength of the currency, describing it as “too strong,” considering where currencies like China’s yuan USDCNY, +0.0058% and the Japanese yen USDJPY, -0.69% were trading. Yesterday, Trump’s National Trade Council head, Peter Navarro, in an interview with the Financial Times (paywall), sparked a sharp rise in the euro USDEUR, -0.3446% versus the dollar.
The action prompted Steve Barrow, currency and fixed-income analyst at Standard Bank in a Wednesday note to forecast that the roller-coaster ride for the buck would likely end with greenback significantly lower at the end of Trump’s tenure in the White House. Barrow predicts a 10% near-term rise for greenback followed by “a multiyear downtrend that sees this entire rise, and much more, reversed as we head towards the next election.”
….related: Trump is waving adios to the longstanding ‘strong dollar policy’

Gold has underperformed both in nominal and real terms. Last week it formed a bearish reversal in nominal terms and against foreign currencies. However, the good news for bulls is the US Dollar Index lost support at 100, due to the Trump administration’s tough talk against Germany (and the Euro). Couple that with no movement from the Fed and the greenback should continue its decline, thereby juicing the current rebound in Gold and especially gold stocks.
Take a look at the daily candle charts in the image below. We plot the US Dollar index, the Dollar/Yen cross and the 10-year Treasury yield. The US Dollar index has a potential measured downside target of 97 which happens to coincide with a confluence of moving average support. Dollar/Yen has not broken its corrective lows yet but if it does it would strengthen the odds the US Dollar index falls to 97. Meanwhile, the 10-year yield has some more room to fall if its correction were to continue. In short, lower levels on all these charts is short-term bullish for precious metals.
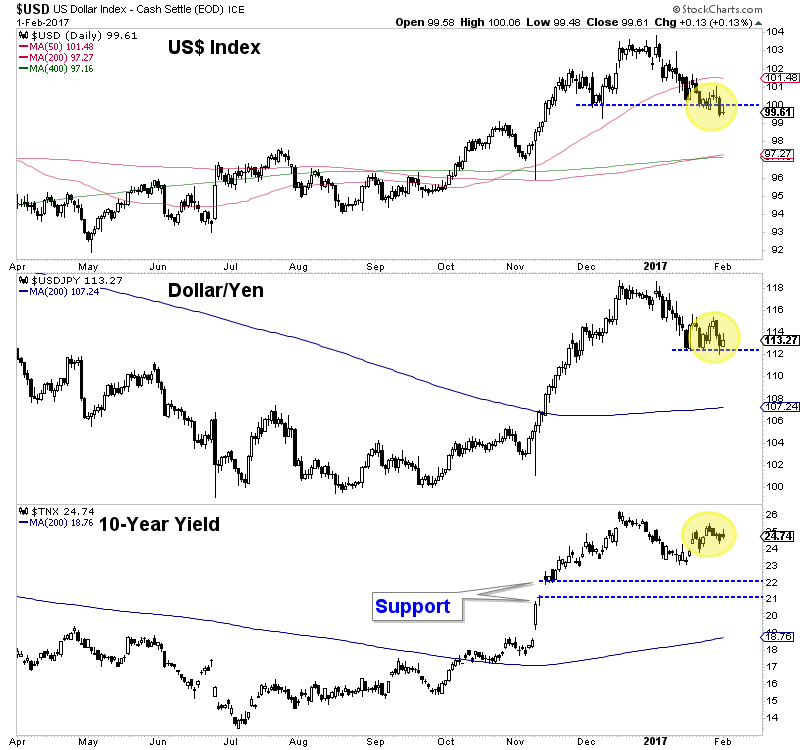
US$, US$/Yen, 10-Year Yield
The daily candle chart below shows GDXJ and GDX. The 200-day moving average has held GDXJ but it has a great chance to continue its rally up to $40-$41. GDX could reach $25-$26.
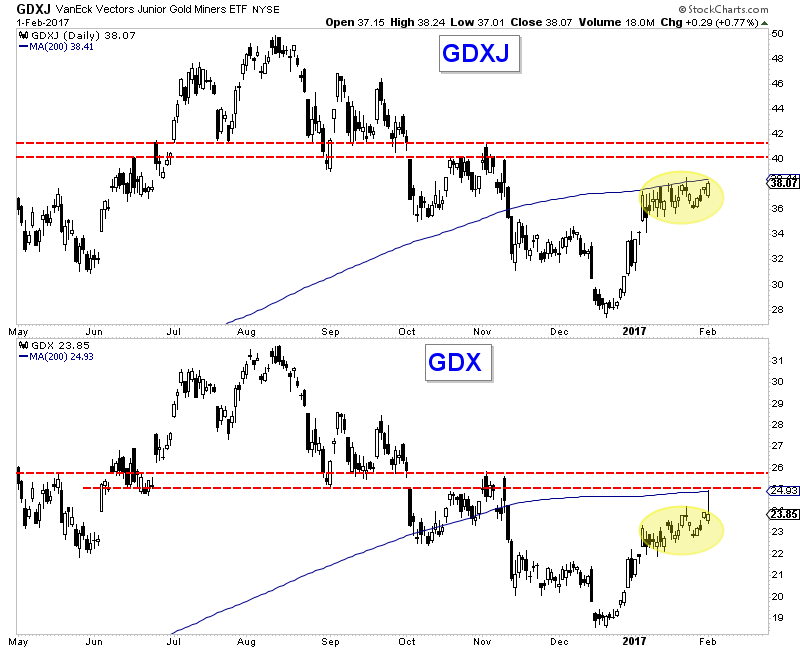
GDXJ, GDX Daily Candles
Take a look at a weekly chart and you will notice the significance of those aforementioned targets. The bar weekly charts of GDX and GDXJ are shown below. GDX $26 and GDXJ $41 mark the strongest resistance moving forward. Those levels have been tested 8 times in the past four years compared to the 2013 and 2016 highs which have been tested only 3 times. It’s unlikely the miners break resistance ($26 and $41) on the first try.
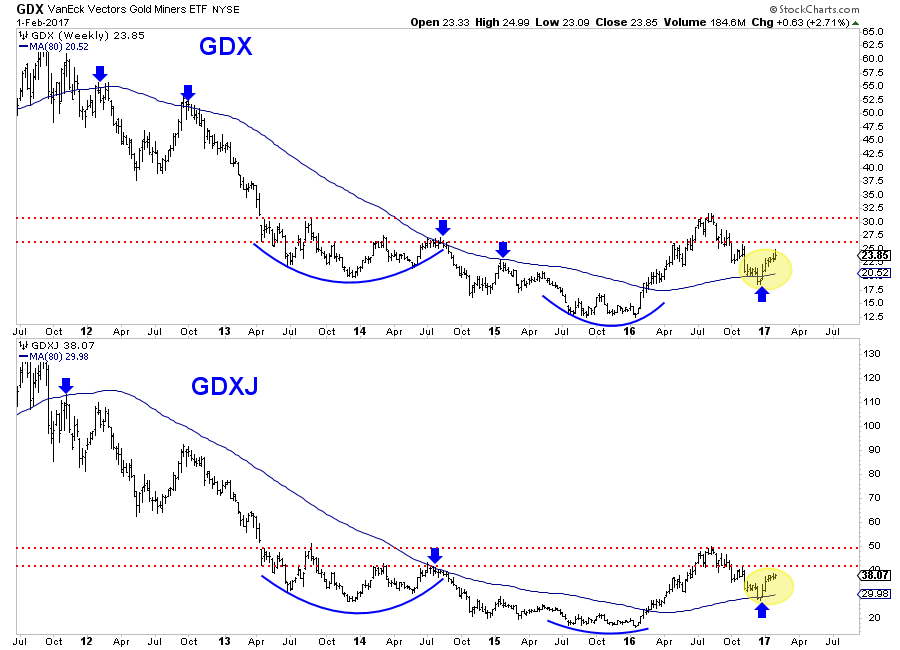
GDX, GDXJ Weekly
The miners continue to lead as they are on the cusp of higher highs in this recovery while Gold is further away from breaking its resistance at $1220. As we noted in our last missive, a pullback from resistance (the upside targets) is likely. The question though is will the pullback be something bullish or will it evolve into a multi-month correction? We have accumulated a number of juniors gradually but are maintaining some cash in advance of the next correction.
Jordan Roy-Byrne, CMT, MFTA
…related: Bitcoin Investing: How to Safely Own “Digital Gold”
Jordan@TheDailyGold.com – For professional guidance learn more about our premium service

 Endorsed by a large portion of the investing community now, bitcoin has emerged as a legitimate alternative to gold for hedging your portfolio. If you have never heard of bitcoin, use this article to find out if it’s a viable investment for your portfolio.
Here’s a quick quiz for readers: what was the top performing currency in 2016?
The answer – surprising to many – is the digital currency Bitcoin, which was created in 2009.
It more than doubled its value last year, rising 126%. Its nearest rival was the Brazilian real, which rose by a mere 21%.
Bitcoin – often called digital gold – is currently priced at about $920. It opened this year with a bang, surpassing the $1,000 level for the only the second time ever. It hit its all-time high in December 2013 at $1,156.06.
2016 was the second year in a row that the return of Bitcoin topped that of all other asset classes – stocks, bonds, currencies, and commodities.
What is behind the rise to prominence of this cryptocurrency?
….also:
SWOT Analysis: The Dollar’s Future and What That Means for Gold

-
I know Mike is a very solid investor and respect his opinions very much. So if he says pay attention to this or that - I will.
~ Dale G.
-
I've started managing my own investments so view Michael's site as a one-stop shop from which to get information and perspectives.
~ Dave E.
-
Michael offers easy reading, honest, common sense information that anyone can use in a practical manner.
~ der_al.
-
A sane voice in a scrambled investment world.
~ Ed R.
Inside Edge Pro Contributors

Greg Weldon

Josef Schachter

Tyler Bollhorn

Ryan Irvine

Paul Beattie

Martin Straith

Patrick Ceresna

Mark Leibovit

James Thorne

Victor Adair