
Currency
Quotable
“Well, you can just stop and think of what could happen if anybody with a decent system of government got control of that mainland. Good God.… There’d be no power in the world that could even—I mean, you put 800 million Chinese to work under a decent system… and they will be the leaders of the world.”
― Henry Kissinger, On China
Commentary & Analysis
Dollar Retrospective Chart 1971-2016: Next Major Cyclical Driver?
Here’s a retrospective and, hopefully, some perspective on the drivers of the long-term trends in the US dollar index in the era of free-floating after President Nixon closed the gold window on August 15th 1971 and rendering the Brenton Woods system to the dustbin of history. I have added the major macro (blue) events and more specific triggers (maroon) that led to multi-year trend changes; i.e. bull and bear markets, in the dollar.
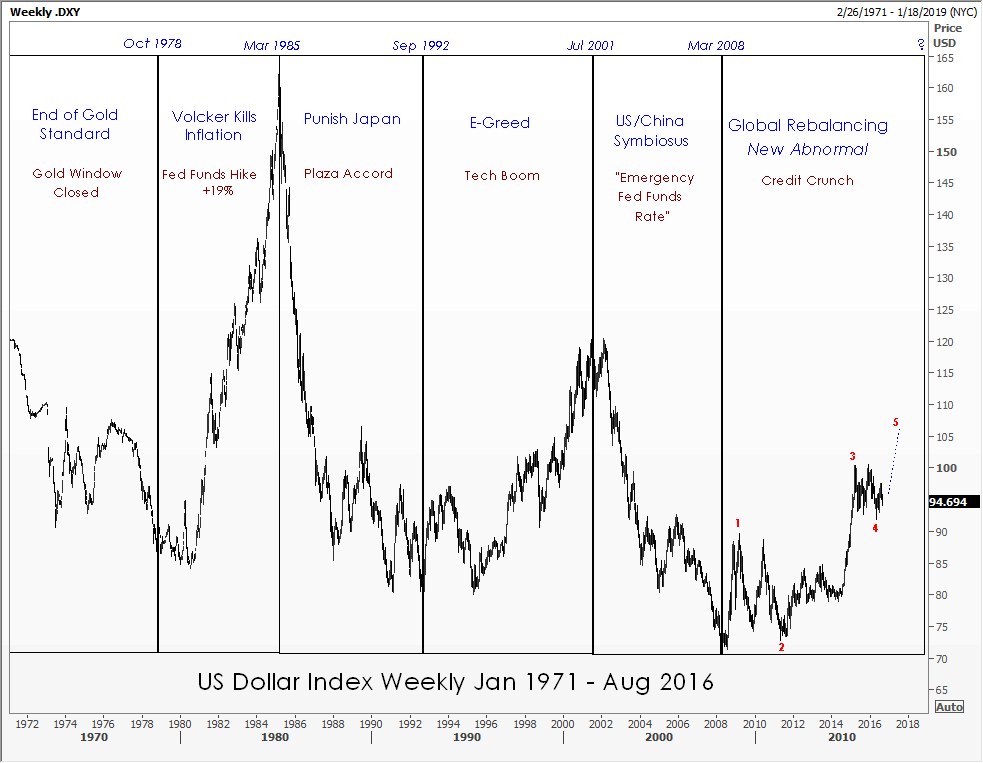

We started following this US dollar index about a year or so ago which has a more equal weighting of different currencies than the $USD. Even though I don’t post it much this Alternative US dollar index has some very interesting Chartology on it which may be giving us an important clue as to the intentions of the Dollar.
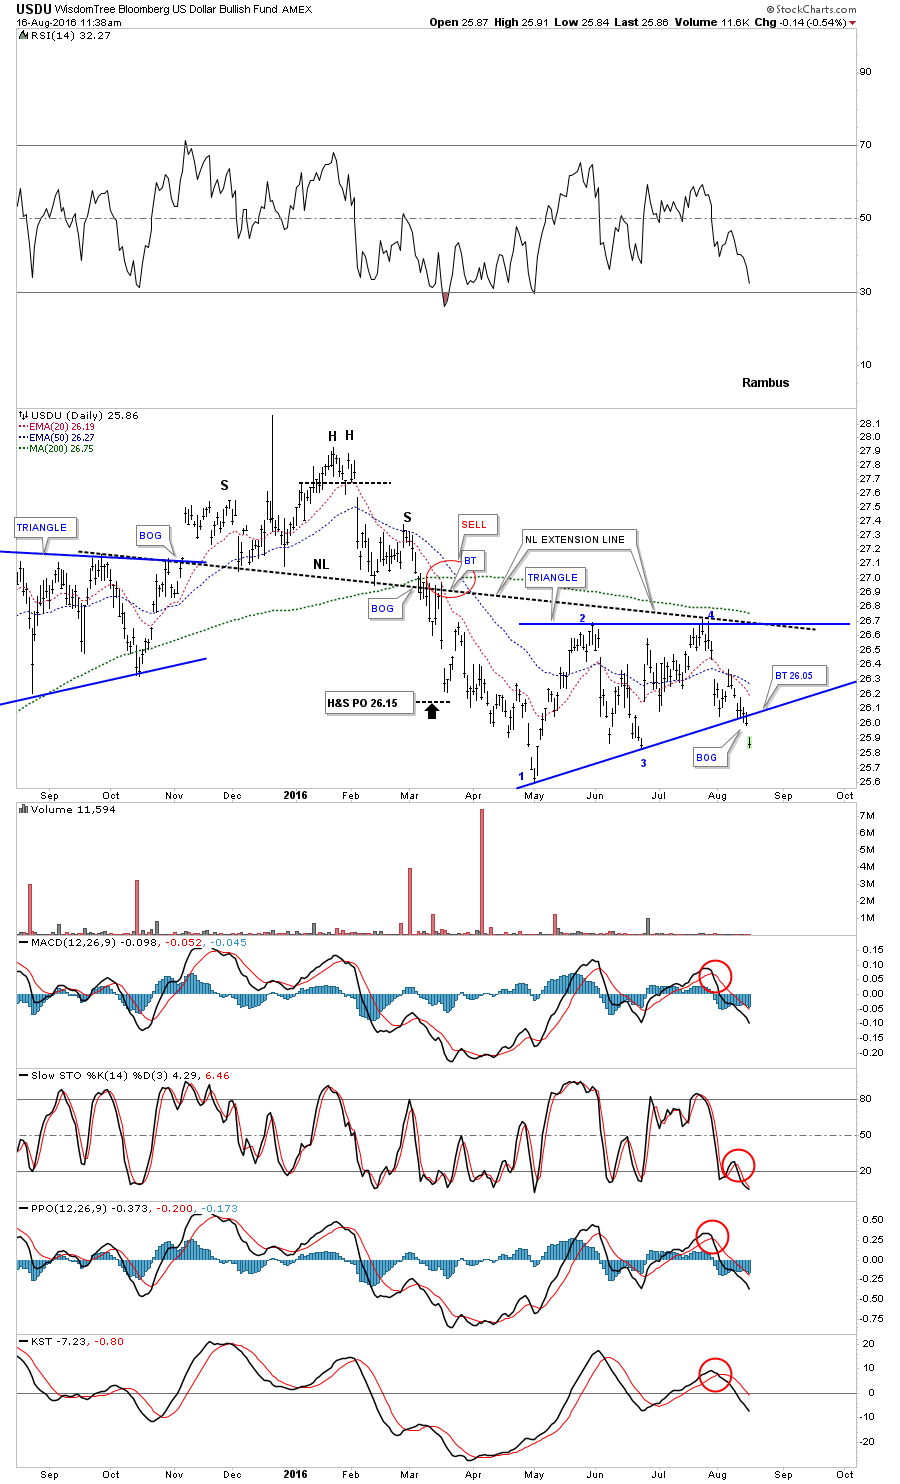
If you recall the Standard US dollar index ($USD) was testing a major inflection point in May around the 92 area earlier this year. It did finally bottom but left some unfinished business behind. This is the daily chart I was following at the time for the USDU which shows the H&S top in place and the decline that took the price action down to the low at the 25.50 area. From that low the USDU began a decent rally but couldn’t trade above the neckline extension line at reversal point #2 before the bears took charge again. The bulls were able to stop the decline at reversal point #3 and a laborious rally took the USDU back up to the top of the trading range where the neckline extension line came into play again along with the 200 day moving average.
Reversal point #4 started the next decline back down to the bottom rail of what we can now call a triangle that has four completed reversal points when the price action hit the bottom rail recently. The bulls were able to only put in a modest rally over next four days when the bears took charge again. As you can see, yesterday the bears were able to break the bottom rail of the blue triangle and today that was followed by a large gap down. When you’re following a well defined chart pattern and you see a gap over an important trendline that generally signals the pattern is finished building. It’s never 100% but generally that is a good sign.
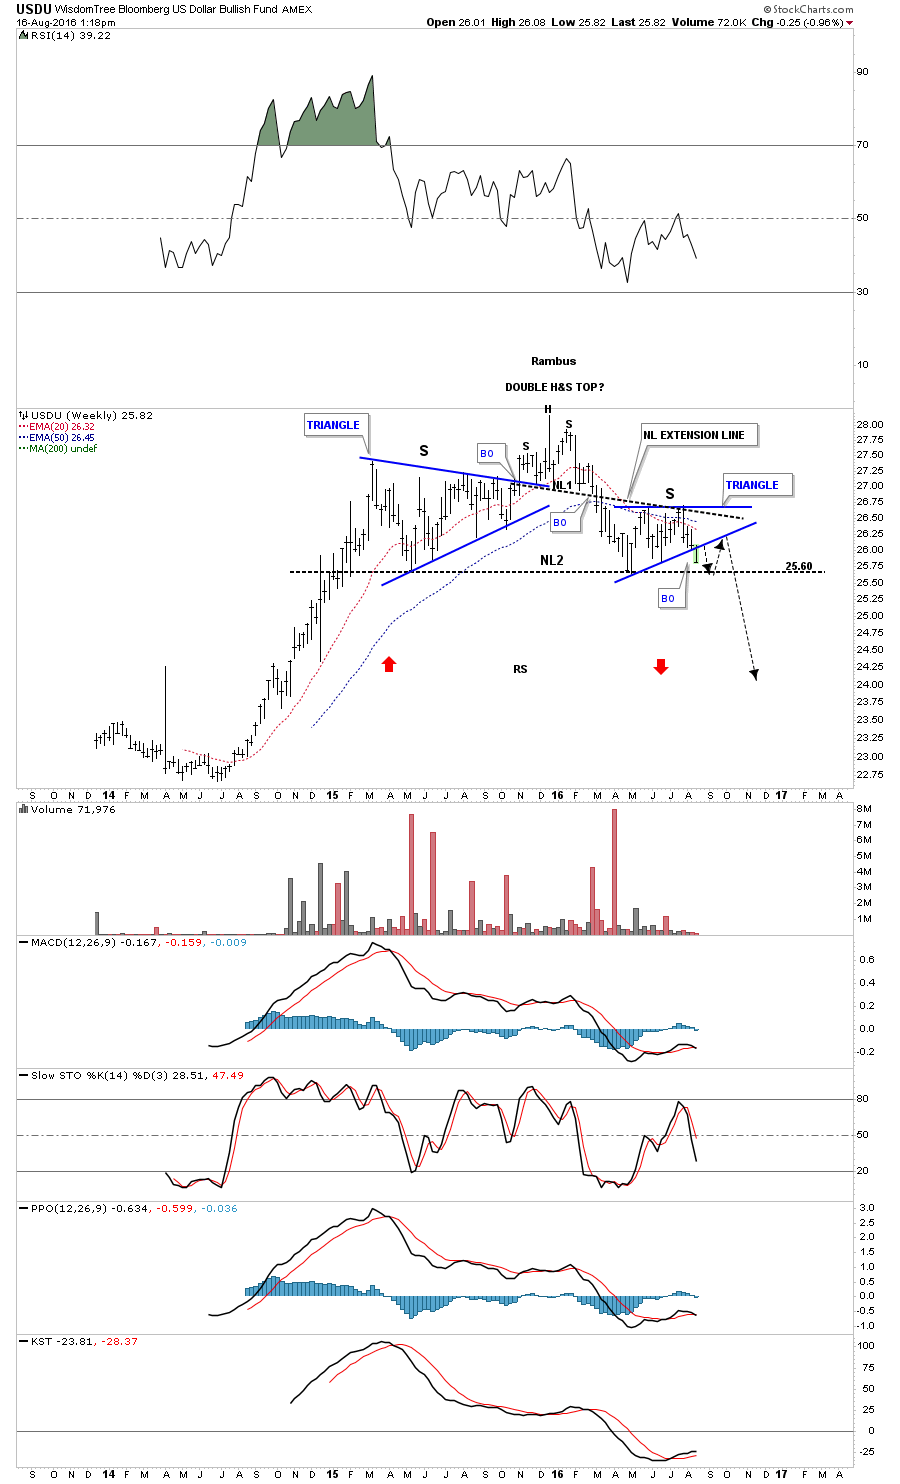
As always it’s important to put the consolidation pattern in perspective to see how it fits into the bigger picture. The weekly chart below shows the potential of what might be happening. As you can see the blue triangle is breaking down this week which may very well be the right shoulder of a much bigger H&S reversal pattern with the big neckline #2 being part of a double H&S top.
The next thing we’ll be watching very closely is how the price action interacts with big neckline #2. There is a good possibility that we could see a ping pong move between NL# 2 and the bottom rail of the blue triangle consolidation pattern as shown by the black arrows. That’s what I would expect to happen but there is no way to know ahead of time. So now we can watch the price action and let it tell us what it wants to do by the way it trades between the neckline and the bottom rail of the blue triangle. If the bears are really in charge and the bulls are extremely weak then we could see a breakout gap below neckline #2. At least we have something concrete to work with now.
One last note on the weekly chart below. I’ve added two red arrows that shows how this index could reverse symmetry back down if this big H&S top plays out. How the price action went up is often how it comes back down over the same area when there was a strong move with small or no consolidation patterns that formed. Stay tuned. If this pattern plays out we could be witnessing a large trend reversal in the most important chart on the planet .
….related: Faber Warns of A Currency Collapse
 We have already figured out that, faced with the choice between doing “helicopter money” and allowing a deflationary implosion to occur, those in power will elect the former, because it buys them more time by keeping the system limping along for longer, and we have now arrived at the stage where it will be one or other. The market has already figured it out too, which is why gold and silver have started a new bullmarket.
…related: Faber Warns of A Currency Collapse

IN THIS INTERVIEW:
– Ahead: a crisis worse than 2008 ►0:54
– Young adults will earn less than their parents and die with less than their parents ►2:56
– How to weather the hard times ahead ►7:41
– How much gold is enough? ►11:01
– What form of precious metals is best? ►13:27
– U.S. presidential race ►15:12
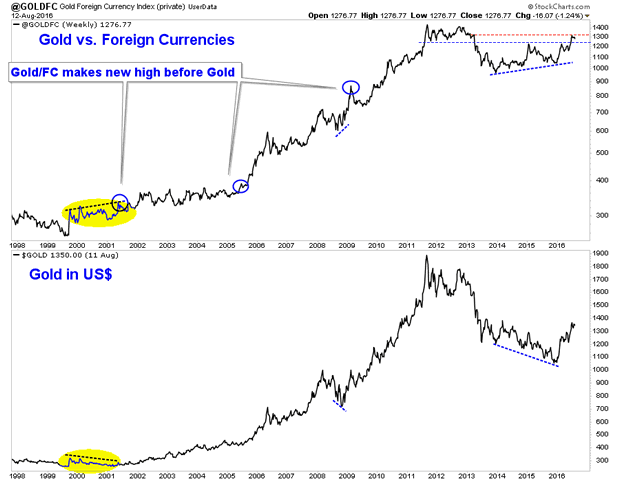
It is the dog days of summer. The metals are trading below their recent highs while the miners continue to be on the cusp of their next leg higher. In any event we remain bullish as we expect the next big move to be higher not lower. One reason, among many is Gold remains strong against foreign currencies and that often is a leading indicator for the sector at large. This is something we track often and we wanted to provide an update during the slowest period of the year.
In the chart below we plot Gold against foreign currencies and Gold in normal, US$ terms. To be clear Gold against foreign currencies (Gold/FC) is Gold against the currency basket that comprises the US$ index. Since the new millennium Gold/FC has been an excellent leading indicator for the sector. Note that Gold/FC has made new highs ahead of Gold and made positive divergences before the three most important lows of the past 16 years (2016, 2008, 2001). In fact, the action from 2014-2015 shows strong similarities to 1999-2000. Moreover, note that at its peak a few weeks ago, Gold/FC was within 8% of its all time high. That is the equivalent of nearly $1750/oz in US$ terms.
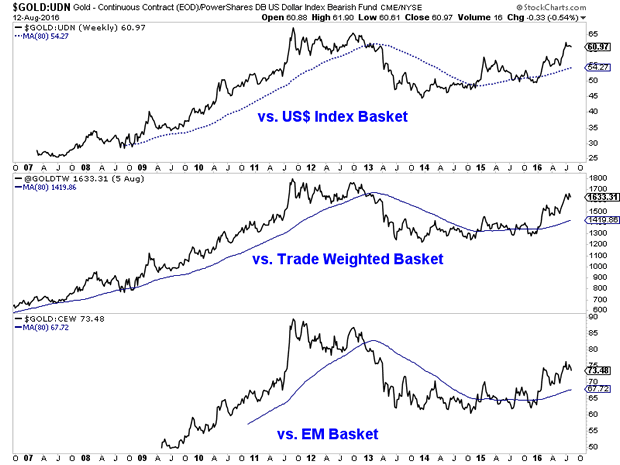
In the next chart we look at different iterations of Gold against foreign currencies. The top plot is the same version shown above while the middle plot shows Gold against the US$ trade weighted basket. The bottom plot shows Gold against emerging market currencies. In every case Gold remains firmly in bull market territory and stronger than Gold in US$’s.
Tracking Gold’s performance against foreign currencies is essential as we can glean quite a bit more information about what is really going on in the market. Many newsletters purporting to be analysts fear monger over the stability of the US$ as a reason for people to buy Gold. However, note that the US$ index is essentially flat compared to 10 and 20 years ago while Gold denominated in any and every currency is much higher.
In other words, if Gold is going up only because of a falling US$, that is a US$ bear market, not a Gold bull market. A Gold bull market is Gold rising against the majority of currencies. In the same vein, a Gold bear market is Gold falling against the majority of currencies. The charts show that actually ended well before the final low at the end of 2015.
On the mining side, most Gold and Silver comes from outside of the USA and many (but not all) companies are exposed to foreign or local currencies and not the US Dollar. Many companies in Canada and Australia bottomed a full year ahead of the sector because the Gold price in those currencies was very strong (even though Gold in US$ had yet to bottom).
Summing it up, Gold’s strength in foreign currencies confirms its global bull market status and provides a hint that more gains for Gold in US$ terms are likely ahead. We view any weakness in the weeks ahead as a buying opportunity.
….consider Jordan’s premium service
….related: Larry Edelson on: Gold Crash Coming?

-
I know Mike is a very solid investor and respect his opinions very much. So if he says pay attention to this or that - I will.
~ Dale G.
-
I've started managing my own investments so view Michael's site as a one-stop shop from which to get information and perspectives.
~ Dave E.
-
Michael offers easy reading, honest, common sense information that anyone can use in a practical manner.
~ der_al.
-
A sane voice in a scrambled investment world.
~ Ed R.
Inside Edge Pro Contributors

Greg Weldon

Josef Schachter

Tyler Bollhorn

Ryan Irvine

Paul Beattie

Martin Straith

Patrick Ceresna

Mark Leibovit

James Thorne

Victor Adair