
Currency
 Dollar bears were installed with inspiration following the weak U.S. productivity data, which created a cloud of uncertainty over the likelihood of the Federal Reserve raising U.S. rates in 2016. U.S. productivity has fallen for the third consecutive quarter, which may simply heighten fears of a deceleration in Q3 GDP consequently obstructing efforts taken by the Fed to break the trend of central bank caution. Although July’s blockbuster nonfarm payrolls of 255,000 initially bolstered expectations of a probable rate hike as close as September, investors have returned to normality with the CME FedWatch tool displaying a 40.6% probability of a December hike. Overall, despite yesterday’s soft productivity data, sentiment still remains somewhat bullish towards the dollar and the encouraging outlook towards the U.S. economy could provide a foundation for bulls to send the U.S. Dollar Index higher.
Stock market rally cools
…also: Martin Armstrong: Europe on the Brink of Complete Chaos?

The US Dollar Index price action has played out exactly as forecast in recent subscriber analysis. That analysis reduced the price expectation for the bear rally and the recent high of 97.62 was a bingo hit.
Let’s review the technicals beginning with the daily chart.
US Dollar Index Daily Chart
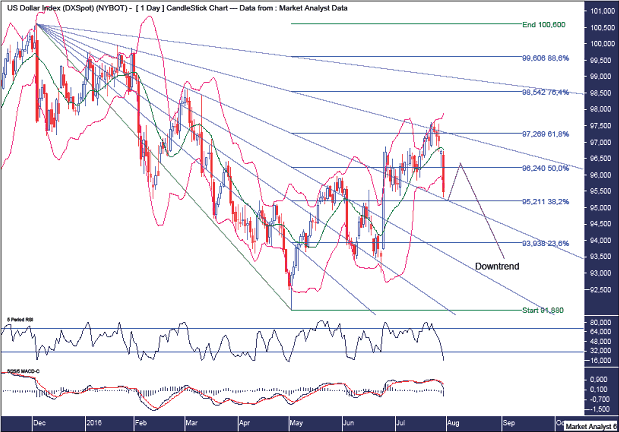 Previous analysis forecast this bear rally to clip the 61.8% Fibonacci retracement level of 97.26. Nice.
Previous analysis also forecast this bear rally to top out around resistance from the 76.4% angle. Nice again.
Price is now back down near the 61.8% angle and I expect some very temporary support to come in shortly and lead to a weak little rally. This rally should provide bears one last opportunity to get short before a big whoosh south commences.
The Bollinger Bands show price is back at the lower band and any subsequent rally will struggle to get back to the middle band in my opinion.
The RSI is looking very weak while the MACD indicator has just made a bearish crossover.
Let’s move onto the monthly chart.
US Dollar Index Monthly Chart
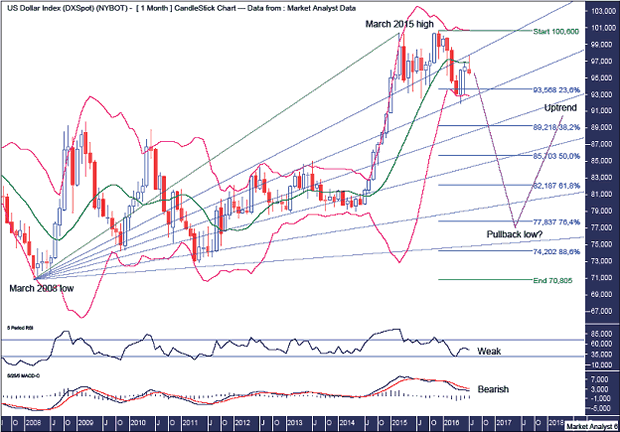
Previous analysis forecast this bear rally to top out around resistance from the 23.6% Fibonacci Fan angle and that is exactly what has occurred. I favour the final bear market low to be down at least at the 76.4% angle and possibly even the 88.6% angle.
The projection for pullback low remains unchanged being between the 76.4% Fibonacci retracement level at 77.83 and the 88.6% level at 74.20.
The Bollinger Bands show the middle band providing resistance as expected and laid out in previous analysis.
The RSI is weak while the MACD indicator is bearish.
Let’s wrap up the analysis by reacquainting ourselves of the even bigger picture using the quarterly chart.
US Dollar Index Quarterly Chart
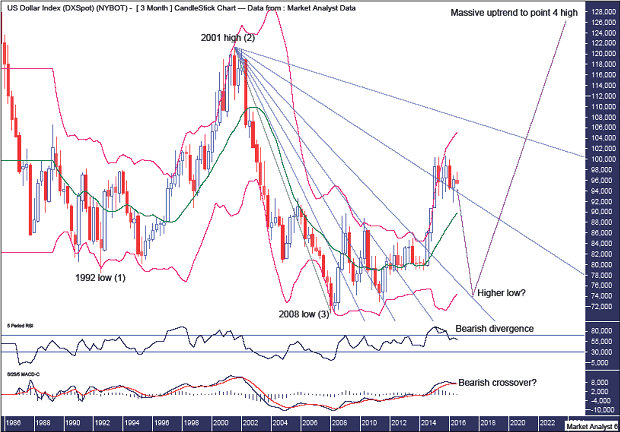
I have shown this chart before and it lays out my expectation of a massive 5 point broadening low in process with points 1 to 3 already in place. Price is now on its way to a point 4 high but I expect some volatile price action before that then.
The Bollinger Bands show price has left the upper band and next stop appears to be the middle band with the final low, a higher low, to be around support from the middle band.
I have drawn a Fibonacci Fan from the 2001 high to 2008 low. Price has recently been flirting above the 76.4% angle but I believe this a false dawn and price is set to break below and then get smashed down to the 61.8% angle to set up the higher low.
I expect this quarterly candle to form a bearish outside reversal candle which means price will have to take out the previous quarter’s low of 91.88
The RSI shows a bearish divergence while a bearish crossover in the MACD indicator looks imminent.
Summing up, I expect price to get absolutely creamed over the next 12 months or so with the bears set for a big feast!
http://www.thevoodooanalyst.com
related:
 A moderate stimulus package from the Bank of Japan overnight got the final trading day of the week off to a disappointing start, leaving traders to look towards the large number of earnings and data releases today to pick them up again.
Days like today once again make you question whether the central banks really are reaching the limits of what the markets consider to be effective monetary stimulus tools. With interest rates already negative and government bond purchases at or near the limit of what is feasible, central banks have had to pursue other unconventional tools which have failed to get the markets too excited.

Yesterday, the greenback moved sharply higher against its Canadian counterpart as the price of crude oil slipped to the lowest level since late Apr, weighing on the Canadian currency. Thanks to these circumstances, USD/CAD broke above important resistance zone and closed the day above it. Will we see further rally in the coming days?
In our opinion the following forex trading positions are justified – summary:
- EUR/USD: short (a stop-loss at 1.1236; initial downside target at 1.0708)
- GBP/USD: short (a stop-loss at 1.3579; initial downside target at 1.2519)
- USD/JPY: none
- USD/CAD: none
- USD/CHF: none
- AUD/USD: none
EUR/USD
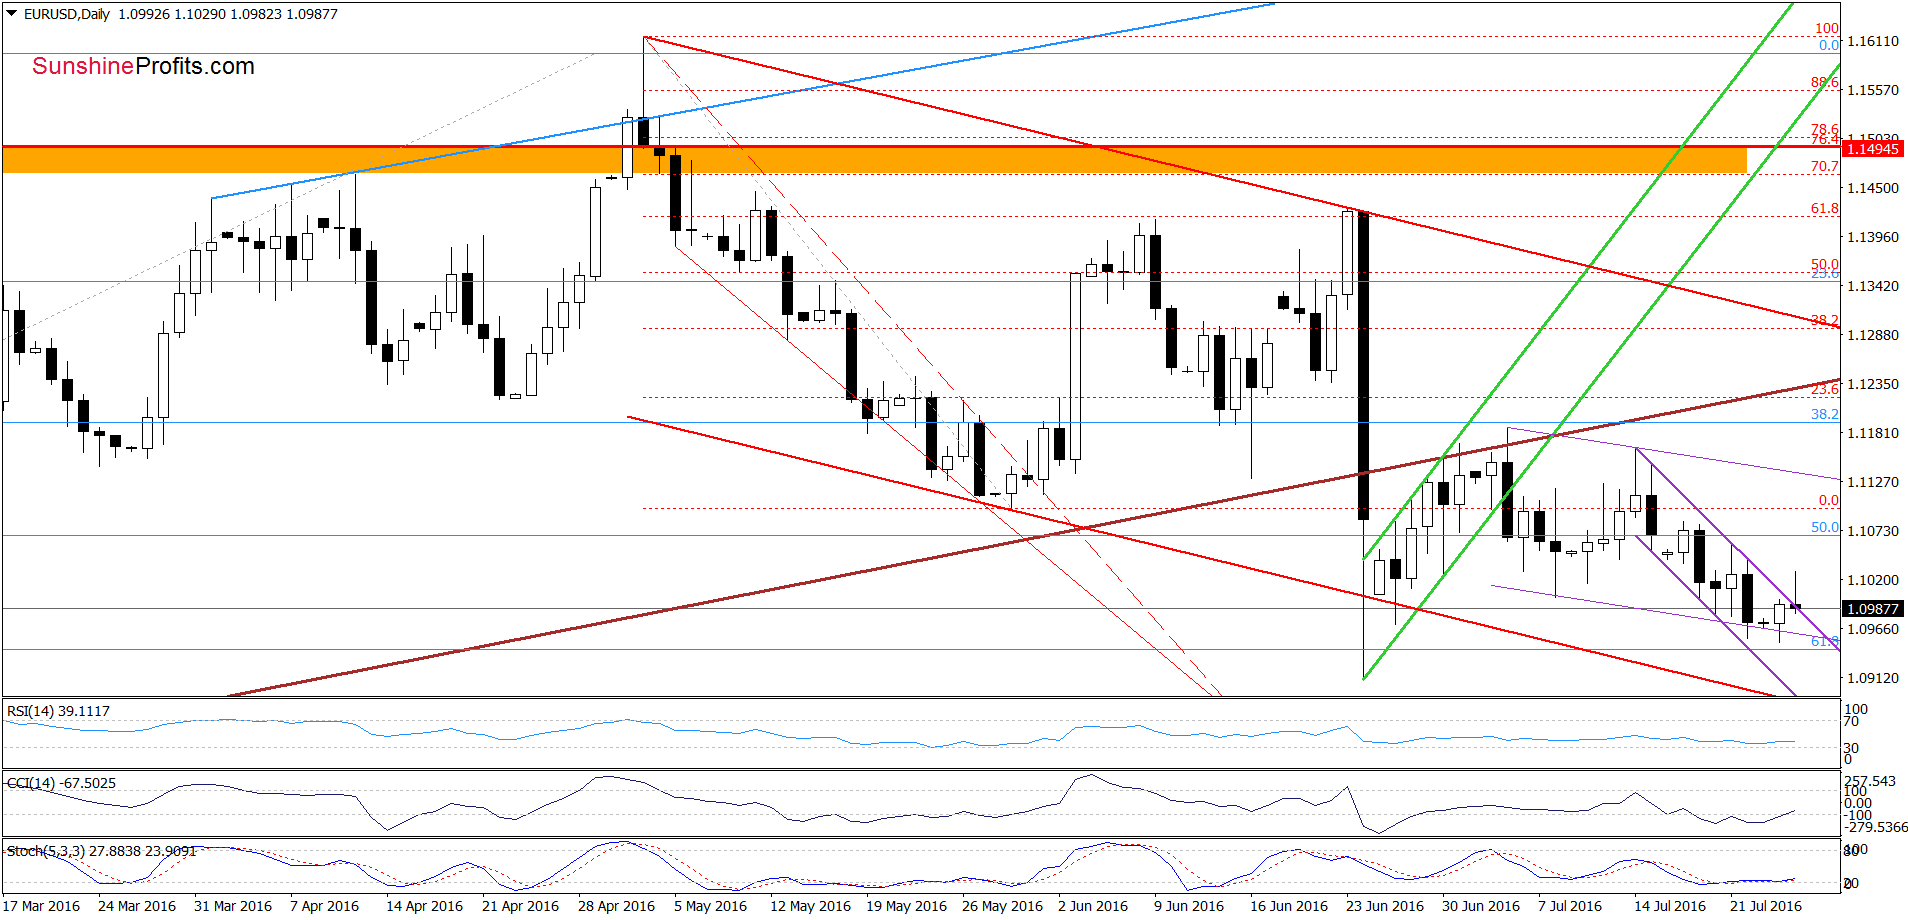
Looking at the daily chart, we see that although EUR/USD broke above the upper border of the purple declining trend channel earlier today, this improvement was temporary and the exchange rate reversed and declined, invalidating earlier breakout. This is a negative signal, which suggests further deterioration. However, this scenario will be more reliable if we see a daily closure under the upper line of the formation.
Having said the above, let’s check whether anything changed on the medium-term picture or not.
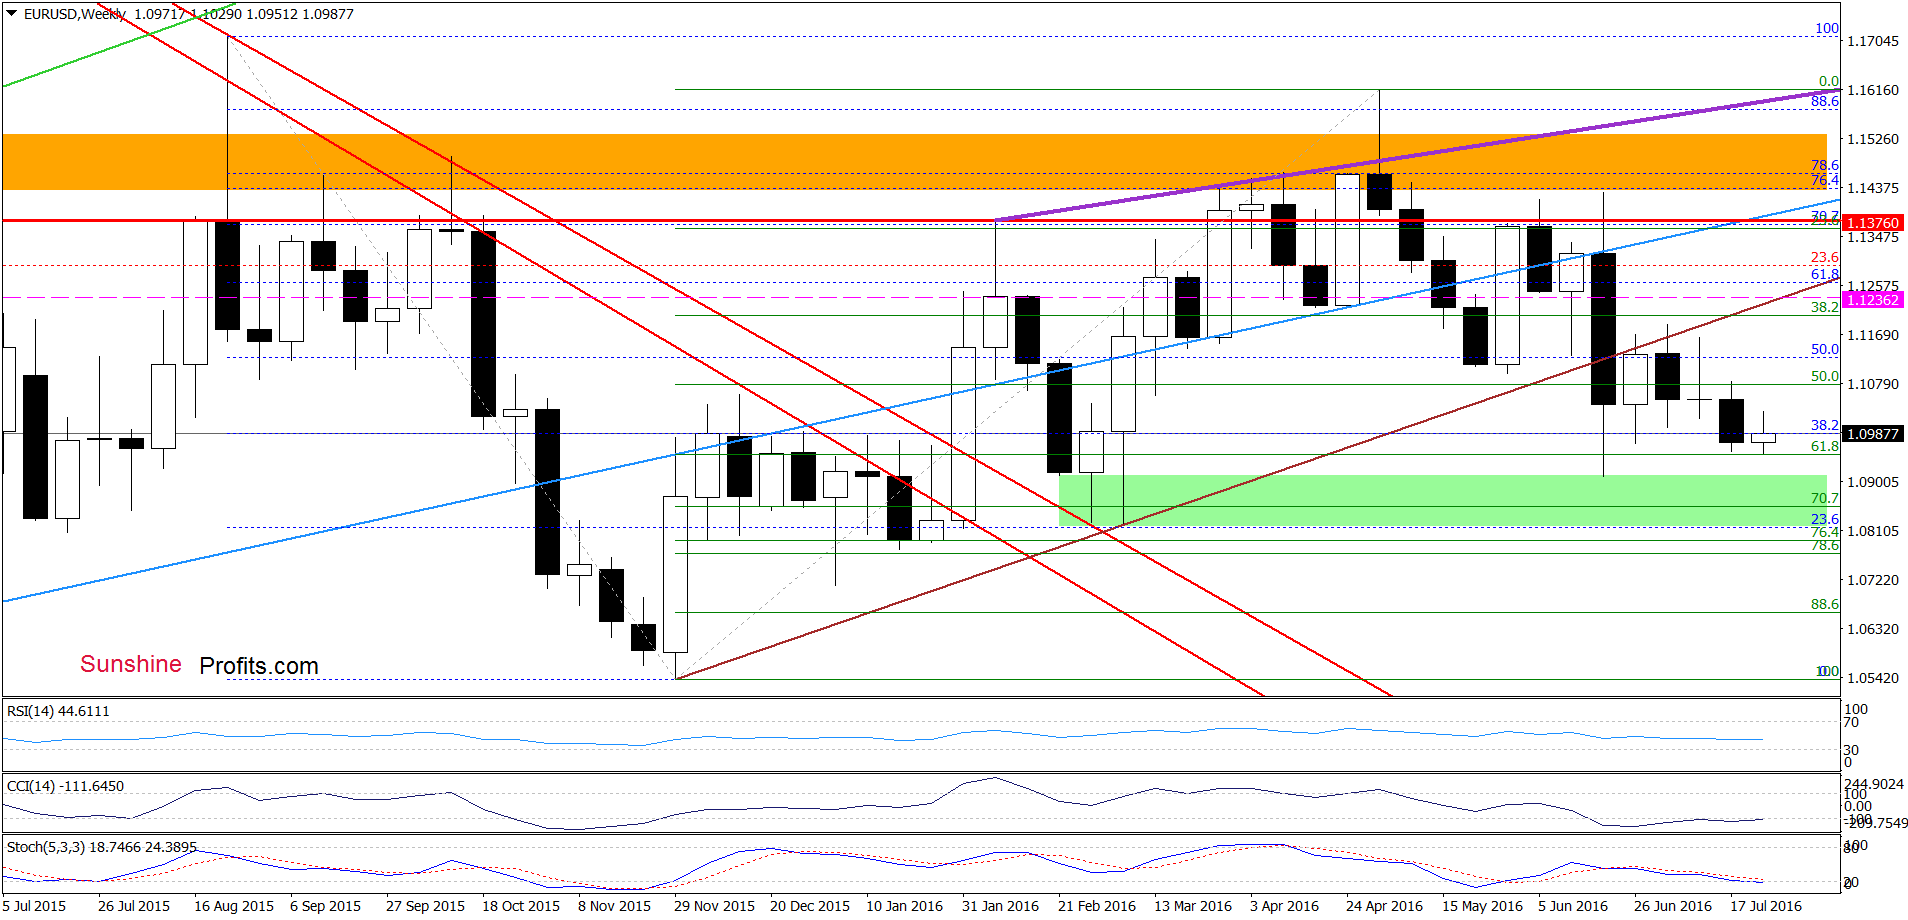
From this perspective, we see that the pair is still trading in a narrow range between the green support zone (created by the late Feb and early Mar lows and reinforced by the 70.7% Fibonacci retracement) and the previously-broken brown rising resistance line, which means that what we wrote yesterday is up-to-date:
(…) we think that another bigger move will be more likely if we see a breakdown under the green zone or invalidation of the breakdown under the brown line. Until this time short-lived moves in both directions should not surprise us.
Nevertheless, the long-term picture below suggests that further declines are just a matter of time. Why?
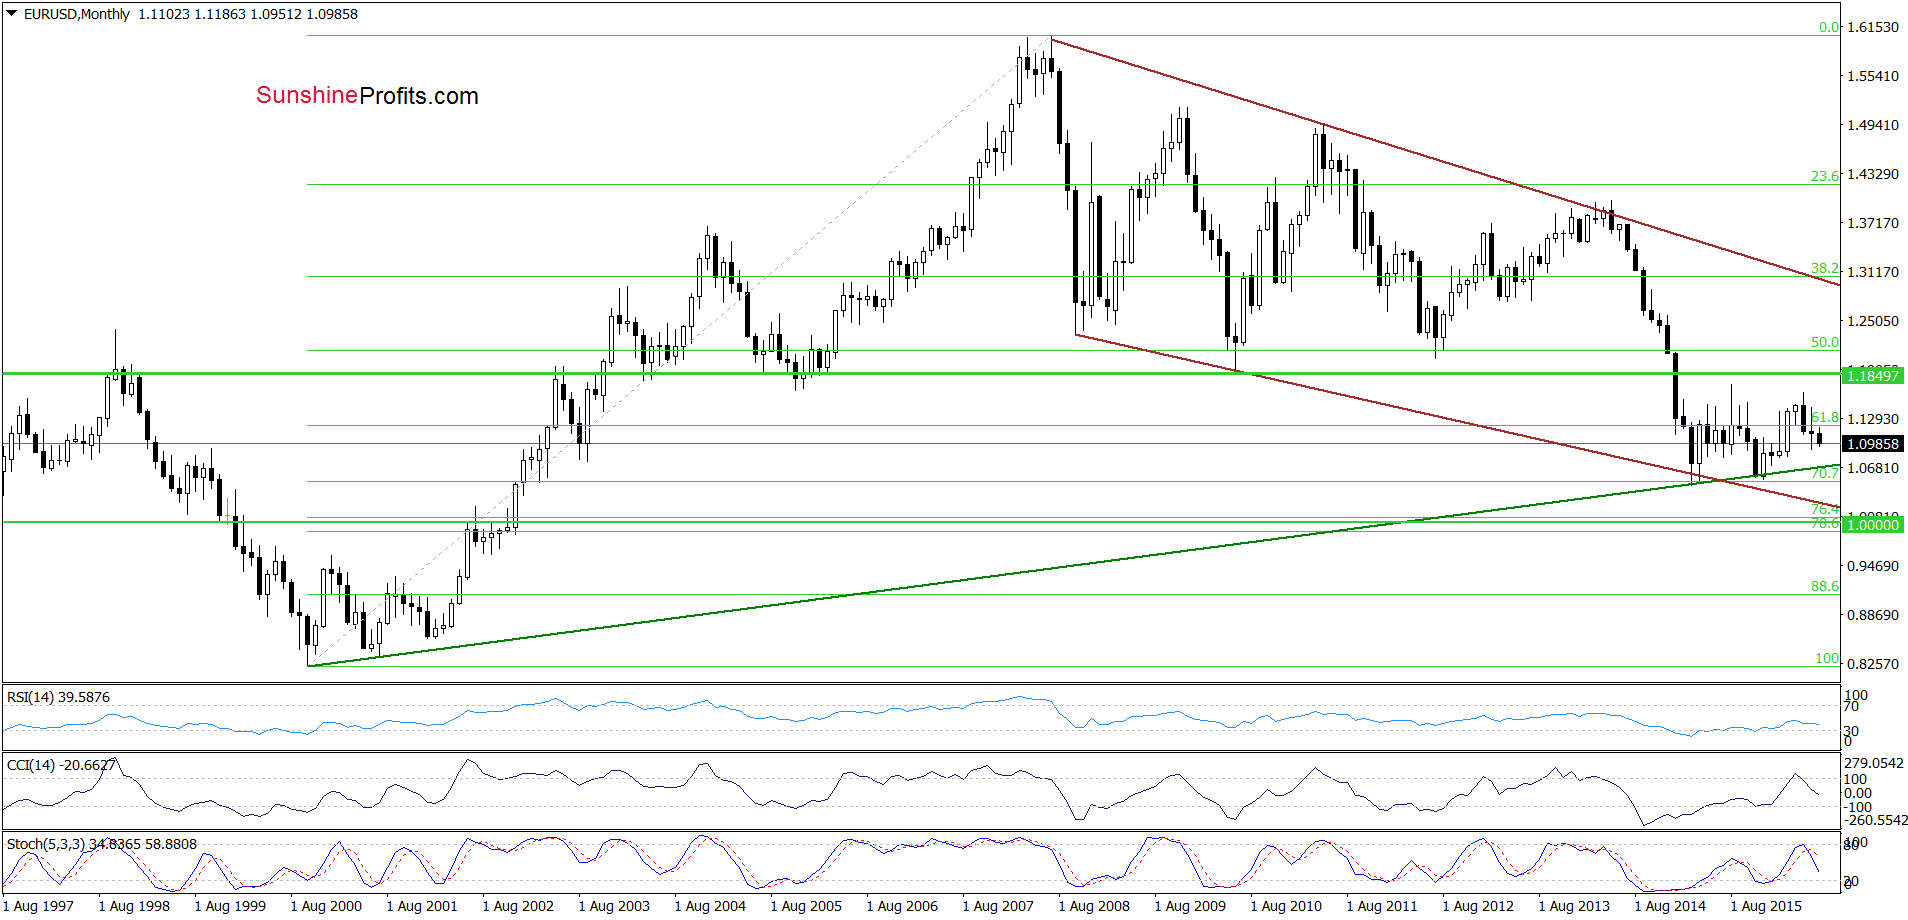
Because sell signals generated by the indicators remain in place, supporting further deterioration and a re-test of the strength of the long-term green support line (currently around 1.0708) in the coming week(s).
Very short-term outlook: bearish
Short-term outlook: bearish
MT outlook: mixed with bearish bias
LT outlook: mixed
Trading position (short-term; our opinion): Short positions with a stop-loss order at 1.1236 and initial downside target at 1.0708 are justified from the risk/reward perspective. We will keep you informed should anything change, or should we see a confirmation/invalidation of the above.
USD/CAD
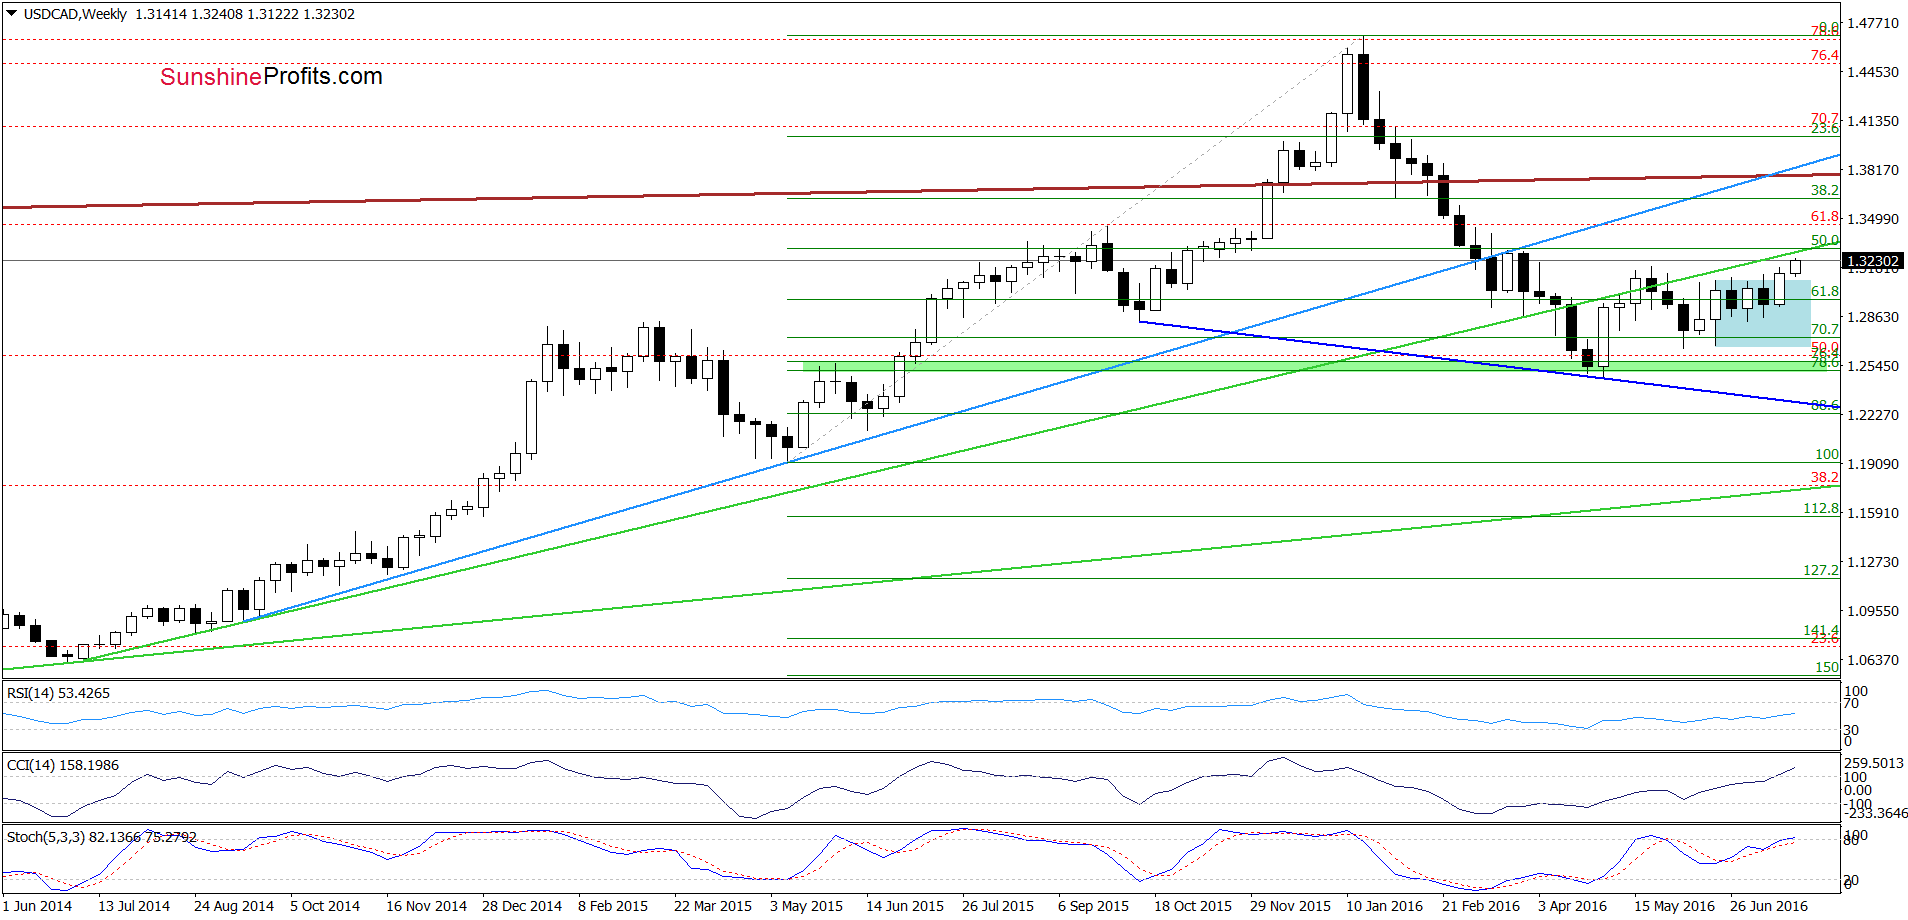
On the medium-term chart, we see that USD/CAD broke above the upper border of the consolidation, which is a positive signal that suggests further improvement and a test of the previously-broken green line (currently around 1.3272) in the coming week.
Are there any negative factors that could hinder the realization of the above scenario? Let’s examine the daily chart and find out.
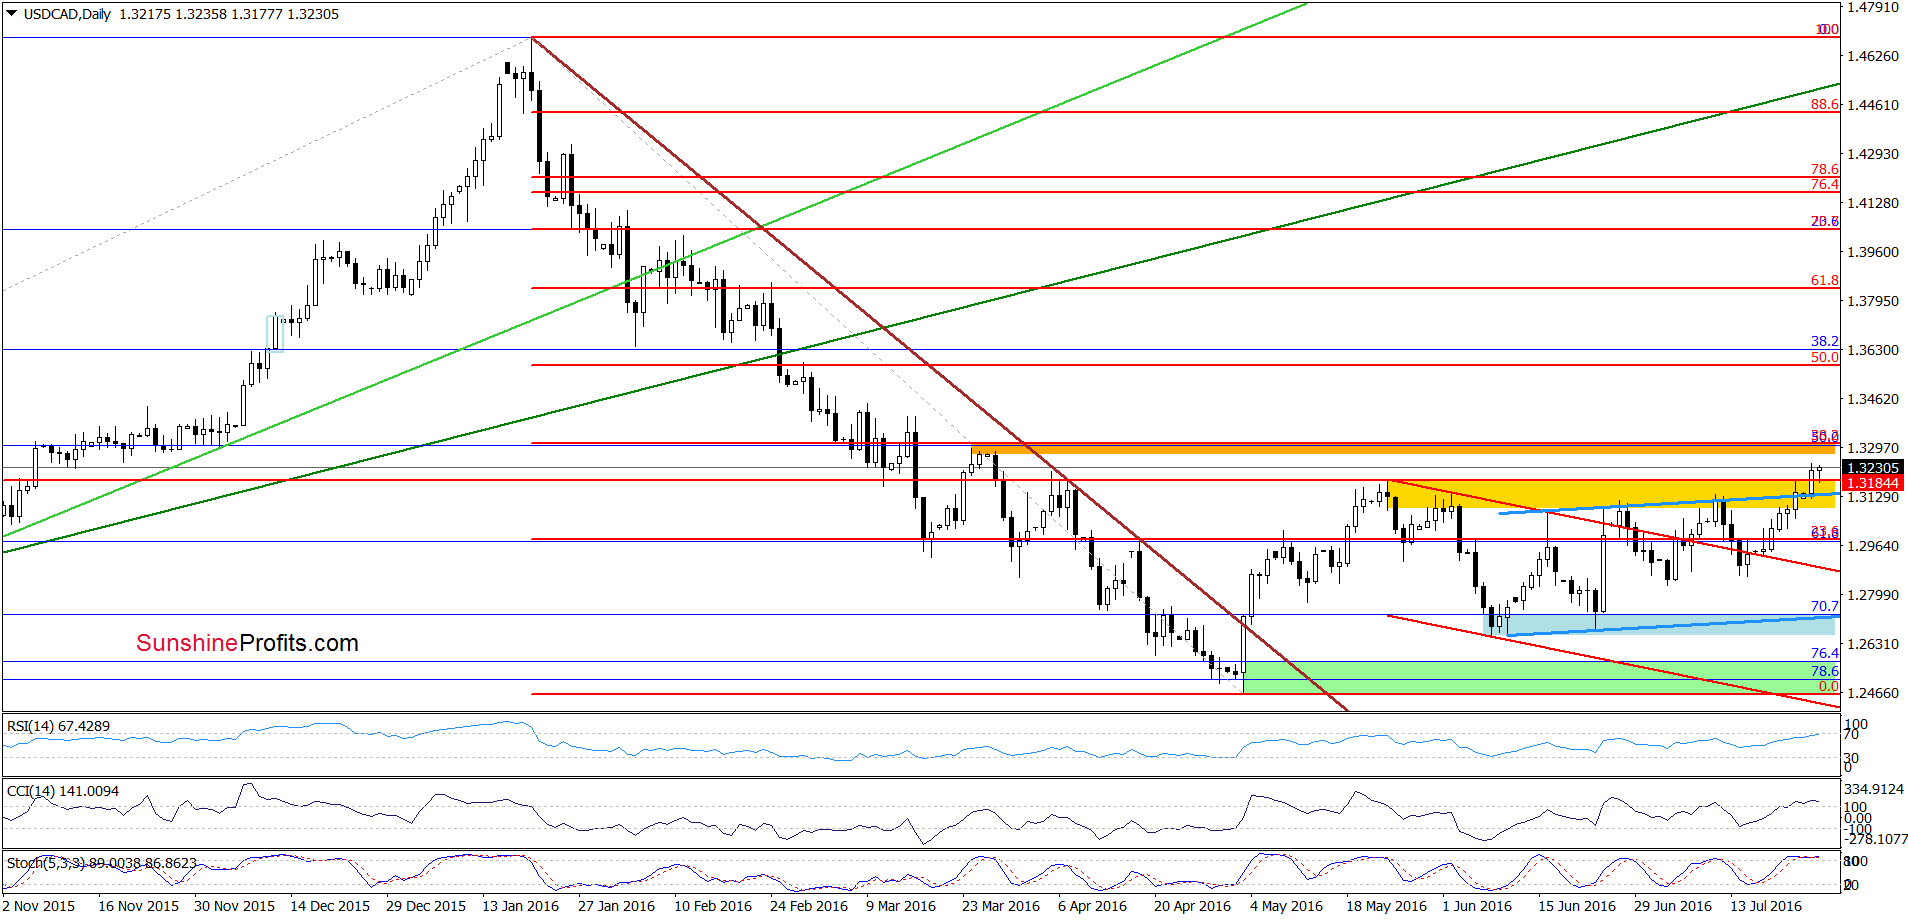
Looking at the daily chart, we see that USD/CAD finally broke above the yellow resistance zone and the upper border of the blue rising trend channel, which encouraged currency bulls to act. As a result, the exchange rate closed yesterday’s session above these resistances, which suggests further improvement and a climb to the orange resistance zone (created by the late Mar highs and the 38.2% Fibonacci retracement based on the entire Jan-May decline) in the coming days (around 1.3283-1.3315). Nevertheless, please keep in mind that the current position of the indicators suggests that the space for gains may be limited and reversal in the coming days can’t be ruled out – especially when we factor in the current picture of crude oil (if you would like to know more about the commodity we encourage you to read our yesterday’s Oil Trading Alert).
Very short-term outlook: mixed with bullish bias
Short-term outlook: mixed
MT outlook: mixed
LT outlook: mixed
Trading position (short-term; our opinion): No positions are justified from the risk/reward perspective. We will keep you informed should anything change, or should we see a confirmation/invalidation of the above.
USD/CHF
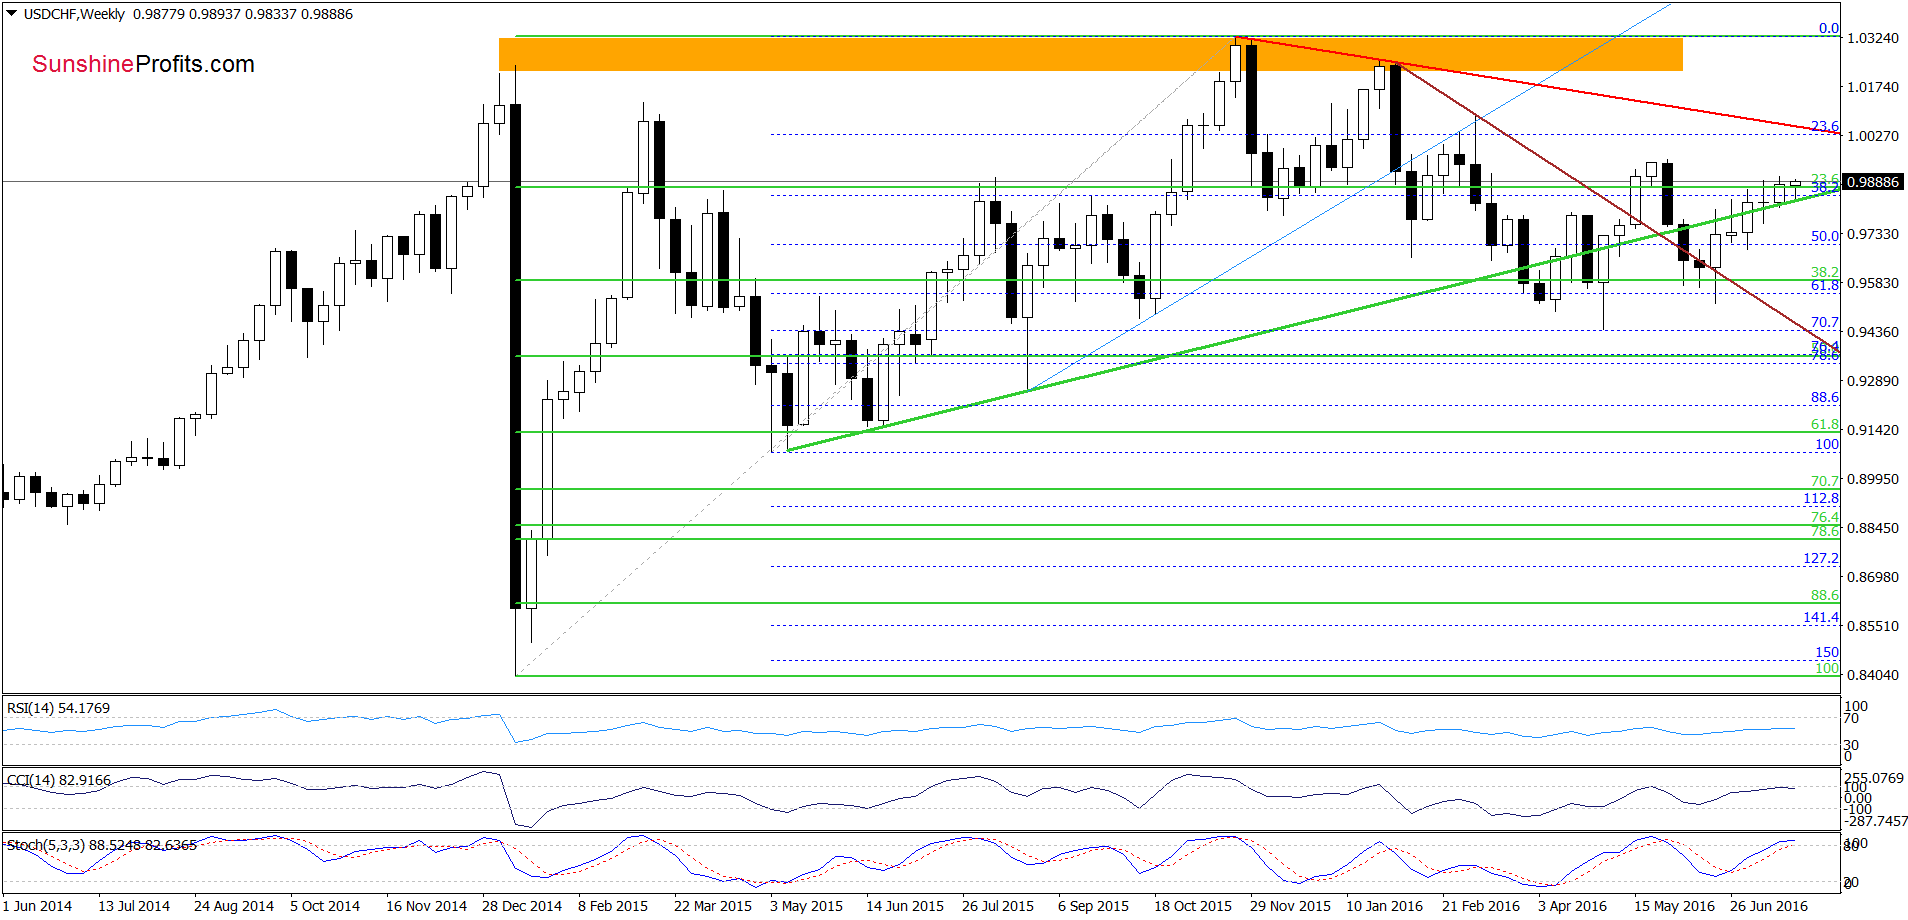
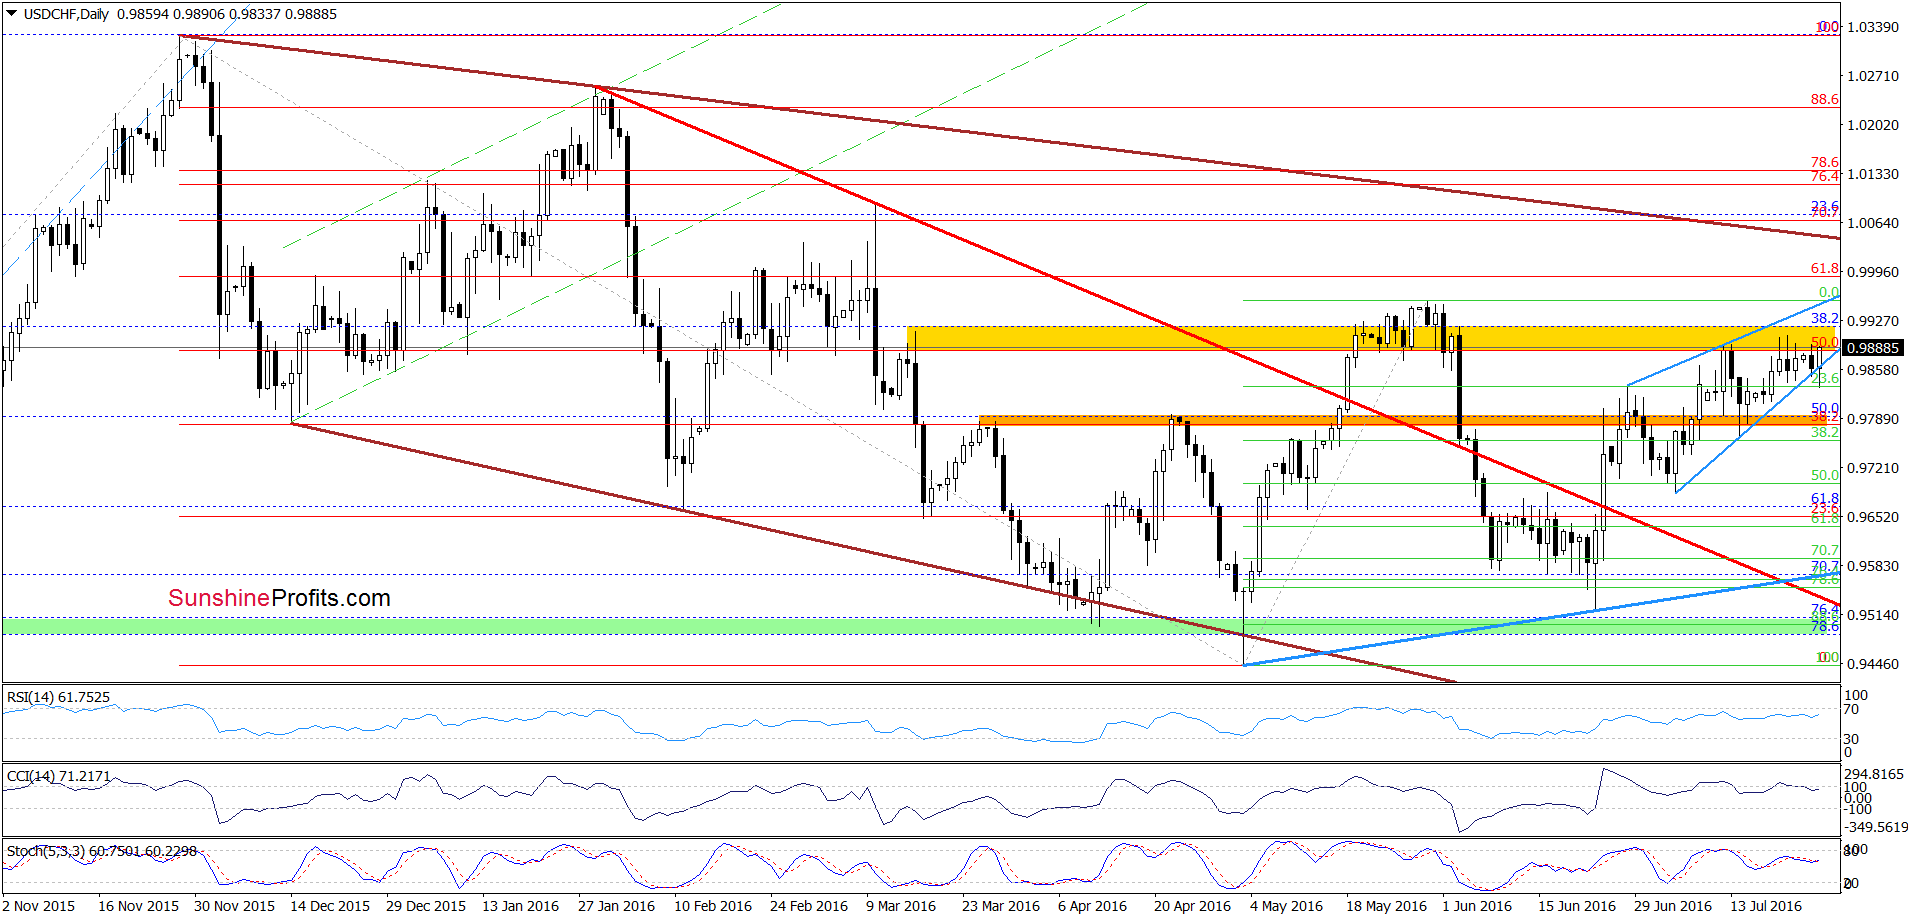
Looking at the daily chart, we see that although USD/CHF slipped under the lower border of the blue rising wedge, currency bulls managed to stop their opponents and push the exchange rate higher. As a result, the pair came back to the yellow resistance area once again. Taking these facts into account and combining them with a buy signal generated by the Stochastic Oscillator, it seems to us that currency bulls will try to push the exchange rate higher in the coming days. If this is the case, and the pair increases from here, we may see a test of the May and Jun highs. At this point it is also worth noting that in this area is also the upper border of the blue rising wedge, which could encourage currency bears to trigger a reversal and decline.
Very short-term outlook: mixed with bullish bias
Short-term outlook: mixed with bullish bias
MT outlook: mixed
LT outlook: mixed
Trading position (short-term; our opinion): No positions are justified from the risk/reward perspective. We will keep you informed should anything change, or should we see a confirmation/invalidation of the above.
Thank you.
Nadia Simmons
Forex & Oil Trading Strategist
Przemyslaw Radomski, CFA
Founder, Editor-in-chief

The world has woken up to the fact that the Central Banks are a curse, rather than a boom to the global economies, and their time left is slowly coming to an end because of new technologies and currencies.
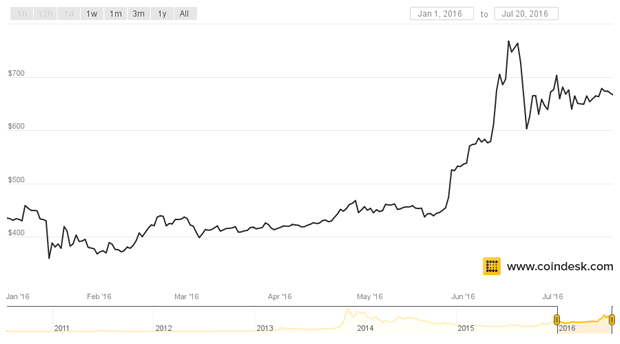
People are starting to park their money in digital currencies, like Bitcoin, rather than parking them in fiat currencies. This is primarily due to the Negative Interest Rate Policy as well as Zero Interest Rate Policy of the Central Banks, which explains the sharp rise in the price of Bitcoin, this year as seen in the chart below.
Billionaire resource investor, Carlo Civelli, believes that the Central Banks cannot get away with all the monetary printing. And I believe that the more they print, the more they push investors away from wanting their fiat currency.
“If we all talk about the end game and a scenario of total collapse, I can see the governments telling everybody that your money is now worthless and the bonds you own are now worthless. You all have to take a haircut”, said Civelli.
The institutional investors are recognizing this outcome,
hence, they are the largest group of Bitcoin buyers.
Jeremy Millar, Founder and Managing Partner at Ledger Partners in London, believes that people at hedge funds and family offices contribute 50% to 90% of the Bitcoin’s current $6.4 billion market cap.
“What is clear though is that over the last two years, bitcoin has emerged from its ‘hacktivist’ origins to a more institutionalized ecosystem which includes the participation of hedge funds, traders, and professional investors,” said Millar, reports Reuters.
Lack of regulation was scaring a few customers; not that regulation helped in any way during the 2007 crash, and neither will it help in the next crash. Nonetheless, the entry of the Winklevoss twins has given the whole industry an entrepreneurial boost. The twin brothers have co-founded the Bitcoin exchange Gemini.
“With Gemini, we’re a regulated trust company in the state of New York; we’re regulated under banking law, so we operate and have the same controls and procedures that you would expect of any financial institution (like your bank). That didn’t exist in the early days of Bitcoin. Quite frankly, it didn’t exist a year ago . . . It was a Wild West in the early days,” said Tyler Winklevoss.
It is not only the U.S. and the European investors who are worried about their currencies, but the Chinese investors are worried, as well, about the decreasing value of the yuan.
Zennon Kapron, founder of Financial Technology Consultancy Kapronasia and author of a book on Bitcoin said, “it seems that China is leading a lot of the movement. People are protecting their investments [by converting yuan into bitcoin],” reports the Wall Street Journal.
The chart below shows the Chinese appetite for Bitcoin. The two Chinese exchanges, Huobi and OKCoin, both witness approximately 92% of the global trade in Bitcoin.
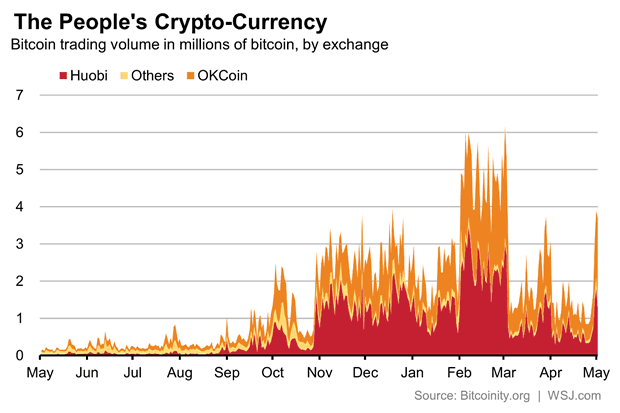
“There’s a lot of hot money in China that has to go somewhere,” says Du Jin, Chief Marketing Officer at Huobi, reports The WSJ.
Austrian economist and investor Tuur Demeester believes that “it is important to use Bitcoin as part of a diversified portfolio.” He adds that bitcoin “offers a counterbalance to a series of growing risks that are associated with traditional investment practices,” reports the Brave New Coin.
“We think a well-rounded portfolio includes investments in a basket of block chain technologies (altcoins), with an emphasis on Bitcoin. This portfolio can play a part in three distinct strategies: as an insurance policy, as a hedge in a broad speculative portfolio and as a calculated bet on an early retirement,” wrote Mr. Demeester, in his report.
He goes on to add that “we believe returns of 100x over 10 years are possible, though obviously not guaranteed.”
Conclusion:
My readers know that I do not big believer in owning fiat currencies for the long-term. My main emphasis is to find ‘alternative’ asset classes, which are mature enough, but not saturated. The risk-reward in such classes should be high.
Gold and silver are undeniably the best investments for the long-term considering the low-risk that they carry. Similarly, within the next few days, I will keep an eye on Bitcoins, as well, and suggest trading ideas so as to profit from it.
Keep watching this space so as to know when to buy each one of the ‘asset classes’
also:
Don’t miss Michael Campbell’s interview: A Truly Great Interview With Uber Money Manager, James Thorne

-
I know Mike is a very solid investor and respect his opinions very much. So if he says pay attention to this or that - I will.
~ Dale G.
-
I've started managing my own investments so view Michael's site as a one-stop shop from which to get information and perspectives.
~ Dave E.
-
Michael offers easy reading, honest, common sense information that anyone can use in a practical manner.
~ der_al.
-
A sane voice in a scrambled investment world.
~ Ed R.
Inside Edge Pro Contributors

Greg Weldon

Josef Schachter

Tyler Bollhorn

Ryan Irvine

Paul Beattie

Martin Straith

Patrick Ceresna

Mark Leibovit

James Thorne

Victor Adair