
Currency
Quotable
“I have experienced failure as a politician and for that very reason, I am ready to give everything for Japan.”
Shinzo Abe
Commentary & Analysis
Talk of yen intervention makes sense…but first Brexit to deal with

Japanese industry is worried the yen strength will hurt its overseas sales.
The yen’s recent approach to ¥100 against the dollar has provoked speculation that the Ministry of Finance may be poised to intervene for the first time since 2011.
“We think the time to act has already arrived. It’s already ¥104, ¥105 to the dollar. It was ¥118 in January. From ¥118 to ¥104 — that’s ¥15 in six months,” said Mr [Sadayuki] Sakakibara [chairman of the powerful Keidanren business lobby].
“That is not orderly. Extremely disorderly is all you can call it. To keep it stable in a reasonable range then certainly the Ministry of Finance should act.”
Financial Times , 20 June 2016
It used to be no matter how strong the value of the Japanese yen, the country’s trade balance remained quite high; even despite attempts to punish Japan a la the the Plaza Accord [G-5 countries intervening back in September of 1985 to weaken the dollar against both the Japanese yen and Germany mark].
In the chart below I have overlaid the USD/JPY on top of the monthly Japanese Trade Balance going back to 1982. The yen weakened from a whopping 277 to the dollar during 1982 to just 84 yen per dollar by 1995. Yet, as said, Japan’s trade balance remained strong.
In the chart below, I have shifted the USD/JPY by 20 months into the future. As you can see, the correlation between the value of the yen and trade is seen more clearly.

The game changer of course was the credit crunch, which altered the supply and demand dynamics in the global economy in a very big way. As the yen strengthened on haven flow from around USD/JPY 123 to USD/JPY 77 in the midst of the credit crunch, Japan’s trade balance started consistently deteriorating.
Thus it was the beginning of the three-arrow strategy from Japanese PM Abe—the first arrow was intended to weaken the yen. And as you can see in the chart above (and below) it worked.

So, based on the correlation seen above, it seems in this new abnormal world where demand is not quite stagnant, but weak at best, Japanese industry seems right be worried. It suggests calls for intervention may soon be acted upon.
However, I suspect Japan is keeping powder dry till after the Brexit vote. Because if the Brits decided they want sovereignty back, the yen likely rally sharply again on haven flow, similar to what it did during the credit crunch, but in mini-fashion.
Next stop on haven flow to the yen is likely the 100 target many have discussed. It represents a 50% retracement from the low going back to November 2015—when the three-arrow strategy got underway. But after a move to 100, it would seem the potential pressure would be too much for Japan’s government—they would likely decide to step in with barrels blazing.
USD/JPY Monthly:

If the “remain” block wins the Brexit vote, either $-yen rallies (yen weakens) of its own accord and/or the government helps it along; that seems the consensus bet. But Mr. Market is likely to be particularly tricky in here so any confidence in the consensus should remain limited.
Jack Crooks
President, Black Swan Capital
also, the latest from Martin Armstrong: Central Banks Made Govt Debt the Riskiest Debt of All Time

 Summary:
- China is becoming a significant enough force in the world that officials at the Federal Reserve are going to have to pay more attention to world currency markets.
- The US/China economic and financial relationship is so important to China that the People’s Bank of China has reduced its currency reserves by $470 billion since last August.
- Importance? Since the Federal Reserve announced it was stopping its quantitative easing in the summer of 2014, the PBoC has seen its currency reserve drop by around $800 billion.
related:

The USDCAD looks just about ready to head back up which will be the next leg of the bear rally that commenced in early May 2016. Let’s check out the action using the weekly and daily charts.
USDCAD Weekly Chart

The horizontal line denotes the previous swing low set in October 2015 and we can see the recent low at 1.2461 breached that level thereby creating a lower low. I now believe price is tracing out a significant bear rally that still has plenty of time and price still to play out.
The Bollinger Bands show price has encountered some resistance around the middle band and has been sliding down with it over the past few weeks. I believe decision time is upon us and price will make a decision any day now to leave this middle band and head up to the upper band and beyond.
The PSAR indicator is bullish with the dots at 1.2723. This is my tight setting and these dots that represent support often act like a magnet for price and I expect the higher low to be right around the 1.2723 level. Considering it is my tight setting, it is quite possible price to stage a fake out move whereby price busts the dots before turning back up. It is really neither here nor there and today’s low of 1.2732 has so far held this support.
I have drawn a Fibonacci Fan from the January 2016 high to recent low. It shows price finding resistance at the 38.2% angle and trading back down in tandem with this angle with the angle now looking more like it is providing support. I expect price to lift off this angle at any time now and surge higher.
I have added Fibonacci retracement levels of the move down and I am targeting the final bear rally high to be at least up around the 61.8% level at 1.3839. The 76.4% level at 1.4165 is also worth considering.
The RSI showed a bullish divergence at the recent low and it looks to be building strength with a pattern of higher highs and higher lows.
The MACD indicator is bullish although the averages have come back together again and that is often the exact moment when a trend resumes.
Let’s now look in a bit closer with the daily chart.
USDCAD Daily Chart

The Bollinger Bands show price now pushing into the lower band and this should act like a rubber band once price decides to bounce back up, assuming it does of course.
I have drawn a Fibonacci Fan from the low to recent high and this shows price right around support from the 76.4% angle. It is this angle where I expect the pullback low to form.
I have added Fibonacci retracement levels of the recent move up and I am looking for a low to form around support from the 61.8% level at 1.2739. Today’s low of 1.2732 has marginally clipped that level so I would suggest it is alert stations for the bulls!
I have added moving averages with time periods of 100 (red) and 200 (black) and these have recently made a bearish crossover which adds support that this current move is a bear rally only.
The RSI is back in oversold territory while the MACD indicator is bearish although that is coming off a nice move up.
So, we just await a low followed by an impulsive reversal back up and I believe that will occur at any time now. One to watch!
related: The Easy Way to Prosper From the Coming Paper-Money Crisis
As you go about your everyday life, it’s easy to forget how big the economic problems we face really are… and how desperate our political leaders have become to safeguard the existing system.
That’s because of human psychology. It’s called the “normalcy bias.” It explains why, if you don’t heat up the water too fast, the “frog” never jumps out of the pot before it starts to boil. People (the frogs) have a hard time believing that tomorrow won’t be a lot like today. It can be almost impossible to open your mind enough to think about how the world might look a year from now… or five years from now… if there’s a serious economic crisis.
That’s what I believe is going to happen. I’ve written about the problems I see in the world economy over the past year or so. I’ve described the potential for $1.7 trillion in corporate-bond defaults, a credit crisis I’ve said would be “the greatest legal transfer of wealth in history.”
If you don’t agree with me, then all of these warnings might make me sound like a crazy person. I probably sound crazy to a lot of people… at first. But I put the bug in their ear. Slowly, they start seeing what’s happening. It takes time. But I believe, more and more, you’re starting to see these things for yourself. It’s getting harder to believe that everything is fine.
Meanwhile, I don’t advocate selling everything you own and moving to New Zealand. Nor do I even recommend selling all of your stocks. I am telling you: Keep your head up and your mind open to the risks. What’s about to happen isn’t just a normal market correction or even a bad bear market. What’s about to happen is a once-in-a-century debt-default cycle that could destroy the world’s existing paper-money standard.
Think that’s nuts? OK, maybe it is. But take a minute and look at this chart…
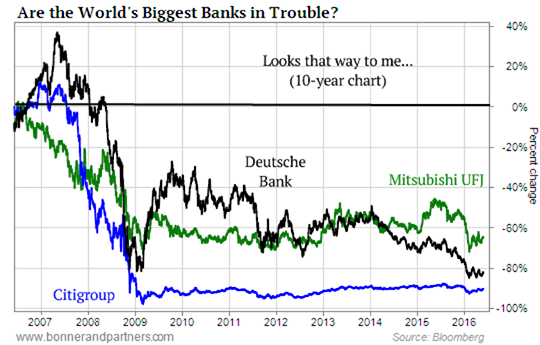
This chart isn’t hard to figure out. It simply compares the largest, most systematically important banks in the world: Mitsubishi UFJ (MTU), Deutsche Bank (DB), and Citigroup (C). Their share prices are down 66%, 80%, and 90% over the past 10 years.
How is that possible?
I’d like for you to ask yourself two simple questions: First, if you believe that everything in the world’s economy is basically fine and operating normally… how could the three most important banks in the world all be falling apart? Ask a reasonably well-read and knowledgeable person – like your broker, or the friend you always talk with about investments – what the 10-year return has been on the three largest banks in free-market capitalism. I guarantee they won’t come anywhere close to the correct answer.
That’s normalcy bias in action. People constantly disregard any facts or data points that don’t match their underlying assumptions, especially when those data points would disrupt a long-held belief or worldview. Let me say this as plainly as I can: If our global financial system were working normally, the returns on these major, immensely important piles of capital would at least be positive.
Here’s the second question I want you to think about carefully: How far will these banks have to fall before you think seriously about taking all of your savings out of the banking system? If these banks fail, the system will fail. And how much faster will you make the decision to pull your cash if these banks begin charging you to hold your cash in their bankrupt vaults?
Now… let me back up for a second.
The reason these banks have struggled for an entire decade isn’t hard to understand. You don’t need to be an economist. If you have been alive for the last 20 years, you know what happened…
A tremendous amount of credit was created out of thin air around the world. You can measure it in plenty of ways: total debt to GDP, the size of financial earnings as a percentage of GDP, debt service as a percentage of household income. I could bury you in numbers… but they all mean the same thing.
For an entire generation, most people in the world’s major, wealthiest economies consumed far more than they produced, resulting in a debt bubble of mind-boggling, epic proportions.
This process of unlimited credit creation is hitting the wall of economic reality. Wages haven’t grown. Productivity hasn’t grown as fast. And various economic tricks to extend even more credit – like increasing international trade, manipulating currencies, and printing money – are running out of steam. Thus, this massive, global bubble is beginning to deflate. Before that can happen, though… credit has to stop expanding. That’ll be the first sign that the real collapse is happening.
As you’ll recall, a lot of the credit created in our economy relied on ever-increasing housing prices. Fannie Mae and Freddie Mac were the primary guarantors of the bubble in the U.S. – a total of $5 trillion in credit was created in about a decade on just two balance sheets.
Lately, though, credit has only been expanding in far less secure ways. Globally, credit has been expanding by lending to corrupt emerging markets (like China, Brazil, and Russia). In the U.S., credit has been piled onto the backs of college students and subprime auto lending (nuts!). Sovereign debt around the world has technically been expanding, too… But as you know, that’s a rigged game where the national treasuries offer bonds and the central banks buy them with newly printed money.
And so… the world economy has moved from making loans on good collateral (sound residential mortgages) to lending billions to corrupt dictatorships, unemployed college students, and subprime auto-buyers. Oh, we’re also growing credit by printing money. No wonder those major banks are falling apart. I’d be willing to bet a huge amount of money that the folks auditing the banks’ loan books don’t keep their cash in those banks.
In various ways, all of these bad loans end up on the balance sheets of the world’s biggest banks. The means of transmission are varied: The loans are securitized, they’re sold, they’re “swapped.” These loans and their underlying collateral end up in a myriad of different derivative products. In short, they’re everywhere. These loans are at the heart of the financial system we use to drive the world economy. And today, they’ve transformed the global economy into a mountain of hugely inflated value… a giant pile of steaming, worthless garbage.
So what happens when suddenly, for no discernable reason at all, everyone decides to stop pretending otherwise?
When that happens, the authorities will have three choices. They can…
- Inflate away the bad debt by devaluing the currency and propping up the banking system with newly printed money and trade surpluses. That’s the International Monetary Fund’s playbook. It’s what Japan has tried to do for 30 years. And it seems like that’s what America and Europe are going to try now, too. Or…
- Write off the bad loans, shut down the bad banks, and suffer a severe (but short) crisis. That’s the sound-money option. (Nobody does that anymore, because depositors in the bad banks would lose everything… and they vote.) Or…
- Simply repudiate a lot of the debt and stiff the creditors, like Russia did in 1998 and Iceland did in 2008. (That option works best if you have foreign creditors… like Argentina did in 2002.)
Nobody knows what’s going to happen when most of the world’s wealthiest and largest economies try option No. 1 at the same time. But let me hazard a guess: The outcome isn’t going to be good for people who saved all of their money in paper currencies.
And that brings us to gold. As you may know, gold had its best quarter since 1986. The metal’s spot price was up more than 16% in the first quarter of 2016. Yes, this could be simply a random price move. But I don’t think so.
My friend Dr. Steve Sjuggerud has done careful studies of what moves of this magnitude mean in the market for gold. His research analyst Brett Eversole published the results of one of their most recent studies in the March 8 DailyWealth. Their work shows that given gold’s recent price moves, they would expect gold to move 19% more over the next 12 months.
Keep in mind, that’s based on the last 40 years of trading during normal market conditions… not a period that features a global financial crisis like the kind I expect. So it’s a good time to buy gold, even if the crisis we expect doesn’t materialize.
Gold does best when real interest rates are negative. The reason is easy to understand: Gold is the ultimate hedge against the loss of purchasing power in paper currencies. If governments can’t offer a real rate of return for holding their bonds, then investors aren’t being protected against inflation. And as a result, they flee to gold.
Negative interest rates would greatly exacerbate this logical market preference… and that’s exactly why gold has been soaring lately. As Steve explained in the March 15 DailyWealth…
When both gold and paper money pay zero-percent interest, investors prefer gold over paper. Right now, paper money is paying you zero [or even less]… It’s time for people to own gold.
We now stand on the precipice of one of the biggest bull markets in gold the world may ever see.
I personally believe the price of gold could be more than 10 times what it is today. And certain gold stocks could go up 10, 20, or even 50 times their current prices.
Regards,
Porter Stansberry
Founder, Stansberry Research
For an offer from Stansberry Gold Investor, click here
related from Larry Edelson:

Quotable
“Panics do not destroy capital. They merely reveal the extent to which it has been previously destroyed by its betrayal into hopelessly unproductive works.”
John Stuart Mill
Commentary & Analysis
Mr. Xi Jinping’s Deflation

Today’s short story starts with China’s investment overhang…or malinvestment for lack of a better term…
In the chart below from Morgan Stanley, it suggests China hasn’t changed much, i.e. it is still trying to keep growth alive through its tried and true capital investment model.

The chart above reveals each new dollar invested has a decreasing stimulative impact on GDP; i.e. the efficiency of capital employed in China has fallen dramatically. Is it a classic case of malinvestment?
“Malinvestment is a mistaken investment in wrong lines of production, which inevitably lead to wasted capital and economic losses, subsequently requiring the reallocation of resources to more productive uses. Austrians believe systemic malinvestments occur because of unnecessary and counterproductive intervention in the free market, distorting price signals and misleading investors and entrepreneurs. For Austrians, prices are an essential information channel through which market participants communicate their demands and cause resources to be allocated to satisfy those demands appropriately. If the government or banks distort, confuse or mislead investors and market participants by not permitting the price mechanism to work appropriately, unsustainable malinvestment will be the inevitable result.”
Wickipedia
Given the secular decline in both consumer demand and globalization itself, recent attempts by the Chinese authorities to revive its capital investment growth model (stimulate exporters), evidenced by another massive surge of credit, seems likely to fail.

Source: Leto Postcripts, Criton Zoakos
[Note: The G-7 is concerned; but the latest pronouncements suggest our heroes don’t believe much can be done on a coordinated basis. It brings to mind the “rats scurrying off a sinking ship” analogy. If trade growth continues to plummet there is little doubt trade tensions and currency manipulations will grow.]
…it would be silly to try to predict China’s political future, or suggest there will be some major crisis, but there is a roadmap for Leninist party states past. China is approaching a critical stage…
“…revolution and seizure of power →transformation and mobilization of society → consolidation of state power and extension over all aspects of society → extraction of resources and capital from society for state purposes → bureaucratization and “Brezhnevization” of state power → adaptation and limited pluralism to cope with stagnation and ossification → ?”
David Shambaugh, China’s Future
…the case for increasing pluralism anytime soon does seem on the horizon given the massive malinvestment and increasing authoritarian rule by Chinese President Xi Jingping…
“Since Xi Jinping came to power at the Eighteenth CCP Congress in November 2012, the reign of the Conservatives has continued. Xi has proven to be a very anti-liberal leader and he has overseen an even greater intensification of the repression evident since 2009. There has been an unremitting crackdown on all forms of dissent and social activists; the internet and social media have been subjected to much tighter controls (see chapter 3); Christian crosses and churches are being demolished; Uighurs and Tibetans have been subject to ever-greater persecution; hundreds of rights lawyers have been detained and put on trial; public gatherings are restricted; a wide range of publications are censored; foreign textbooks have been officially banned from university classrooms; intellectuals are under tight scrutiny; foreign and domestic NGOs have been subjected to unprecedented governmental regulatory pressures and many have been forced to leave China; attacks on “foreign hostile forces” occur with regularity; and the “stability maintenance” security apparatchiks have blanketed the country. A swath of intrusive new regulations and laws concerning national security, cyber security, terrorism, and nongovernmental organizations have been drafted and enacted. China is today more repressive than at any time since the post-Tiananmen 1989–1992 period.”
“Many members of Jiang Zemin’s factional network, and a rising number of Hu Jintao’s, have been brought down—yet none of Xi’s own princeling associates have been touched.”
“The regime’s repression is symptomatic of its deep and profound insecurity.”
David Shambaugh, China’s Future
…a wrong turn here by China’s leaders can threaten, or at least postpone, China’s development into a normally functioning modern state…
“The key issue for nations like China at this stage of development is not just the economic growth model and its declining efficacy, but precisely the relationship between economics and politics. For economies to transition up the added-value ladder, break through the developmental ceiling, and make the kinds of qualitative transitions necessary to become truly modern and developed, political institutions must be facilitative. They must cease being ‘extractive’ states and become what scholars Daron Acemoglu and James Robinson describe in their insightful book Why Nations Fail as “inclusive states.” This requires tolerance— even facilitation— of autonomous actors within society.”
David Shambaugh, China’s Future
…more muddling through decreases the chance China will escape the “middle income trap” which has plagued developing economies in the past? Just and FYI: The theory of convergence so talked about by emerging market mutual fund salesman is more the exception than the rule. [Does anyone remember the acronym BRICs?] …the probability of “Japanification” of the Chinese economy is rising. Consider the similarities…
“During the 1980s it appeared Japan as the Creditor Superpower was going to gobble up the world with their powerful export machine and massive current account surpluses rolling in. Then a little thing called the US stock market crash in 1987 changed the game. Dollar credit flowed from the global system triggering an improvement in the US current account balance (first gold box left in chart below) which was followed by a US recession. This came as the Japanese yen was appreciating in value, thanks to the G-7 Plaza Accord to pressure the yen higher because of all those Japanese exports.
“The litany:
1) Japan’s very hot stock market broke in 1989.
2) Then its extremely over-priced real estate bubble started its collapse (remember when the Imperial Palace in Tokyo was worth more than the entire state of California).
3) Japanese authorities did all they could in the form of stimulus to try to keep air in the bubble.
a. They pumped more money into the stock and property markets in order to revive the wealth effect for domestic consumers.
b. They subsidized export companies to keep exports flowing (but the world’s major consumer—the US economy—was entering recession and not there to buy).
c. They lowered interest rates to zero.
d. They continued massive fiscal stimulus by building infrastructure across the country.
“But, it didn’t work. The massive dislocations caused by artificial channeling of credit within the Japanese economy in order to focus almost entirely on building a global export machine created the malinvestment that has taken years to work off precisely because the Japanese economy was so imbalanced—production versus consumption. Attempts to change this model were scant at best; instead they kept morbid companies alive, and forced its consumers to save thanks to artificially low interest rates. “
Jack Crooks, “The Japanese-China Parallel: Eerie and Scary Combined,” Forex Journal July 2010
At the very least, we would expect another wave of deflation to flow out of Asia. Directly impacting the emerging markets in terms of trade through falling commodity prices and leading to another flow of capital from the periphery (developing world economies) to the center (developed world economies); it would be a negative reinforcing feedback loop for the emerging markets (risk off and possibly contagion)…

The deflationary impact to the developed world from China would be more implicit (as the brunt of falling commodities prices has already been discounted to a large degree) seen through falling final goods and material prices. Interestingly, despite negative interest rates in Japan and Europe, those countries should receive their fair share of money flow from Asia because increased deflation will push up real yields in both places; i.e. nominal yield minus inflation rate.
But given the estimated $3 trillion emerging market dollar denominated debt, the dollar will likely win the global money flow game: 1) a risk bid for the world reserve currency; and 2) yield on the premise the Fed will be the only major world central bank to hike in 2016.
So, to summarize potential takeaways:
1. Increased Chinese stimulus will most likely increase deflationary pressures down the road.
2. Increased repression and external belligerence (Can you say: South China Sea?) from Chinese President Xi will likely prolong the downturn in the Chinese economy.
3. Despite the excitement about oil being back at $50 per barrel, the global macro environment may not be a fertile backdrop for a continued run in commodity prices.
4. The currency order under this scenario: Dollar is most favored; other developed economies second; commodity currencies third; emerging market currencies last
Editor’s Note: I am preparing a detailed special report and specific trading/investing ideas as related to the scenario summarized in today’s missive; along with a voiced-over PowerPoint presentation. It will be used as a promotion for our new service: Key Market Strategies. I should have that available early next week.
Jack Crooks
President, Black Swan Capital

-
I know Mike is a very solid investor and respect his opinions very much. So if he says pay attention to this or that - I will.
~ Dale G.
-
I've started managing my own investments so view Michael's site as a one-stop shop from which to get information and perspectives.
~ Dave E.
-
Michael offers easy reading, honest, common sense information that anyone can use in a practical manner.
~ der_al.
-
A sane voice in a scrambled investment world.
~ Ed R.
Inside Edge Pro Contributors

Greg Weldon

Josef Schachter

Tyler Bollhorn

Ryan Irvine

Paul Beattie

Martin Straith

Patrick Ceresna

Mark Leibovit

James Thorne

Victor Adair