
Currency
In the midst of the great commodities boom past, despite the prognostications of many it was never going to end, e.g. one top seer was fond of asking us to visualize every Chinese citizens eating just one egg and one strip of bacon and having a glass of juice every day for breakfast and voila–commodities investing nirvana. Well, despite the logic of this visualization, it hasn’t been that simple. But that’s the point—it never is simple.


I can’t help thinking about the Japanese real life deflationary experiment over the last 2 1⁄2 decades. It didn’t matter much when the Japanese move to ZIRP—zero interest rate policy. Borrowers didn’t take the money as they had few prospects on the business side of the fence and consumers were both over-levered and concerned about the future. So Japan has moved to NIRP—negative interest rate policy following in the footsteps of Europe. The ECB went deeper with the move yesterday. Now extending the bank’s largesse to buying corporate debt.


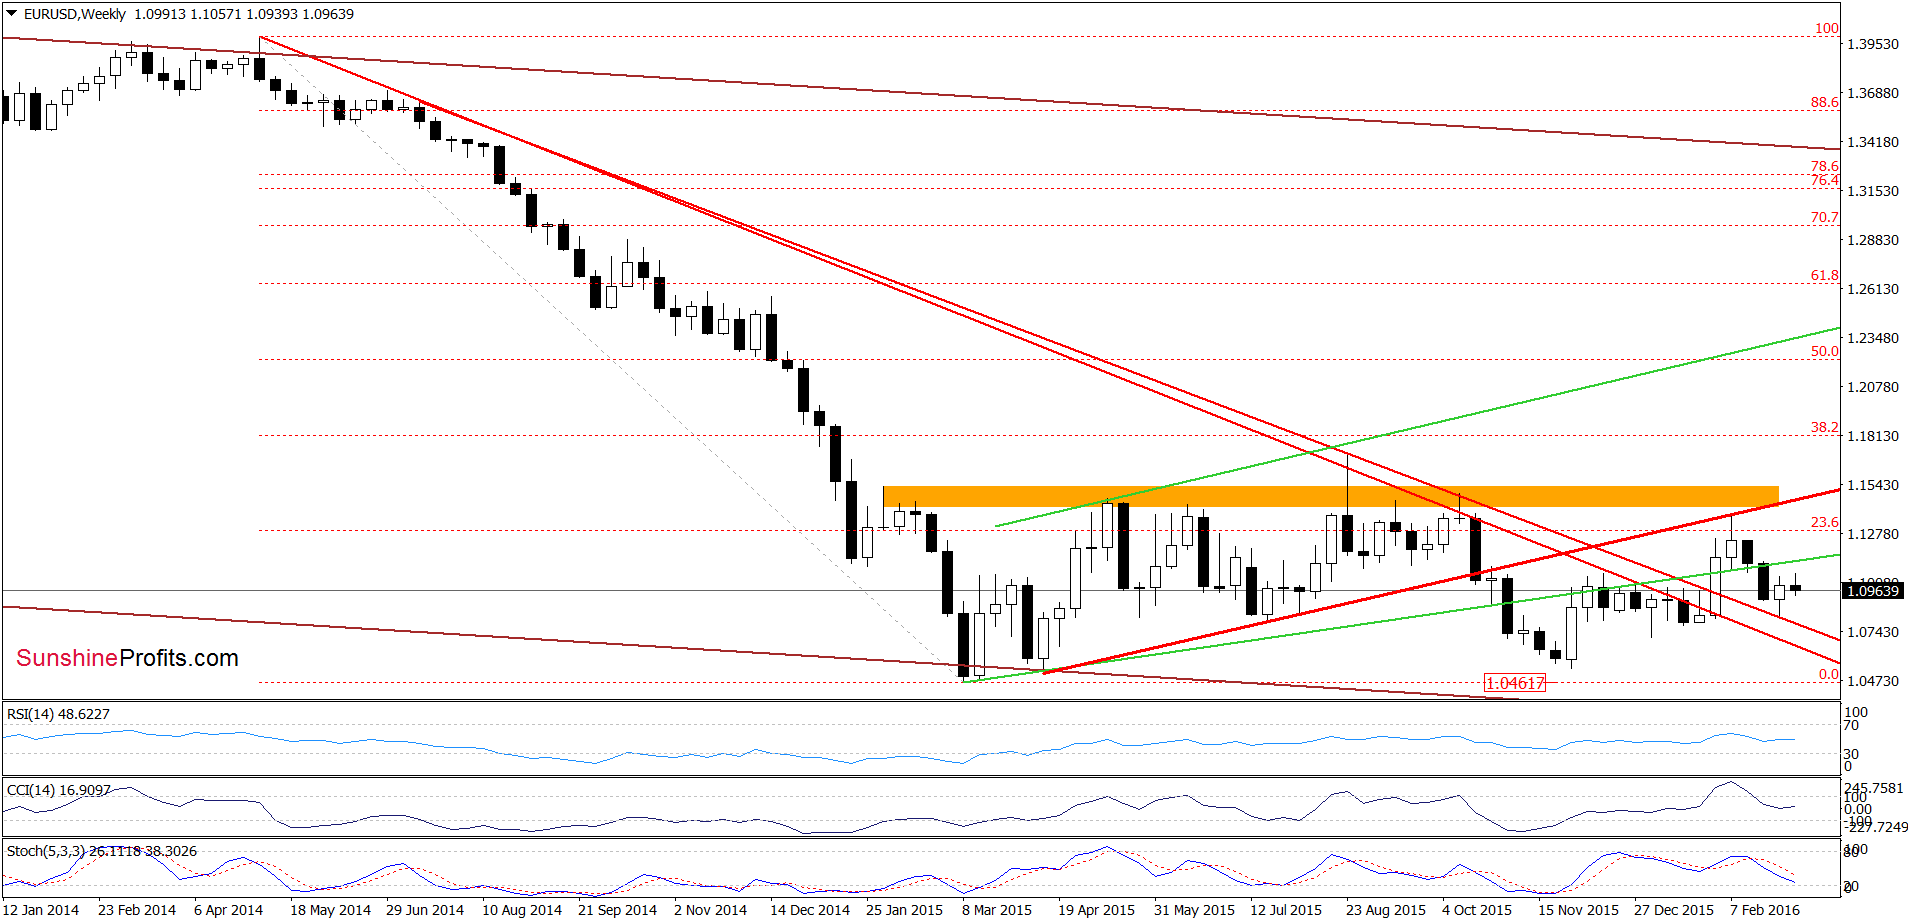
Earlier today, the euro declined against the U.S. dollar once again as uncertainty around today’s ECB decisions continues to weight on the European currency. Thanks to these circumstances, EUR/USD dropped under the barrier of 1.1000. Will we see a test of the recent lows in the coming days?
In our opinion the following forex trading positions are justified – summary:
- EUR/USD: short (stop-loss order at 1.1512; initial downside target at 1.0572)
- GBP/USD: none
- USD/JPY: none
- USD/CAD: none
- USD/CHF: none
- AUD/USD: none
EUR/USD

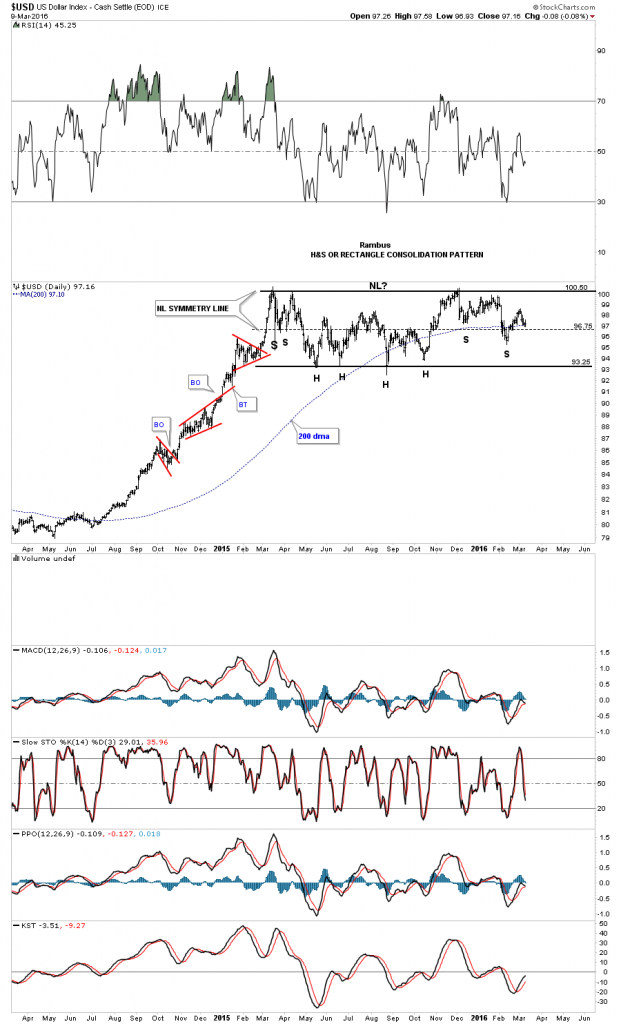
It’s been awhile since we last looked at the US dollar which has been consolidating its big impulse move up. The reason I haven’t posted it much is because it’s stuck in a sideways trading range going back over a year now.
99.9% of Market participants are either Bullish the Dollar , with all the implications including Lower Gold Prices or Bearish the Dollar, with the opposite implications .
However there are not two but THREE possible outcomes to this present trading range.
For the Bulls , the breakout is in progress with a present backtest of the bullish flag .
For the bears , if the 200 day ma fails to hold support in this general area for the bottom of a right shoulder, a move back down to the bottom of the trading range would then setup the possible rectangle consolidation pattern around the 93.25 area. The least likely, but is possible, is a huge double top if the price action breaks below the bottom rail.
The third possibility , the one most don’t consider , is a prolonged trading range. At this point I favor the sideways trading range that forms a rectangle consolidation pattern as I explain below.
Note the three smaller red consolidation patterns that formed during its big impulse move up from mid 2014 to the early part of 2015. That’s what a strong impulse move looks like. Normally in strong impulse moves you’ll see at least three smaller consolidation patterns and on rare occasions four which strongly suggests you’re getting close to the end before a much bigger consolidation pattern starts to form. As you can see that is what has taken place so far.
On the heels of eight weeks of chaotic trading in markets, today the man who has become legendary for his predictions on QE, historic moves in currencies, and major global events, just warned that a massive global money printing program is about to shock the world.
Egon von Greyerz: “Eric, gold is now in a hurry and will surprise everyone with the speed of its move. The heavily massaged and false unemployment numbers on Friday pushed gold down $20 temporarily, but 70 minutes later gold surged to new highs and then closed unchanged on the day. In my view there is now nothing that can hold back gold from going to new highs in 2016.

-
I know Mike is a very solid investor and respect his opinions very much. So if he says pay attention to this or that - I will.
~ Dale G.
-
I've started managing my own investments so view Michael's site as a one-stop shop from which to get information and perspectives.
~ Dave E.
-
Michael offers easy reading, honest, common sense information that anyone can use in a practical manner.
~ der_al.
-
A sane voice in a scrambled investment world.
~ Ed R.
Inside Edge Pro Contributors

Greg Weldon

Josef Schachter

Tyler Bollhorn

Ryan Irvine

Paul Beattie

Martin Straith

Patrick Ceresna

Mark Leibovit

James Thorne

Victor Adair