
Currency
USDCAD Overnight Range 1.3100-1.3155
ECB president, Mario Draghi was expected to deliver a doveish statement. He did and EURUSD collapsed as if the news was a surprise. More than likely, traders only paid lip service to the idea of a doveish Draghi and waited to his speech to either cut longs or get short. EURUSD was hugging 1.1310 before Mr. Draghi and plunged to 1.1160 afterwards. Mr. Draghi said that another cut in the deposit rate was being discussed (it’s already negative). His comment that the ECB is in work and assess mode was seen as an indication that stimulus action will occur in December.
Overnight, there wasn’t a whole lot of calm before the ECB storm this morning. The Skandia’s and Euro hugged yesterday’s closing levels but the other currencies did not. The Antipodean’s were antsy and Kiwi was the antsiest, apparently getting a boost from the Finance Minister’s comments on China. AUDUSD was under pressure following another bank raising mortgage rates, which could force the RBA to cut the OCR.
European markets were choppy although EURUSD stayed in a narrow range. Sterling shone on better-than-expected Retail Sales data.
The Canadian dollar performed admirably in an otherwise volatile, post ECB session but that is after the Loonie’s less than stellar performance yesterday. Retail Sales beat forecasts, rising 0.5% in August which provide a modicum for support to the currency. The outlooks for USDCAD is muddled. It is almost smack dab in the middle of the 1.2840-1.3455 trading range and being pulled in both directions, at once. On one hand, the BoC Monetary Policy Report was doveish, downgrading growth and inflation forecasts while on the other hand, the new Liberal government may provide the Loonie with a lift on its infrastructure spending plans. As usual oil is the wild card.
USDCAD technical outlook
The intraday technicals are bullish while trading above 1.3000 supported by the break of key resistance in the 1.3050-70 level. Minor resistance is seen in the 1.3140-50 area, which if broken, will extend gains to 1.3220 and target the September high of 1.3455. A break below 1.3000 would negate the upside pressure put 1.2850 back in focus. For today, USDCAD support is at 1.3080 and 1.3040. Resistance is at 1.3150, 1.3180 and 1.3220.
Todays forecast range 1.3070-1.3150
Chart USDCAD 1 hour with uptrend and resistance – Larger Chart


The US Dollar Index hit a low in 1995, a high in 2002, a low in 2008, and a recent high in 2015. Examine the following 20 year chart of the dollar.

Note that the vertical blue lines are 79 months apart and show approximate low, high, low, and high cycle extremes. I have noted the dates for the weekly low and high closes near the green and red circles.
Now look at a similar chart of the S&P from a month ago.

Dollar lows (May 95 and Mar 08) were separated by about a year from S&P lows (June 94 and March 09), and dollar highs (Feb. 02 and Mar 15) occurred near S&P highs (Aug 02 and May 15).
What else?
- The last dollar high (February 2002) was followed by about 6 years of declining dollar prices until it hit a cycle bottom in 2008.
- The S&P had already begun a decline of over 50% by the last dollar top in 2002.
- The S&P looks like it has currently begun a decline from its May 2015 top that is consistent with the dollar peak in March 2015. More QE or not, look out below!
- If that 6.5 year dollar high-low cycle continues, it suggests a dollar low in 2021. The world will be quite different after six years of dollar decline against other currencies and gold.
- Gold and silver prices will benefit from a multi-year dollar decline and a substantial correction in the S&P.
Geopolitical Fundamentals:
While Russia is bombing ISIS in Syria and consolidating their influence in the middle-east, the US bombed a hospital in Afghanistan and changed the “spin” on the story at least four times. This could be symbolic of a decline in US leadership and political influence in the middle-east and the beginning of a long-term decline in the US dollar.
China has initiated a global alternative to the SWIFT system – the China International Payments System (CIPS). This will weaken US global financial control and weaken the US dollar influence on global trade and other economies.
US official national debt exceeds $18 Trillion and unfunded liabilities are perhaps $100 – $220 Trillion. This is a problem – truly an understatement. However, we are now in the “silly season” when we elect a new president, so publicly speaking about honest accounting, a reasonable tax law, balanced budgets, and sane financial policies has been banned at least until 2017. Uncontrolled spending, massive and ever-increasing debt, unaddressed structural problems, and lack of political leadership also suggest a continued decline in the dollar.
Support for the US dollar has been based on the “petrodollar” – required purchases of crude oil with dollars – and the US military – accept US Treasury debt in exchange for your goods and oil or face consequences. Both of these supports for the dollar are clearly weakening, and that indicates additional dollar decline, or collapse, in the years ahead.
BOTTOM LINE:
- Expect continued US dollar weakness for several years.
- Expect stock and bond markets to “regress to the mean” – substantially lower.
- Expect gold and silver prices to benefit from dollar weakness and US geopolitical difficulties. $5,000 gold will not happen this year but it is quite possible by the election in 2020. Much higher prices are likely if central banks and governments choose to push the US into a hyperinflationary collapse.
- And finally, buy gold and silver while supplies at these repressed prices (thank you TBTF banks) are still available.
Read:
Investment Research Dynamics Scandal in Paper Gold/Silver
Goldman Sachs Welcome to the 3rd Wave
Bill Holter What Will Happen To Silver and Gold
Gary Christenson
The Deviant Investor

USDCAD Overnight Range 1.2905-1.2950
The Canadian dollar dipsy-doodled within a narrow trading band in a fairly subdued overnight session and continued the pattern when New York walked in. The first move lower found support and USDCAD quickly climbed to test resistance at 1.2950 as US dollar demand vs. the majors resumed and WTI prices declined.
The day had a promising start when China reported that Q3 GDP was 6.9%, beating the forecast of 6.8% but a tick below the official target of 7.0%. At first blush, traders liked the news but quickly realized, that it was China, and therefore, the data result was suspect.
The European session was reportedly dull. EURUSD headed lower which could be a bit of position adjustment ahead of the ECB meeting later this week. USDJPY traders bought yen after starting to reconsider the prospect of further Japanese stimulus any time soon, following the BoJ governor’s speech and other official comments.
Canadian’s are voting today and have a choice of three beef entrée’s on the menu. One is over-cooked, one is blue-rare and the third is tofu. And all are suffering from a variation of mad-cow disease.
As for the Loonie, the short term results may not have much of an impact but it is hard to see a Liberal majority government with the tax and spend platform being good for the Canadian dollar.
USDCAD technical outlook
The intraday USDCAD technicals are bearish while trading below 1.2950 but downside probes have failed to break below the uptrend line from May which resides at 1.2840. The intraday technicals are mixed while trading between 1.2890 and 1.2950. A move below 1.2890 will lead back to 1.2840 while a break above 1.2950 targets 1.3010.
Today’s forecast range 1.2905-1.2950
Chart USDCAD 30 minute with intraday resistance highlighted – Larger Chart


On the short term the US Dollar is rising against the Euro, which is sliding from a recent peak. The reasons a short sale is recommended for technical reasons was explained last thursday in full HERE by Nadia Simmons. Since then the Euro has fallen from 1.149 to 1.131 as of 7am PST today.
The longer term fundamental reasons for the US Dollar rise against the Euro are laid out by Visual Capitalist HERE
Short summaries of both analyses are below – Editor Money Talks

“Looking at the daily chart, we see that EUR/USD extended gains above the barrier of 1.400 and the 50% Fibonacci retracement, which resulted in a rally to the 61.8% Fibonacci retracement and the brown resistance line. Taking into account these resistance levels and the current position of the indicators (a negative divergence between the CCI and the exchange rate, the Stochastic Oscillator above the level of 80) we think that reversal is more likely than not.
Very short-term outlook: bearish
Short-term outlook: bearish
MT outlook: mixed with bearish bias
LT outlook: mixed”
…..for larger chart and more long term analysis go HERE
The Fall of the Mighty Euro
by The Visual Capitalist
The euro itself has dropped precipitously, particularly in terms of USD but also in terms of GBP and CNY. In the beginning of 2008, a US dollar could buy only €0.65 euros. Today, on average through 2015, one US dollar can buy €0.91 euros.
….click on the image or HERE for a larger view and more analysis:


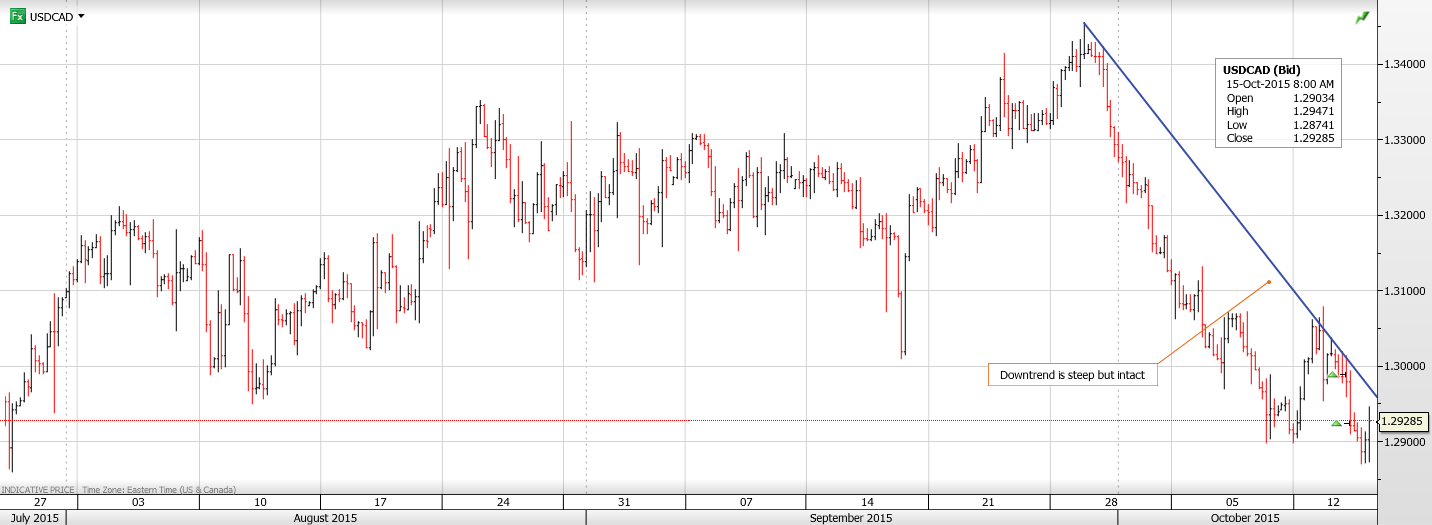
USDCAD Overnight Range 1.2875-1.2947
The US dollar attempted to rally following this morning’s ever so modest improvement in CPI (Core Actual 0.2% vs. forecast of 0.1% gain) and a small drop in Jobless claims. However the gains were short lived and the dollar sellers quickly returned.
Overnight, the story was the same except for the dollar rally part.
The Canadian dollar soared like Jose Bautista’s game winning seventh inning stretch, in another lively overseas FX market.
It started in Asia. The dollar continued to free-fall when Asian traders started their day, continuing the move at the end of the New York day. AUDUSD climbed despite weak employment data and renewed calls for a rate cut. Kiwi stayed bid while USDJPY headed lower even as the Nikkei rallied.
In Europe, EURUSD retreated from its peak on doveish talk from an ECB official even though his comments were nothing new.
USDCAD direction is tied to US dollar direction against the majors and right now that direction is down. US dollar bears cite falling US Treasury yields, long dollar squeeze, soft US data and the perception of US rate hikes being pushed well into 2016 for the selling.
The USDCAD drop is beginning to look overdone, especially considering that WTI prices are currently testing minor support at $4575, which if broken suggests a steeper decline tow the $44.00/barrel area.
USDCAD technical outlook
The intraday USDCAD technicals are bearish while trading below 1.2950 looking for a break of 1.2840 to extend losses to 1.2650. The move below 1.2900 broke both the 100 day moving average and the low following the July BoC rate cut. For today, USD Support is at 1.2875 (overnight low) 1.2840 and 1.2810. Resistance is at 1.2950 and 1.2980
Today’s Range 1.2875-1.2950
Chart USDCAD 4 hour with downtrend Larger Chart

-
I know Mike is a very solid investor and respect his opinions very much. So if he says pay attention to this or that - I will.
~ Dale G.
-
I've started managing my own investments so view Michael's site as a one-stop shop from which to get information and perspectives.
~ Dave E.
-
Michael offers easy reading, honest, common sense information that anyone can use in a practical manner.
~ der_al.
-
A sane voice in a scrambled investment world.
~ Ed R.
Inside Edge Pro Contributors

Greg Weldon

Josef Schachter

Tyler Bollhorn

Ryan Irvine

Paul Beattie

Martin Straith

Patrick Ceresna

Mark Leibovit

James Thorne

Victor Adair