
Currency
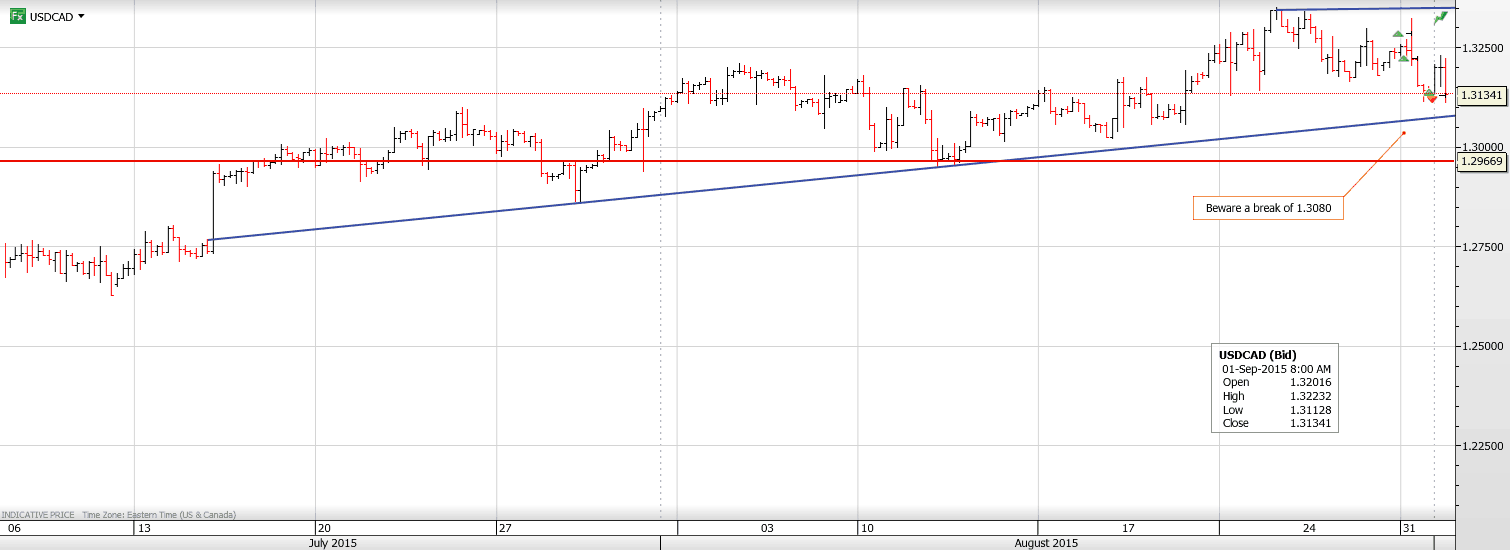
USDCAD Range 1.3120-1.3220
Canadian Q2 GDP posted a negative 0.5%. It is the second consecutive negative quarter, so for many, Canada is in a technical recession. While it’s not good news, it wasn’t unexpected. What was unexpected was that glimmer of hope, a 0.5% rise in real GDP for June that like the first buds in spring, says growth may be on the way.
USDCAD traders agreed, sort of. The initial reaction saw the currency pair collapse from 1.3210 to 1.3120 in the blink of an eye. It has subsequently bounced, but in a disinterested way as traders wrestle with concerns over China and whether the oil rally is sustainable. Today’s data has also managed to whet the appetite for the prospect of a stronger than expected Canadian employment report.
Overnight, FX markets were startled by news that both China PMI releases (NBS and Caixin) were below 50, renewing concerns of a deeper economic slowdown. Then, FX markets nearly soiled themselves when the weak PMI data was followed by news from the Peoples Bank of China (PBoC) that effective October 15, banks would be required to hold 20% reserve on FX forwards. (no interest would be paid). Taken together, the news was seen as further evidence of China’s economic woes.
Meanwhile, in Australia, the RBA left rates and the statement unchanged. London came back from a three-day weekend, looked at the weak global equity markets and the China stories then decided that cutting risk was an appropriate strategy. EURUSD is also vulnerable to doveish speculation ahead of Thursday’s ECB meeting.
Today’s ISM manufacturing report (forecast 52.6) may give the US dollar a boost if it is higher than expected.
Technical Outlook
The intraday technicals are bearish while trading below 1.3230 risking and looking for a test of 1.3080 which represents the rising trendline from the July BoC rate cut. A move below 1.3080 warns of a deeper setback to 1.2950-1.3000. For today, USDCAD support is at 1.3120 and 1.3080. Resistance is at 1.3180 and 1.3230
Today’s Range 1.3250-1.3350
Chart: USDCAD 4 hour chart with uptrend support noted Larger Chart

My alternative Big Mac Index is screaming that these currencies are cheap
 Spoleto, Italy
August 31, 2015
If you’ve ever picked up a copy of The Economist magazine, you’ve probably heard of the Big Mac Index.
This is an interesting tool where a bunch of reporters from around the world are forced to go into McDonalds and find out the price of a Big Mac in local currency.
In Santiago, Chile, for example, a Big Mac runs 2,100 Chilean pesos, which is around $3. Meanwhile the average price for a Big Mac in the United States is $4.79.
This suggests that the US dollar is substantially overvalued against the Chilean peso.
It’s the same story across most of the world. In Russia, a Big Mac costs 107 rubles, which is just over $1.50.
The reason The Economist uses the Big Mac is because it’s basically the same product no matter where you go in the world.
There are some subtle differences, but McDonalds generally serves the same pink foam disguised as beef wherever you go. So in theory it should all cost the same.
When a Big Mac is too cheap or too expensive, this suggests that the currency is either undervalued or overvalued against the US dollar.
Now I’d like to add a new way of comparing currencies: airfare.
As I travel around the world, I often buy what are known as round-the-world tickets (RTW).
RTW tickets are issued by airline alliances like OneWorld or Star Alliance, and they’re typically very cost effective.
RTW is just like it sounds. You fly, for example, from London to Chicago to Shanghai to Dubai and back to London, all for one special fare.
It’s a cheap, easy way to see the world.
But I’ll let you in on a little secret that I’ve picked up over the years: the price of a RTW ticket varies dramatically depending on the city where you start.
As an example, I just researched a OneWorld RTW ticket with the following itinerary:
Los Angeles – Sydney – Bangkok – Hong Kong – Johannesburg – London – Los Angeles.
Six different cities around the world on five continents.
Now, if I start and stop that itinerary in Los Angeles, the price for a business class ticket is $14,164.60.
That’s not a bad price for a business class experience. But if we experiment a little bit, something interesting happens.
Starting and stopping the journey in Los Angeles means that OneWorld prices my ticket in US dollars.
But it’s also possible to fly the same route by shifting the cities. For example, instead of starting/stopping in LA, I can start/stop in Sydney.
So the route becomes Sydney- Bangkok – Hong Kong – Johannesburg – London – Los Angeles – Sydney.
It’s the same flights to the same six cities, I just start/stop in a different place.
Here’s what’s crazy: if I start/stop in Sydney instead, the price changes. Now instead of $14,164.60, it’s $15,272 Australian dollars, which is about $10,900 USD.
So the same six flights now cost you 23% less.
Note that the RTW ticket is always priced in the local currency of the city where you start.
And unlike the Big Mac Index where the results are skewed by the costs of ingredients, property, and labor, here you’re comparing the exact same product.
I did the same with each city on the list, and the most incredible difference came when I started and stopped the trip in Johannesburg.
Johannesburg – London – Los Angeles – Sydney – Bangkok – Hong Kong – Johannesburg.
Flying to the exact same cities, the price is now 81,395 South African Rand.
Based on current exchange rates, this is just barely over $6,000.
In other words, you pay over $14,000 by starting/stopping in LA, and just $6,000 to start/stop in South Africa, even though you’re visiting the exact same six cities on the exact same flights in the exact same business class cabin.
What’s even more amazing is that if you do the exact same itinerary from LA in economy class, the price is $7,545.
So that means that if someone flies from LA, they’ll pay more to fly in coach than someone starting in Johannesburg pays to fly in business.
Clearly, you’d be better off buying a separate ticket to South Africa and beginning your RTW journey from there.
Or you could spend about $200 and get a ticket to Vancouver, and start a RTW from Vancouver, which costs about $10,000 in business class and gives you a $4,000 savings.
Now, I’m not here to tell you about how to save money on airfare (though I hope you give it a try).
The bigger idea is that it’s clear that the US dollar is painfully overvalued against nearly every currency in the world.
Right now the dollar appears to be the “safe” place to put your money. However, this isn’t based on anything.
The fundamentals for the US dollar are terrible, but people keep dumping money into it like trained monkeys simply because nothing else in financial markets makes any sense.
To be clear, I fully expect the dollar to get even stronger as even more trained monkeys pile into US dollar assets.
But it’s important to show that this perception of ‘safety’ is based on a complete myth. Every credible fundamental suggests that the dollar is dangerously overvalued.
In the long run these things tend to equalize, and the dollar’s strength may end up being the biggest bubble of all.
Of course, it raises the question– if not the US dollar, then which currency is the safe haven? The euro is garbage, the Chinese are fighting a depression, Japan is a disaster.
And that’s precisely the point.
When every option in the financial system is grounded in absurdity, the only solution is to start looking for safety outside of it.

Recommendation: EUR/USD: short (a stop-loss order at 1.1445; the downside target around 1.0938)
Although the University of Michigan showed that its index of consumer sentiment slipped to 91.9 this month from 92.9 in July, positive data from the U.S. Bureau of Economic Analysis (which showed that the goods trade deficit narrowed to $59.12 billion in the previous month) in combination with rising U.S. personal spending and U.S. personal income supported the greenback. Thanks to these circumstances, the USD Index climbed above the level of 96. What impact did this increase have on our six currency pairs?
In our opinion the following forex trading positions are justified – summary:
- EUR/USD: short (a stop-loss order at 1.1445; the downside target around 1.0938)
- GBP/USD: none
- USD/JPY: none
- USD/CAD: none
- USD/CHF: none
- AUD/USD: none
EUR/USD

….for larger charts and all of the currency pairs and analysis go HERE

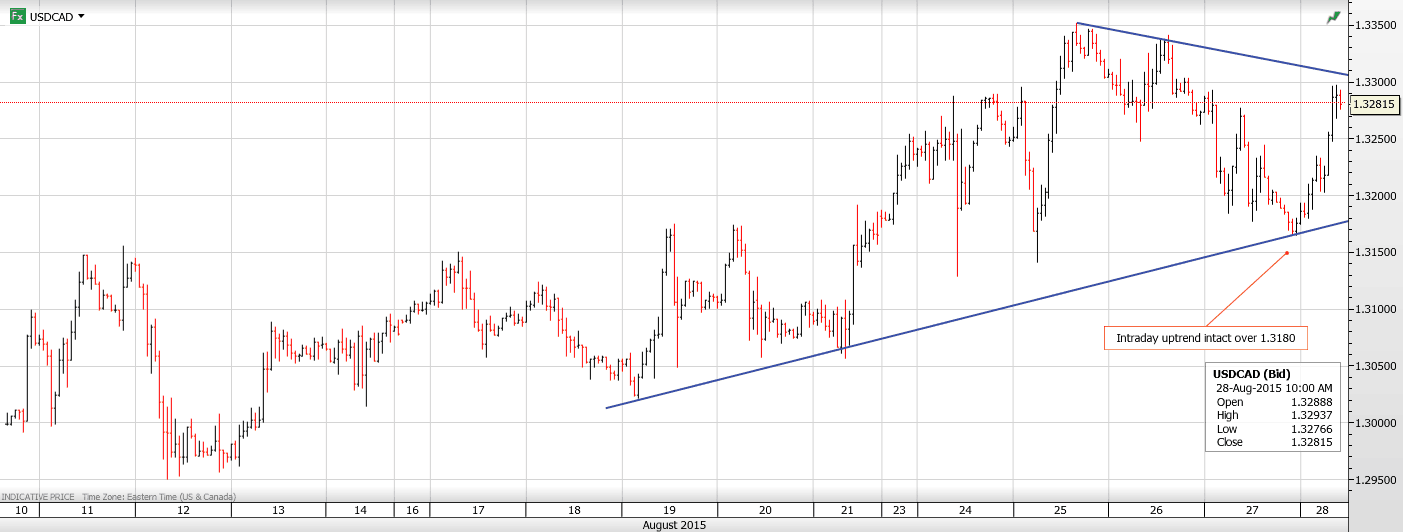
USDCAD Range 1.3170-1.3298
USDCAD is flirting with levels not seen since June 2004 and we can thank former drama teacher, Justin Trudeau for that. Even though the Liberal government hasn’t been in power since 2006, and their chances this year are slim, news headlines trumpeting Trudeau’s plan for 3 years of $10 billion deficits doesn’t inspire confidence in a currency already beaten up by low oil prices.
Overnight, G-7 currency volatility diminished as Asian equity indices moved higher and closed the week on a firm footing. That wasn’t the case in Europe. European equities are down and a slew of economic releases failed to inspire FX trading.
The Chinese market sell-off that created a mini-market meltdown across the globe is fading from memory as the focus shifts to the Jackson Hole Symposium. This meeting is garnering a lot of attention because pundits believe that the Fed Vice Chair, Stanley Fischer will use the forum to provide additional clarity surrounding a September rate hike. Don’t bet on it. Next Friday’s nonfarm payrolls report will be key to determining lift-off.
Technical Outlook
The intraday technicals are bullish. The move back above 1.3240 snapped a downtrend and renewed the upward bias with an initial target of 1.3350 and then 1.3450. The short term uptrend from June remains intact above 1.3140. For today, USD support is at 1.3240 and 1.3190. Resistance is at 1.3310 and 1.3350.
Today’s Range 1.3160-1.3240
Chart: USDCAD 1 hour Larger Chart
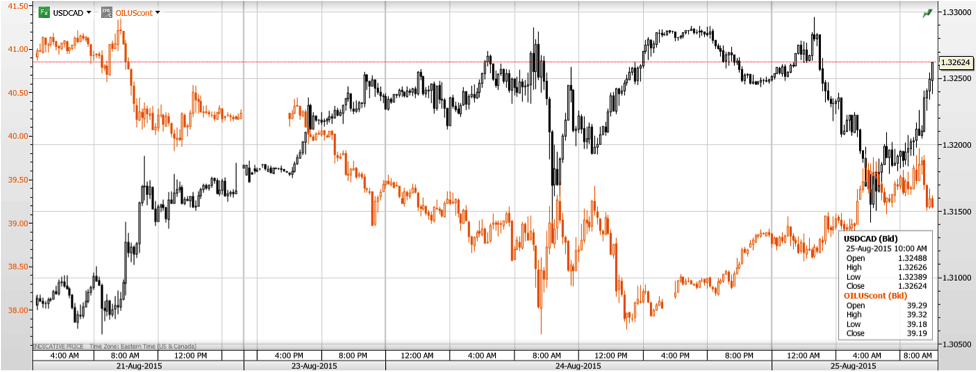
USDCAD Range 1.3148-1.3296
The world didn’t end after all. Yesterday’s financial market madness is today’s sober second thought. The debate is still raging but market price action appears to suggest the moves were a much needed correction of positions that had become excessively one-way. In currencies, that would be EUR and JPY. Both of those pairs have stabilized.
The Chinese equity market price collapse kicked off this week’s global financial panic so it was only fitting that Chinese authority’s stepped up to the plate to help alleviate concerns. In a better-late-than-never move, the Peoples Bank of China (PBoC) cut the Reserve Requirement (RR) by 50bps and the 1 year benchmark lending rate by 25 bps to 4.69% early this morning. S&P futures have rallied on the news and the Dow Jones Industrial Average jumped 320 points at the open.
Yesterday’s market volatility managed to reduce the odds of a September rate hike by the Fed and today’s disappointing US data probably reinforced that view. The FHFA House Price Index printed 0.2% vs forecast of 0.4%
USDCAD has been trading exceedingly choppily since New York walked in, tracking WTI price movements almost tick for tick. The outlook for WTI prices is negative which will limit any Canadian dollar gains.
Technical Outlook
The intraday technicals are bullish while trading above 1.3050 looking for a retest of the overnight peak at 1.3296 and then 1.3450. A move below 1.3040 would suggest that a short term high is in place and target 1.2950. For today, USDCAD support is at 1.3150, 1.3120 and 1.3080. Resistance is at 1.3220, 1.3260 and 1.3310
Today’s Range 1.3170-1.3270
Chart: USDCAD and WTI 10 minute chart showing tick for tick price movement

-
I know Mike is a very solid investor and respect his opinions very much. So if he says pay attention to this or that - I will.
~ Dale G.
-
I've started managing my own investments so view Michael's site as a one-stop shop from which to get information and perspectives.
~ Dave E.
-
Michael offers easy reading, honest, common sense information that anyone can use in a practical manner.
~ der_al.
-
A sane voice in a scrambled investment world.
~ Ed R.
Inside Edge Pro Contributors

Greg Weldon

Josef Schachter

Tyler Bollhorn

Ryan Irvine

Paul Beattie

Martin Straith

Patrick Ceresna

Mark Leibovit

James Thorne

Victor Adair