
Currency
USDCAD Range 1.3180-1.3270
FX markets remain skittish a few hours after New York traders walked in. Oil prices are trading heavy, US stock futures are soft and there aren’t any US data releases to put a bridge over troubled waters. That should keep USDCAD pointing higher for the balance of the day. So much for a sleepy Monday morning.
It was a panic driven overnight market. USDCAD smashed through resistance in the 1.3200-10 area and continued to climb, finally running out of gas at 1.3270. The Shanghai Composite Index plunged 8.5%, sparking a risk-aversion stampede which boosted EUR and JPY while crushing commodity bloc currencies.
European equity indices and US stock futures sank in sympathy with the Chinese moves which doesn’t bode well for North American equity markets, today. Has Global Warming caused equity market panics to move to August from October? Ask Al Gore.
An equity market rout triggering a global economic slowdown is only part of the reason for Canadian dollar weakness. The break of the psychological $40.00/bb in WTI has opened the door for USDCAD to visit the 61.8% retracement of the 2002-2007 range which is at 1.3440.
Technical Outlook
The intraday technicals are bullish following the break above the previous high of 1.3203 which targets further gains to 1.3450. There isn’t much in the way of resistance between 1.3240 and 1.3350. A break below the 1.3210-20 area suggests a steeper drop to 1.3170-80, a short term buy zone. For today, USDCAD support will be at 1.3220 and 1.3180. Resistance will be at 1.3290 and 1.3350
Today’s Range 1.3220-1.3320
Chart: USDCAD showing uptrend and break of August top. Larger Chart


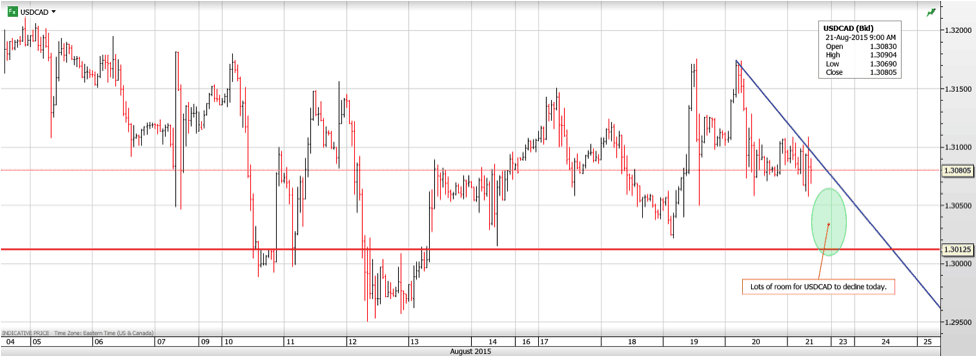
USDCAD Range 1.3063-1.3109
USDCAD soared and swooned (relatively speaking) on this morning’s release of Canadian CPI and Retail Sales reports. CPI was as expected and Retail Sales had a modest beat. The data, combined with general US dollar weakness vs. G-7 currencies, excluding AUD, has allowed USDCAD managed to scratch out a small gain despite a soft WTI price.
The China August Caixin Manufacturing PMI came in at 47.1 providing further evidence that the Chinese economy was contracting which set the tone for a nervous overnight trading session.
The outlook for WTI prices is negative. Yesterday, the American Petroleum Institute reported that the U.S pumped crude at the fastest pace for a month in July, with American stockpiles about 100 million barrels above the five year seasonal average. That is not good news for the Loonie.
However, if WTI prices remain above $40.00b., USDCAD’s continued failure to break resistance in the 1.3160-80 area may lead to short term traders tossing in the towel on bullish strategies. Do not be surprised to see a Friday profit taking sell-off which may lead to another probe of support at1.3000 by the end of the day.
Technical Outlook
The intraday technicals are modestly bearish within a 1.3000-1.3200 range, looking for a break of 1.3050 to extend losses to 1.2990-1.30000. A break of this level projects a further dip to the 1.2940-60 area. A decisive break of 1.3200 is needed to put the focus on 1.3450
Today’s Range 1.3010-1.3110
Chart: USDCAD 1 hour Larger Chart

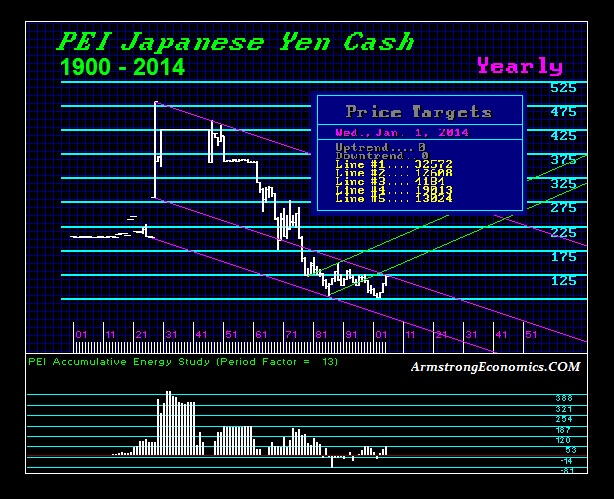
The Japanese yen has peaked against the dollar. The dollar in fact elected a YEARLYBullish Reversal at the end of 2014. This is yet another confirmation that we are facing a strong dollar ahead ushering in this age of DEFLATION, which should start to hit in the USA after October. This is impacting everything not the least of which has been commodities and interest rates as hoarding cash rises. While the commodity bulls have kept touting China from every angle since their consumption reached almost 50% in 2011 of total world output, China’s economy entered a recession with 2007 and despite the recent reaction stock rally, we are also witnessing investment outflows from China. Massive borrowing in Hong Kong and taking the cash back to China masked the trade flows hiding the real trend because people just look at money and not actual trade. As the dollar rises, this helps to extend the deflationary trend in commodities but it also will place pressure on their dollar foreign loans.
No degree of austerity by the ECB will reverse the economic decline in Europe. Socialism has reduced Europe from a major economic power to a shadow of its former self. The bulk of the money supply today is DEBT, not actual currency. Artificial manipulation to inspire austerity fuels deflation and will never achieve a reduction in inflation that Germany is so terrified of these days. The idea of creating money is only the old-school concept of monetary inflation whereas today the bulk of money creation is actually debt. This is not something that can even be PAID off, whereas the only outcome is default.
The global deflationary trend is thus alive and well as we can see reflected in even the Japanese yen. Those who keep touting the hyperinflation scenarios and the collapse of the dollar only looking at the United States, are blind to the global trend. The dollar has elected a YEARLY BULLISH REVERSAL against the Japanese yen and that confirms the dollar rally and the continued deflation and additional signals this year will confirm this trend into 2016.
….more from Martin:
Does China’s Devaluation Reduce the Odds of the Fed Raising Rates?

USDCAD Range 1.2957-1.3055
USDCAD traded higher in early Asia on news that USDCNY fixed 1.6% higher.The initial move proved wrong and USDCAD started to decline, accelerating on the break of 1.3105 and then the after-burners kicked in on the break of 1.3060. From there it was a straight shot down to just below 1.2960 before profit takers emerged to drive the currency pair above 1.3000 again.
Elsewhere, the US dollar retreated across the board against the G-10 currencies with CHF gaining 1.55%.There isn’t any clear reason for the moves. China maintains the devaluation was a one-off but it appears the rest of the world is a tad sceptical. More than likely, a lack of top tier data from the US and increased uncertainty around a September rate hike led to long US dollar positions getting cut.
USDCAD traders need to keep their eye on the ball, or more specifically, WTI prices. WTI is still in a downtrend and not far from the 2015 low. The International Energy Agency released a forecast stating that the oil oversupply will persist through 2016.
Technical Outlook
The intraday technicals are bearish while trading below 1.3030 with the break of support at 1.2960 opening the door for a deeper correction to 1.2800-50. A move back above 1.3030 would negate the downside pressure. For today, USDCAD support is at 1.2940, 1.2910 and 1.2880. Resistance is at 1.3010 and 1.3040.
Today’s Range 1.2960-1.3030
Chart: USDCAD hourly with intraday support Larger Chart

For a larger version of this infographic, click here.

Predicting the future isn’t easy. For example, in 1977 it was predicted by Ken Olsen, a well-known tech entrepreneur at the time, that “There is no reason for any individual to have a computer in his home.”
It was not only an inaccurate prediction, but decades later the exact opposite has happened. Billions of computers now fit in our homes and our pockets. Even refrigerators, thermostats, and alarm clocks are armed with computers that connect to us as the Internet of Things grows exponentially.
As a result, we should take any forward-looking guesses with an open mind and a light heart.
In this visualization, Envisioning.io looks at the historical relationship between currencies and technology. The graphic also looks forward to the future of trade, where new applications of technology may change and expand the ways our financial system works.
Importantly, the visualization also makes the distinction between the different types of networks that encompass currency and trade. Centralized networks are where nodes connect through dense centres that support the connected few, such as governments and banks. Decentralized networks are where nodes connect in clusters under no centralized authority. These networks favour the selective individual and give rise to things such as stock markets. Lastly, there is the distinction of distributed networks, where network nodes connect independently. This is what has enabled bitcoin and cryptocurrencies, where the whole of the network is reinforced and supported.
There are several topics covered here that we have looked at in the past in much more depth. Most recently, we showed the opportunity in mobile and electronic payments, the evolution of US currency, and also how cryptocurrencies could disrupt the financial system. We’ve also covered precious metals in depth with our goldand silver series.
Original graphic by: Envisioning

-
I know Mike is a very solid investor and respect his opinions very much. So if he says pay attention to this or that - I will.
~ Dale G.
-
I've started managing my own investments so view Michael's site as a one-stop shop from which to get information and perspectives.
~ Dave E.
-
Michael offers easy reading, honest, common sense information that anyone can use in a practical manner.
~ der_al.
-
A sane voice in a scrambled investment world.
~ Ed R.
Inside Edge Pro Contributors

Greg Weldon

Josef Schachter

Tyler Bollhorn

Ryan Irvine

Paul Beattie

Martin Straith

Patrick Ceresna

Mark Leibovit

James Thorne

Victor Adair