
Currency
USDCAD Range 1.3155-1.3194
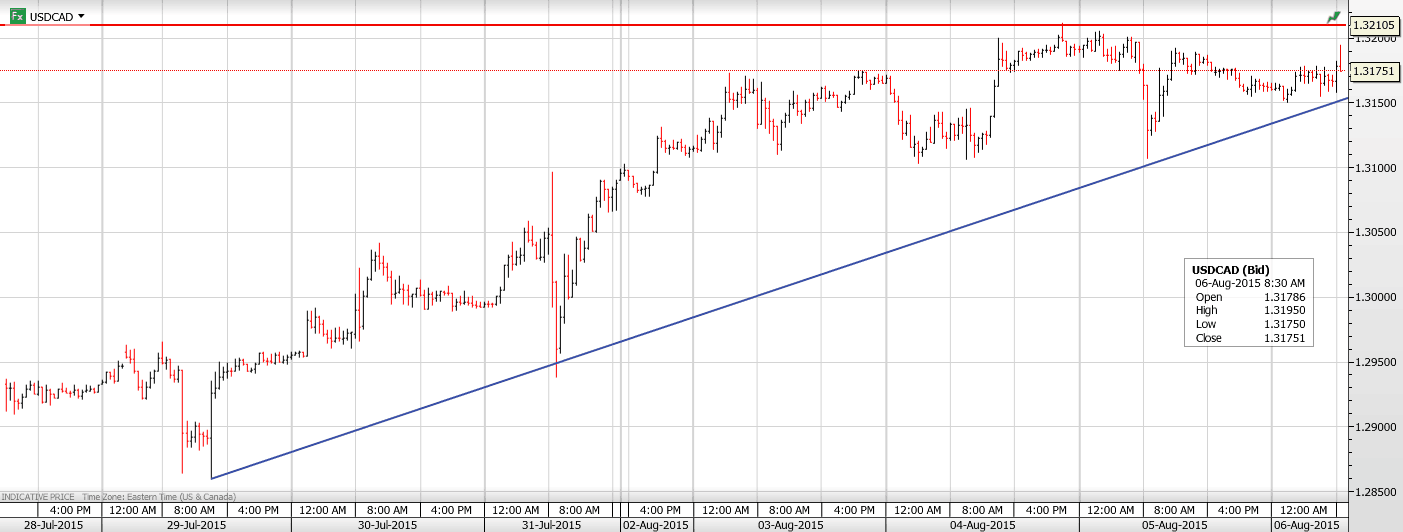
USDCAD drifted within a narrow range overnight, unable to extend gains above 1.3200 and unwilling to retreat. The USDCAD strength is impressive in the face of yesterday’s greatly improved Canadian trade report which may be seen as a sign the domestic economy can be taken off of life support. On the other hand, the data is over a month old and traders are more focussed on the slide in oil prices. A break below $42.00/00 could turn nasty for both oil and the Loonie. Today’s Jobless claims report was close to forecasts and a non-event
Australia was the story in Asia but only briefly. A jump in job gains gave AUDUSD a short term boost which was quickly reversed without any apparent reason. USDJPY continued to flirt with 125.00.
GBPUSD got crushed in early New York trading. The MPC vote to keep monetary policy unchanged was widely expected to be 7-2 (some even thought 6-3) after Mark Carney’s hawkish comments on July 17th. The 8-1 result caught the market long Sterling and positions were quickly cut. GBPUSD plunged from 1.5625 to 1.5470 in minutes.
Canadian and US. employment reports are due tomorrow which is enough incentive for traders to sit on the sidelines, ensuring a quiet day ahead.
Technical Outlook
The intraday technicals are bullish while trading above 1.3150 with a break of 1.3200 likely to extend gains to 1.3300. A break of intraday support at 1.3150 will lead back to 1.3110. Longer term, the USDCAD uptrend remains intact above 1.3005. For today, USD support is seen at 1.3150 and 1.3110. Resistance is at 1.3210 and 1.3240
Today’s Range 1.3150-1.3205
Chart: USDCAD 30 minute with uptrend and resistance shown Larger Chart

 Yves here. Get a cup of coffee. This is a detailed account of the long and tortured history of budget fakery in Greece and how it is has been aggressively defended by successive Greek governments. A tidbit from the post: one section is labeled “When revising wrong statistics is treason.”
By Sigrún Davídsdóttir, an Icelandic journalist, broadcaster and writer. She has earlier written on what Icelandic lessons could be used to deal with the Greek banks.
The word “trust” has been mentioned time and again in reports on the tortuous negotiations on Greece. One reason is the persistent deceit in reporting on debt and deficit statistics, including lying about an off market swap with Goldman Sachs: not a one-off deceit but a political interference through concerted action among several public institutions for more then ten years….. CLICK HERE to read the complete article

The whole “market economy” thing is turning out to be a little trickier than China’s dictators expected. To set up the story: After the 2008 crash the country borrowed about $15 trillion (an amount that dwarfs the US Fed’s quantitative easing programs) and spent the proceeds on history’s biggest infrastructure program.

This pushed up the prices of iron ore, oil, copper, etc., igniting a global commodities boom. Then China liberalized its stock trading rules, setting off a stampede into local equities that doubled prices in less than a year. The result is a classically unbalanced economy, with massive physical malinvestment, overpriced financial assets and way too much debt.
The inevitable crash began in June, and Beijing responded by tossing about 10% of GDP into equities to stop the bleeding. This worked, as such interventions tend to do, for a while. But last night it failed:
Chinese shares tumble 8.5 percent in biggest one-day drop since 2007
(Reuters) – Chinese shares slid more than 8 percent on Monday as an unprecedented government rescue plan to prop up valuations ran out of steam, throwing Beijing’s efforts to stave off a deeper crash into doubt.
Major indexes suffered their largest one-day drop since 2007, shattering three weeks of relative calm in China’s volatile stock markets since Beijing unleashed a barrage of support measures to arrest a slump that started in mid-June.
“The lesson from China’s last equity bubble is that, once sentiment has soured, policy interventions aimed at shoring up prices have only a short-lived effect,” wrote Capital Economics analysts in a research note reacting to the slide.
The CSI300 index .CSI300 of the largest listed companies in Shanghai and Shenzhen tumbled 8.6 percent to 3,818.73 points, while the Shanghai Composite Index .SSEC lost 8.5 percent to 3,725.56 points.
China’s market gyrations have stoked fears among global investors about the broader health of the world’s second biggest economy, hitting prices of growth-sensitive commodities such as copper, which fell on Monday to not far from a 6-year low.
Devaluation time?
While the prices of commodities and equities have been bouncing around, China’s currency, the yuan, has been relatively stable in US dollars, because the government pegs the former to the latter.
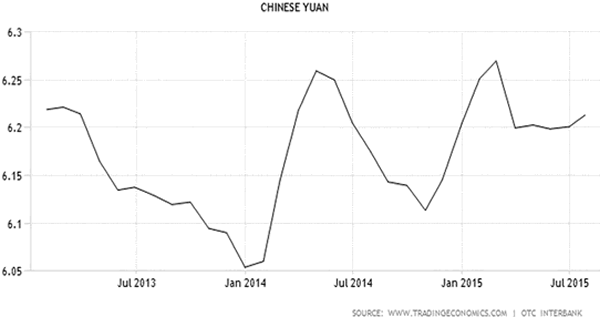
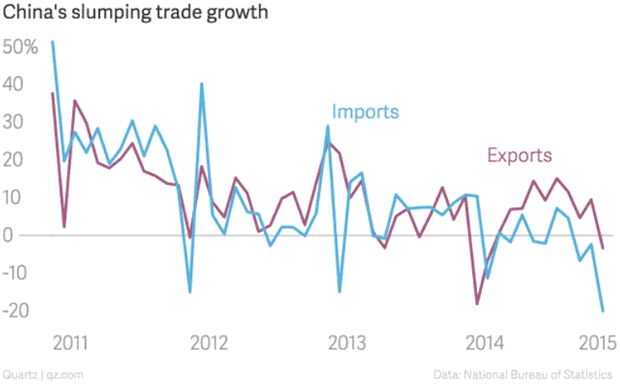
But because the dollar is way up against virtually every other currency, so is the yuan, which is a major cause of today’s crisis. Other things being equal, a rising currency makes exports more expensive and slows growth, and China’s trade has responded exactly as theory predicts:
So here’s the dilemma: A too-strong currency is making it impossible for China to service its excessive debts, which is contributing to a bear market in equities, which further slows the economy and makes it even harder to service debts, and so on.
This probably seems like uncharted territory to the central planners, but is actually a pretty standard problem — for which the traditional solution is to devalue and stiff your creditors by repaying debts with cheaper currency. The US did it in the 1970s, Europe is doing it now with the euro’s recent steep decline, and much of Latin America is in various, mostly disorderly, stages of the process.
Put another way, the world is following the standard currency war script, in which countries take turns devaluing, reap modest temporary benefits, and then give up those gains when their trading partners respond in kind. China’s coming devaluation, however, will be a much bigger deal than most.

USDCAD Overnight Range 1.2995-1.3040
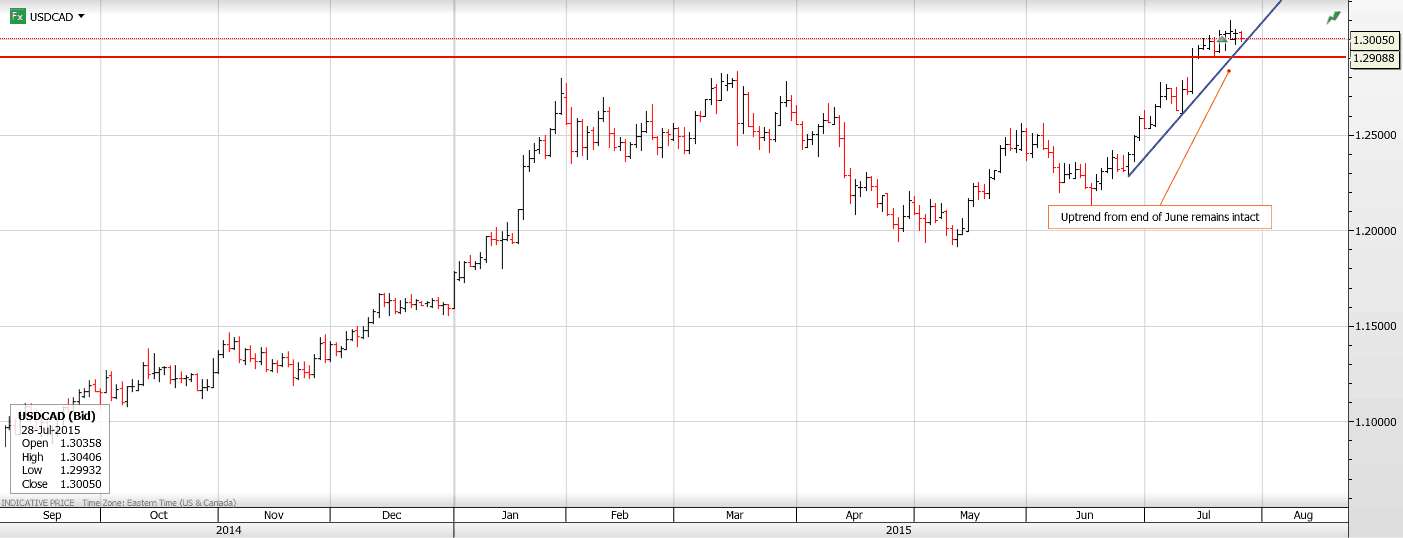
The commodity bloc currencies, (AUD, NZD, CAD) were the big gainers overnight, although the Loonie’s gain was rather shy of impressive. In fact it was just a tiny gain. News that both China Securities Regulatory Commission (CSRC) and China Securities Finance Co (CSFC) promised additional measures to shore up/stimulate equity markets provided a thin blanket of calm over the Chinese equity markets. It was enough for Chinese equities to limit losses on the day and AUD, NZD and CAD to rise.
GBPUSD was the start of the show in Europe, gaining on the back of a GDP number (Q2 0.7%) which was as expected.
This morning’s release of the US Case Shiller Housing Price index (Actual May 4.9% vs. forecast 5.6% y/y) was a disappointment but not really a factor for FX trading. FX direction will be dictated by continuing position adjustments ahead of tomorrow’s FOMC meeting with USDCAD traders eying WTI prices hovering just above support at $46.75. (Currently $46.95)
Technical Outlook
The USDCAD technicals are bullish while trading above the 1.2980-90 area but gains have stalled at 1.3050. Failure to take out this level could lead to more 1.2970-1.3050 consolidation. A break above 1.3050 targets 1.3110 while a move below 1.2970 opens the door to a move to 1.2900. For today, USDCAD support is at 1.2990, 1.2970 and 1.2930. Resistance is at 1.3050, 1.3090 and 1.3110.
Today’s Range 1.2990-1.3030
Chart: USDCAD daily with uptrend Larger Chart
Forex Trading Alert originally sent to subscribers on July 23, 2015, 9:44 AM.
Earlier today, the U.S. Department of Labor showed that the initial jobless claims in the week ending July 18 dropped by 26,000 to 255,000, beating analysts’ expectations for a 1,000 drop. In this environment, the USD Index bounced off session’s lows and came back above 97. What impact did this move have on the euro, pound and Swiss franc?
In our opinion the following forex trading positions are justified – summary:
- EUR/USD: short (stop-loss order at 1.1058)
- GBP/USD: none
- USD/JPY: none
- USD/CAD: none
- USD/CHF: none
- AUD/USD: none
Before we take a closer look at the EUR/USD, GBP/USD and USD/CHF charts, let’s examine the current situation in the USD Index.
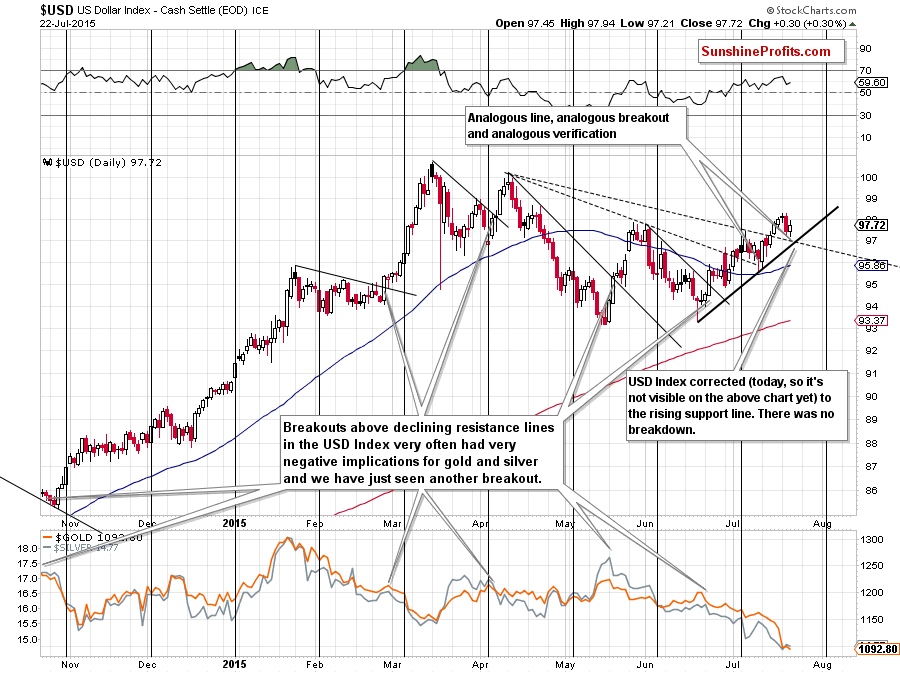
Yesterday, the index approached the black dashed line (based on the Apr 13 and Jul 7 highs), which triggered a rebound to slightly below
98. Earlier today, the U.S. dollar reversed and moved lower once again (it’s not visible on the above chart yet), re-testing not only this support line but also the black rising line based on the Jun 18 and Jul 10 lows (which serves as an additional support at the moment). What impact did it have on the greenback? The USD Index bounced off this area and came back above 97, which suggests higher values of the index – similarly to what we saw on Jul 13 (back then, the dollar moved sharply higher after a drop to analogous lines).
Having said that, let’s take a look at our currency pairs below.
EUR/USD
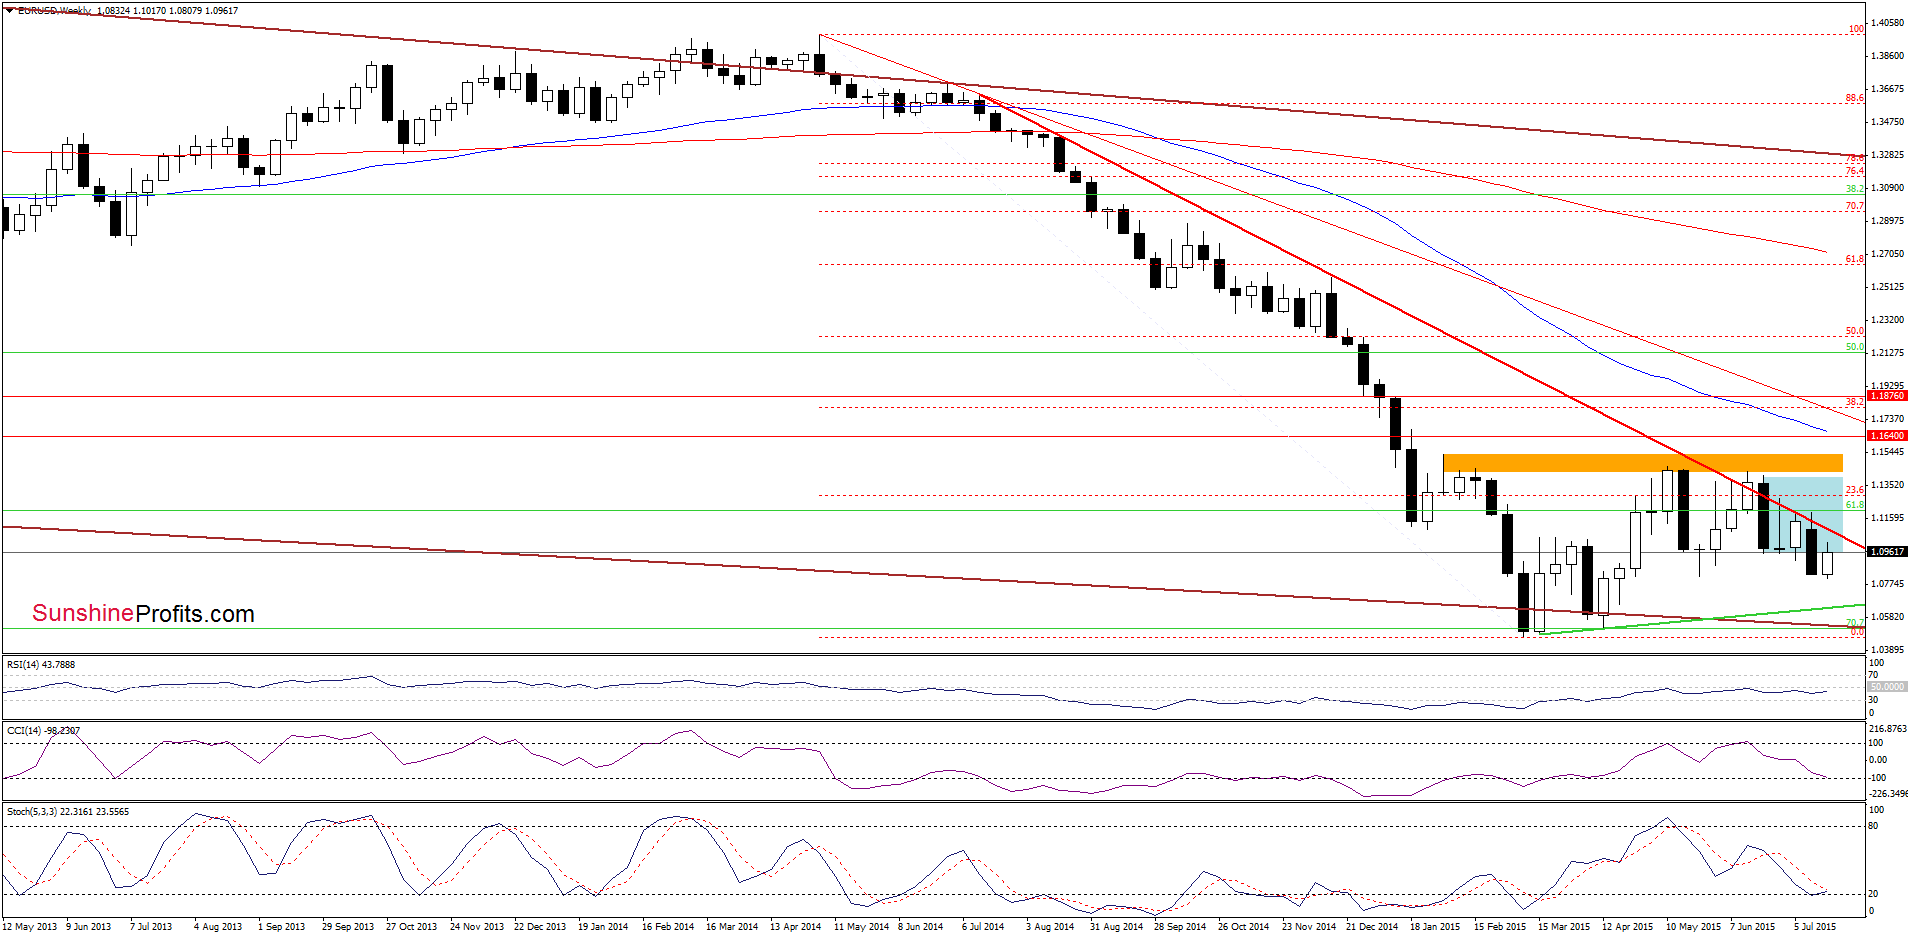
Although EUR/USD moved higher, the pair reversed and slipped under the lower border of the blue consolidation once again, which suggests that currency bulls may not be as strong as it seemed on the first sight.
Will the daily chart give us more clues about future moves? Let’s find out.
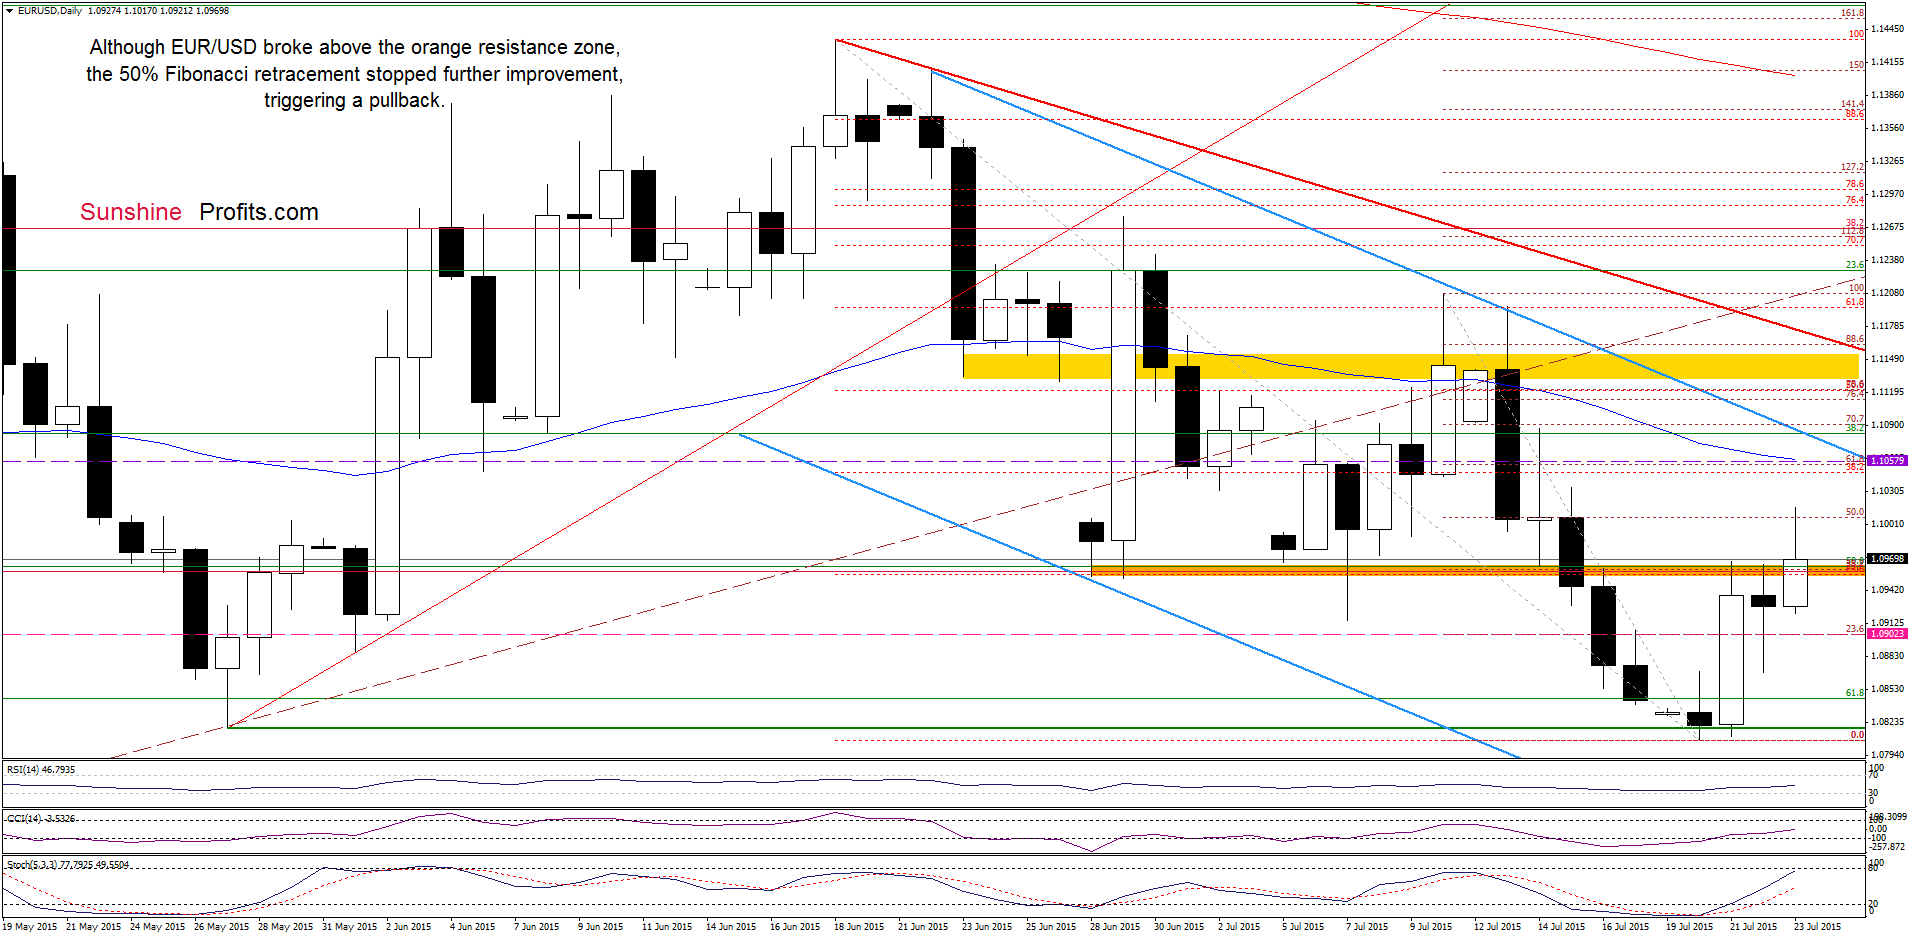
From this perspective, we see that EUR/USD broke above the orange resistance zone and reached the 50% Fibonacci retracement (based on the recent downward move started on Jul 10). Despite this improvement, currency bulls didn’t manage to push the pair higher, which resulted in a pullback to the previously-broken orange zone. What’s next? Although this area could trigger another rebound, we think that the current situation in the USD Index will translate to lower values of the exchange rate. If this is the case, and the pair closes today’s session under the orange area, it would be a bearish signal, which will trigger further deterioration in the coming days.
Very short-term outlook: bearish
Short-term outlook: mixed with bearish bias
MT outlook: mixed
LT outlook: mixed
Trading position (short-term; our opinion): Short positions with a stop-loss order at 1.1058 are justified from the risk/reward perspective at the moment. We will keep you informed should anything change, or should we see a confirmation/invalidation of the above.
GBP/USD
The situation in the medium term hasn’t changed much as GBP/USD is trading between the last week’s high and low. Today, we’ll focus on the very short-term changes.
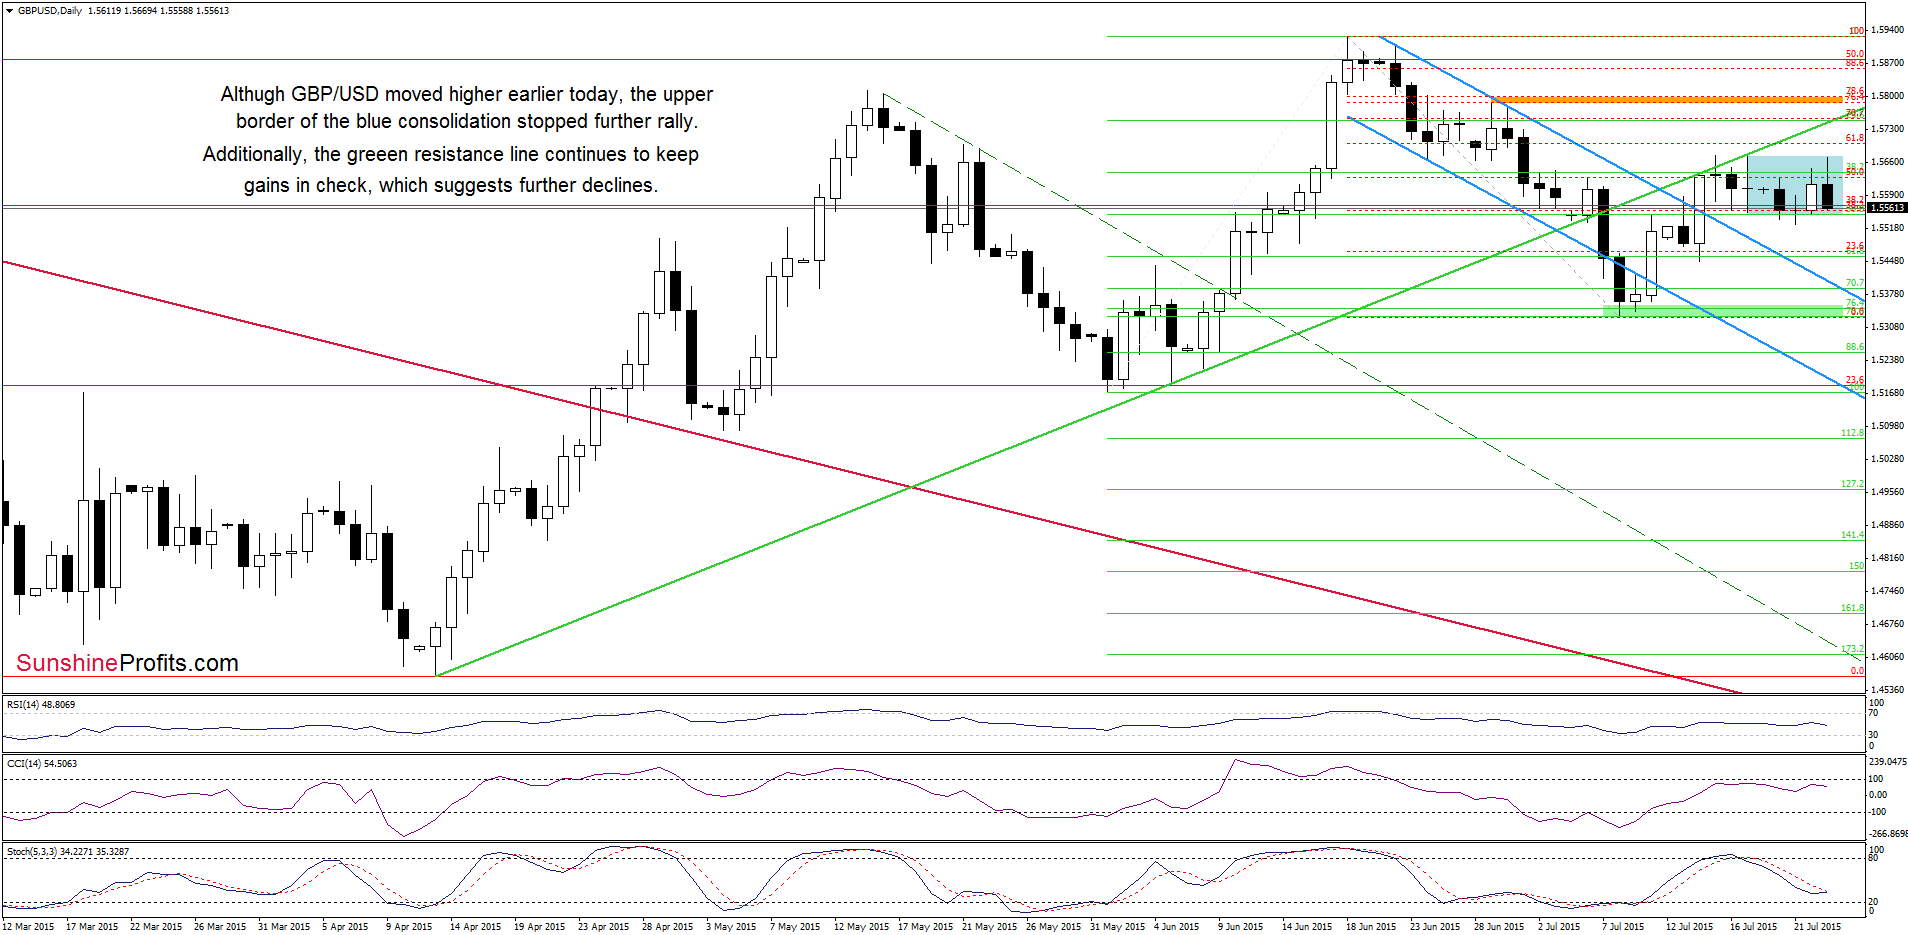
Looking at the daily chart, we see that although GBP/USD moved higher in the previous days, the upper border of the blue consolidation was strong enough to stop further improvement. As a result, the exchange rate moved sharply lower earlier today. What’s next? If the pair drops below the lower border of the blue consolidation, GBP/USD will likely extend losses and we’ll likely see a decline to the previously-broken upper border of the declining blue trend channel (currently around 1.5408) in the coming days.
Very short-term outlook: mixed with bearish bias
Short-term outlook: mixed
MT outlook: mixed
LT outlook: mixed
Trading position (short-term; our opinion): No positions are justified from the risk/reward perspective at the moment. We will keep you informed should anything change, or should we see a confirmation/invalidation of the above.
USD/CHF
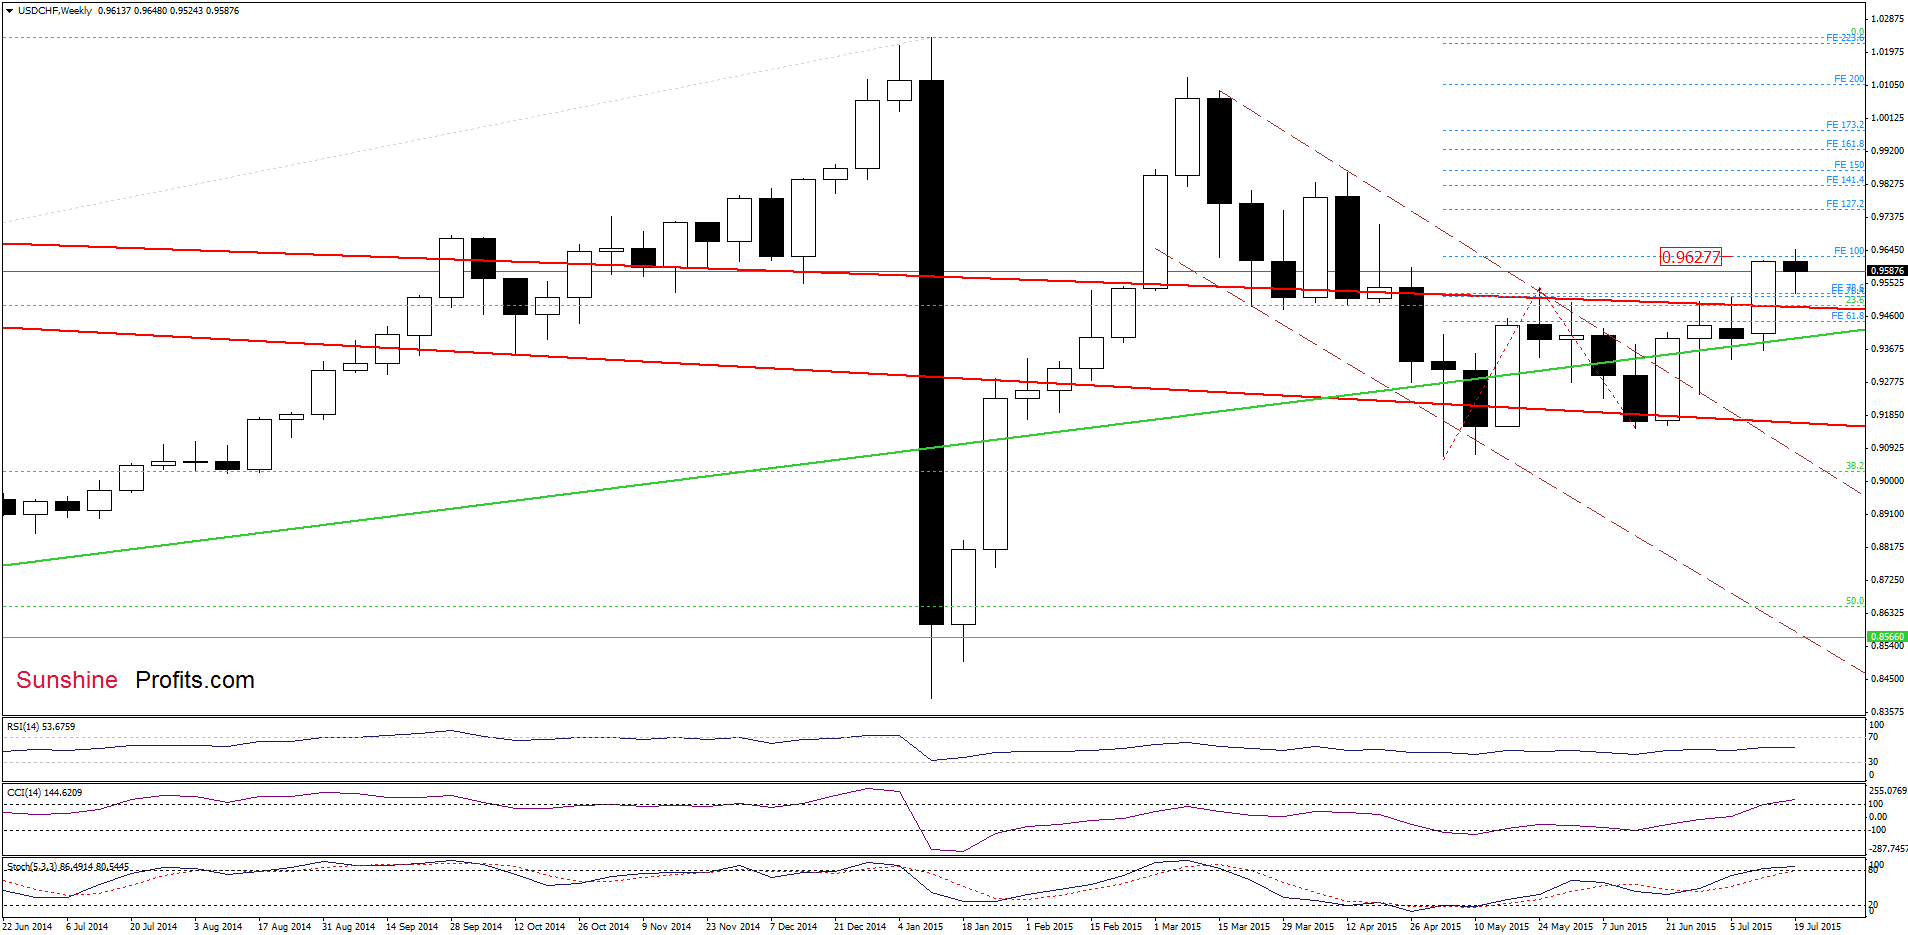
The situation in the medium term has deteriorated slightly as USD/CHF reversed and declined after an increase above the 100% Fibonacci price projection (marked with blue). What impact did this move have on the very short-term picture? Let’s check.
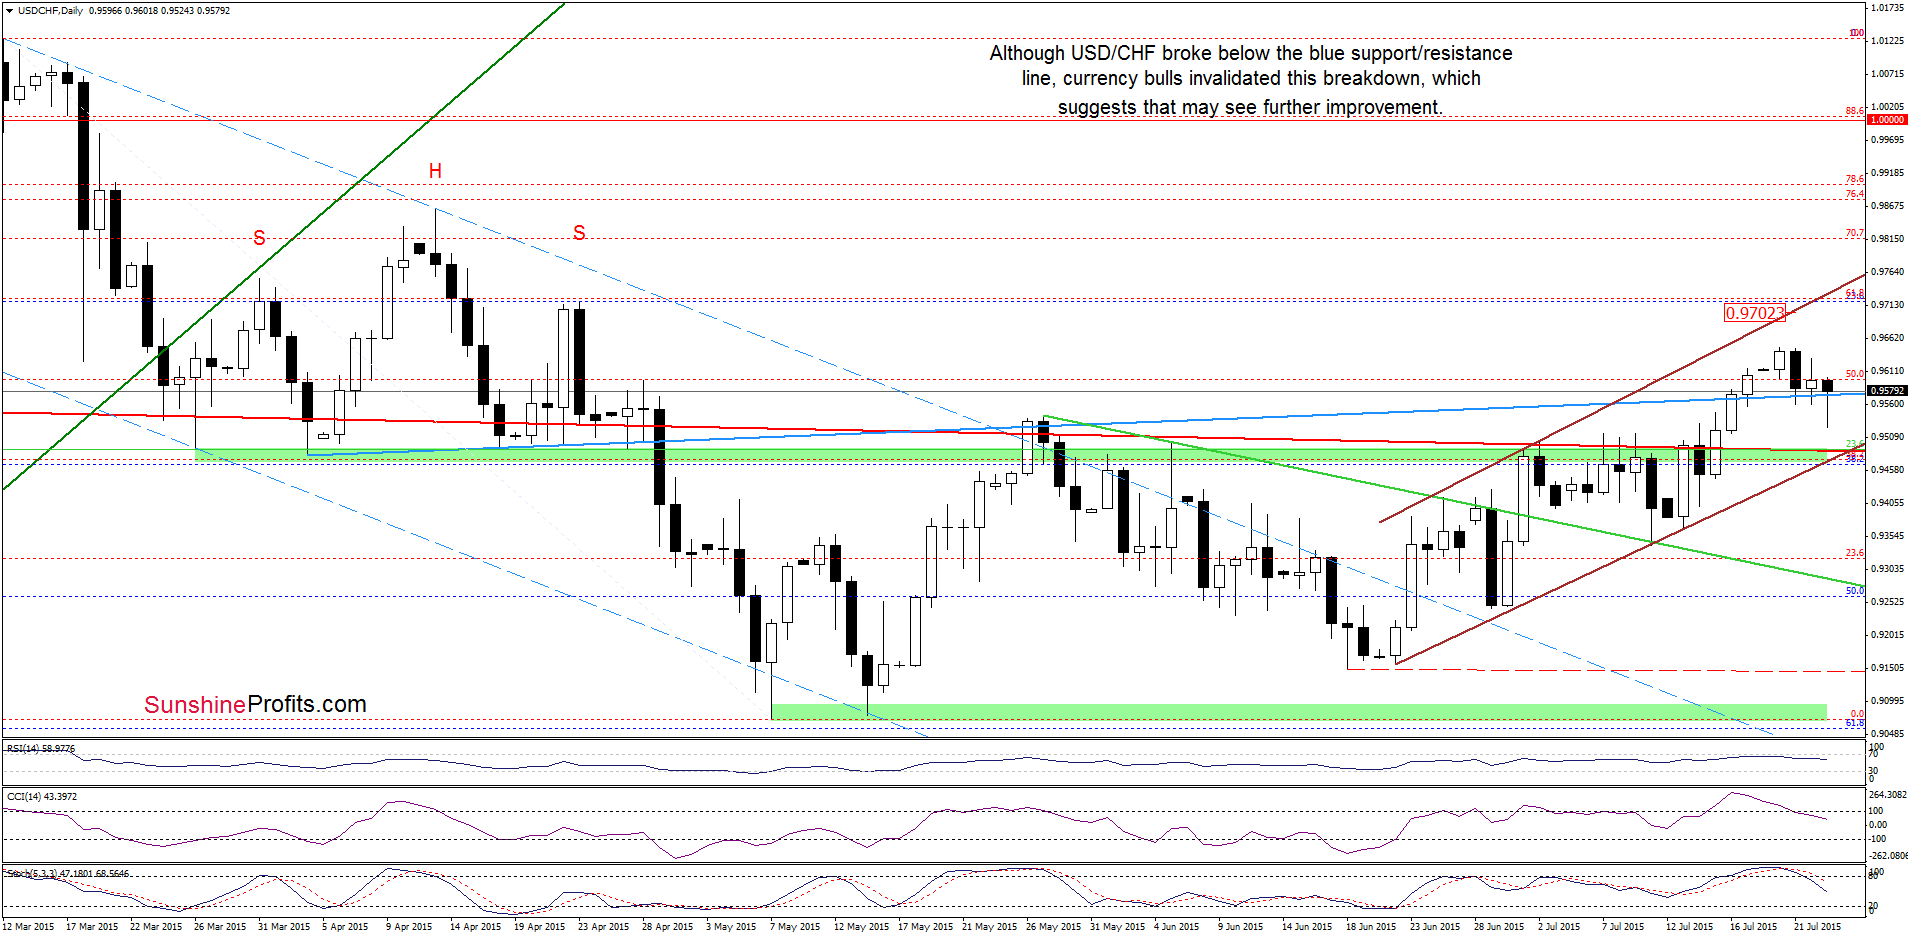
On the above chart, we see that USD/CHF moved lower in recent days, which resulted in a drop below the previously-broken blue support/resistance line. Despite this move, currency bulls managed to stop their opponents and the pair rebounded earlier today. With this upswing, the pair invalidated small breakdown under the blue line, which is a positive signal that suggests further improvement. Nevertheless, such price action will be more likely (and reliable), if we see a daily close above the blue line (currently at 0.9575).
Very short-term outlook: mixed
Short-term outlook: mixed
MT outlook: mixed
LT outlook: mixed
Trading position (short-term; our opinion): No positions are justified from the risk/reward perspective at the moment. We will keep you informed should anything change, or should we see a confirmation/invalidation of the above.
Thank you.
Nadia Simmons
Forex & Oil Trading Strategist
Przemyslaw Radomski, CFA
Founder, Editor-in-chief
Gold & Silver Trading Alerts
Forex Trading Alerts
Oil Investment Updates
Oil Trading Alerts

-
I know Mike is a very solid investor and respect his opinions very much. So if he says pay attention to this or that - I will.
~ Dale G.
-
I've started managing my own investments so view Michael's site as a one-stop shop from which to get information and perspectives.
~ Dave E.
-
Michael offers easy reading, honest, common sense information that anyone can use in a practical manner.
~ der_al.
-
A sane voice in a scrambled investment world.
~ Ed R.
Inside Edge Pro Contributors

Greg Weldon

Josef Schachter

Tyler Bollhorn

Ryan Irvine

Paul Beattie

Martin Straith

Patrick Ceresna

Mark Leibovit

James Thorne

Victor Adair