
Energy & Commodities
The carnage continues in the U.S. major oil industry as they sink further and further in the RED. The top three U.S. oil companies, whose profits were once the envy of the energy sector, are now forced to borrow money to pay dividends or capital expenditures. The financial situation at ExxonMobil, Chevron and ConocoPhillips has become so dreadful, their total long-term debt surged 25% in just the past year.
Unfortunately, the majority of financial analysts at CNBC, Bloomberg or Fox Business have no clue just how bad the situation will become for the United States as its energy sector continues to disintegrate. While the Federal Government could step in and bail out BIG OIL with printed money, they cannot print barrels of oil.
Watch closely as the Thermodynamic Oil Collapse will start to pick up speed over the next five years.
According to the most recently released financial reports, the top three U.S. oil companies combined net income was the worst ever. The results can be seen in the chart below:
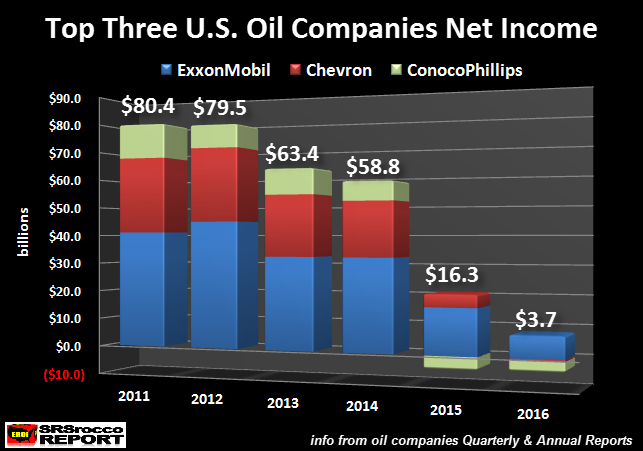
In 2011, ExxonMobil, Chevron and Conocophillips enjoyed a combined $80.4 billion in net income profits. ExxonMobil recorded the highest net income of the group by posting a $41.1 billion gain, followed by Chevron at $26.9 billion, while ConocoPhillips came in third at $12.4 billion.
However, the rapidly falling oil price, since the latter part of 2014, totally gutted the profits at these top oil producers. In just five short years, ExxonMobil’s net income declined to $7.8 billion, Chevron reported its first $460 million loss while ConocoPhillips shaved another $3.6 billion off its bottom line in 2016. Thus, the combined net income of these three oil companies in 2016 totaled $3.7 billion versus $80.4 billion in 2011.
Even though these three oil companies posted a combined net income profit of $3.7 billion last year, their financial situation is much worse when we dig a little deeper. We must remember, net income does not include capital expenditures (CAPEX) or dividend payouts. If we look at these oil companies Free Cash Flow, they have been losing money for the past two years:
Their combined free cash flow fell from a healthy $46.3 billion in 2011 to a negative $8.7 billion in 2015 and a negative $7.3 billion in 2016. Now, their free cash flow would have been much worse in 2016 if theses companies didn’t reduce their CAPEX spending by nearly a whopping $20 billion. I don’t have a chart to show their capital expenditures, but here are some of the annual figures:
Top 3 U.S. Oil Companies Total CAPEX Spending:
2013 = $87.2 billion
2014 = $85.4 billion
2015 = $66.0 billion
2016 = $46.6 billion
The combined CAPEX spending from these three oil companies fell 29% in 2016 versus 2015 and 46% since 2013. Basically, ExxonMobil, Chevron and ConocoPhillips have cut their combined CAPEX spending in half in the past three years. This is bad news for either building or at least maintaining oil production in the future.
NOTE: Free Cash Flow is calculated by subtracting CAPEX spending from the company’s operating cash or profits.
Even though these companies slashed nearly $20 billion in CAPEX spending in 2016, they still suffered a negative free cash flow of $7.3 billion. However, this does not include dividend payouts to their shareholders. Not only did these companies pay a total of $46.6 billion in CAPEX in 2016, they also forked out an additional $21.4 billion in shareholder dividends. Dividend payouts do not come out of thin air.. they must come from cash from operations.
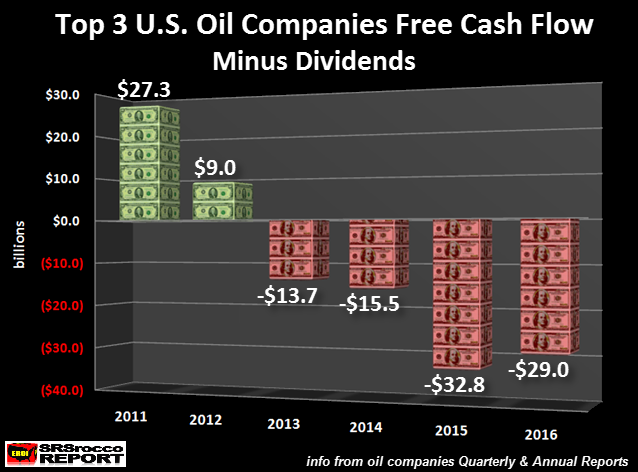
If we include dividend payouts, this would be the net result on these companies Free Cash Flow:
Here we can see that the large dividend payouts by these three oil companies impacted their bottom line much worse than the figures shown in the Free Cash Flow chart above. Thus, the free cash flow minus dividend payouts provides us evidence that these oil companies have been seriously in the RED since 2013, not just the past two years displayed in the Free Cash Flow chart.
As we can see, the group’s free cash flow minus dividends was a negative $32.8 billion in 2015 and a negative $29 billion last year. Of course, these three companies may have sold some financial investments or assets to reduce these negative values, but a company can’t stay in business for long by selling assets that it would need to use to produce oil in the future.
So, what has falling free cash flow and dividends done to ExxonMobil, Chevron and ConocoPhillips long-term debt? You guessed it… it skyrocketed:
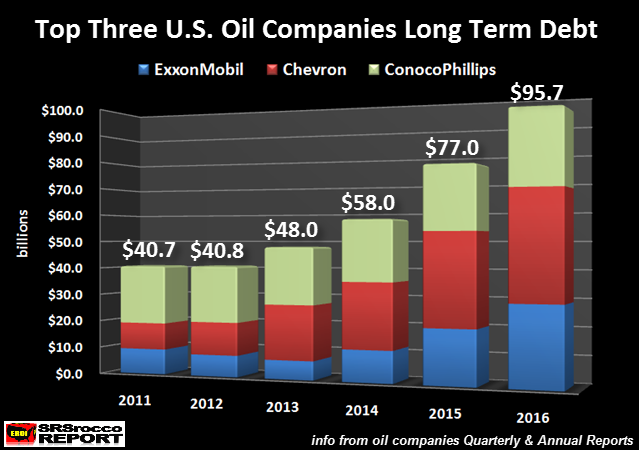
When these three companies still enjoyed positive free cash flow in 2011 and 2012, after paying CAPEX and dividends, their long-term debt did not increase. However, as their operating profits really started to decline, the debt on their balance sheets increased significantly. As we can see, the combined long-term debt in these three companies balance sheets ballooned from $40.8 billion in 2012 to $95.7 billion in 2016.
Basically, these three companies combined long-term debt has doubled in just the past three years. This is bad news as the situation in the energy markets continues to disintegrate. Zerohedge published this article, Goldman Stunned By Collapse In Gasoline Demand: “This Would Require A US Recession” which stated the following:
So yes, both gasoline stocks and supply remains at extremely high levels, but what set off alarm bells is not supply, but demand: the EIA last week reported that the 4-week average of gasoline supplied – or implied gasoline demand – in the United States was 8.2 million barrels per day, the lowest since February 2012. And, as Reuters adds, U.S. refiners are now facing the prospects of weakening gasoline demand for the first time in five years.
Unfortunately, the massive amount of debt overhanging the U.S. economy has put a lot of leverage on the public’s ability to continue purchasing consumer goods and services. While the market has become clever at selling cars for example, by first offering lower interest rates and extended loan payouts, it is now resorting to leasing vehicles at ultra low monthly payment plans… just to get rid of them. Leasing automobiles at monthly rates that are uneconomic for the auto industry in the long run, only allows the GREATEST FINANCIAL PONZI SCHEME to continue a little longer.
When we start to add up all the data, the U.S. economy is getting ready to hit a BRICK WALL. Furthermore, the situation as the top three U.S. oil companies will only get worse going forward. As ExxonMobil, Chevron and ConocoPhillips continue to bleed to death, watch for U.S. oil production to fall precipitously in the future.
Yes, it is true that U.S. oil production has increased over the past several months due to the DRILLING RIG HAMSTERS doing their thing by taking good investment money and producing more crappy low quality oil. However, this isn’t something to cheer about. Rather, I call this…. turning GOLD into LEAD.
Some readers send me information of the growing drilling rig count and oil production in the Permian field in Texas. Yes, that is where the activity has moved to. Why? Well, it is one of the last fields that can produce oil similar to the Bakken and Eagle Ford.
That being said, I would refrain from believing that this bump up in U.S. oil production will SAVE THE DAY. Why? Because it is being done on the back of a massively indebted energy sector which has been able to continue drilling by using rigs that have seen their rental rates cut in half, or more, due to the implosion of the drilling rig industry in 2015 and 2016.
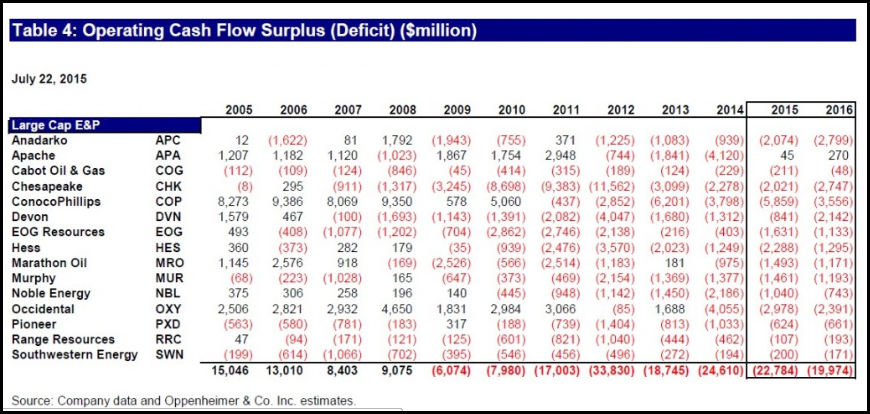
The evidence provided in this article showing the continued financial disintegration at these top three oil companies suggests that the U.S. energy sector is in serious trouble. We must remember, the top oil companies are supposed to be the most profitable. However, if we take a look at what is taking place in the top shale oil and gas producers, the situation is even more dire. I have republished this chart from a previous article showing that the shale oil and gas industry hasn’t really made a profit since 2009:
 https://srsroccoreport.com/wp-content/uploads/2016/12/Large-Cap-Energy-EP-Operating-Cash-Flow-Table-2015-240×114.png 240x, https://srsroccoreport.com/wp-content/uploads/2016/12/Large-Cap-Energy-EP-Operating-Cash-Flow-Table-2015-300×143.png 300x, https://srsroccoreport.com/wp-content/uploads/2016/12/Large-Cap-Energy-EP-Operating-Cash-Flow-Table-2015-768×365.png 768x”>
While some of the companies made free cash flow profits in various years, as an industry, these oil and gas producers have been in the RED since the U.S. Shale Energy Industry really took off in 2009. So, the notion that rising oil production from increased drilling rig activity is going to change the SEA OF RED taking place in the entire U.S. energy sector, suggests individuals or the market has gone completely insane.
As I have stated before, Americans continue to suffer from an increasing amount of BRAIN DAMAGE. Now, I am not just talking about the typical JOE BAG of DONUTS, as they at least have an excuse due to the propaganda put out by the Mainstream media. However, I am really surprised that “supposedly” intelligent individuals continue to either believe in U.S. energy independence or the more silly “Abiotic oil” theory that the Earth has a CREAMY NOUGAT CENTER of oil… that will refill all the oil fields in the world. (James Howard Kunstler gets the credit for that wonderful term).
While I realize the “Abiotic Oil Theory” is complete HOGWASH, many individuals still believe it is true. This theory has been propagated by a few Russian scientists and engineers, but I can assure you the bulk of the Russian oil industry is not drilling down to ultra deep depths to get their oil. I will be publishing an article shortly as a rebuttal to a recent newsletter post titled, How I came to Realize I was Wrong About Peak Oil – F. William Engdahl. Unfortunately, Mr. Engdahl has failed to look at the real evidence, instead has fallen HOOK, LINE and SINKER by faulty information and lousy conspiracy theories.
The number of individuals who fail to believe in PEAK OIL will diminish greatly as the Thermodynamic Oil Collapse picks up speed over the next five years. During this time, it would be prudent to own physical precious metals rather than highly inflated debt-based paper assets or real estate.
Check back for new articles and updates at the SRSrocco Report.

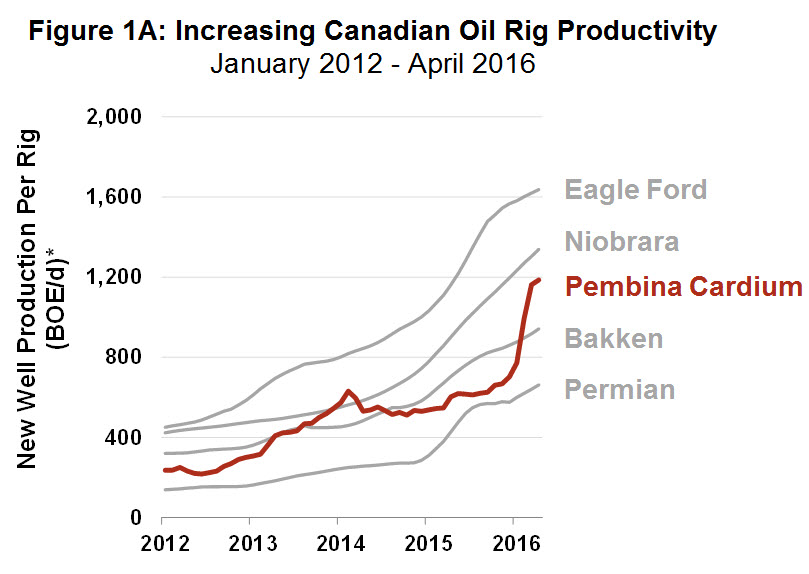 Canada’s Western Canadian Sedimentary Basin (WCSB) is one of the largest repositories of hydrocarbons in the world, with plenty of source rocks that are conducive to the same innovative processes that are delivering impressive results in the US. Yet productivity improvements in Canada have lagged – until recently.
Introduction of larger, AC electric “triple” rigs that can walk on pads has lagged the US. But the modern fleet has risen in the WCSB and geriatric rigs have been retired. Over the past year other ingredients in the United States secret sauce have been adopted by Canadian industry in a big way. Established producers in the WCSB are going down the learning curve quickly; validating the notion that Canadian rocks can perform as well as other highly productive regions
….also:
Weaker US$ Could Send Gold & Gold Stocks to Higher Targets

Jan 31, 2017
- As I have noted for many years, gold has a rough general tendency to decline ahead of the US jobs report, and then rally in the hours and/or days following the release of the report.
- The next monthly jobs report will be released at 8:30AM on Friday. This report and the closure of the Chinese gold market for the New Year’s holiday should be quite negative for gold, but…
- The sell-off from the $1220 area is orderly, and gold feels firm.
- Please click here now. Double-click to enlarge. Gold did break down from a small double top pattern.
- The price target of the pattern is $1170, but there may be an uptrend channel forming. I’ve highlighted that in blue.
- Also, the lead line of the 14,7,7 Stochastics series oscillator that I use exclusively on daily bar and candlestick charts is now sitting at about 50, where momentum-based rallies can occur.
- With China offline and the jobs report dead ahead, why is gold acting so firmly? Well, please click here now. Double-click to enlarge. The US dollar looks very weak on this daily bars chart against the Swiss Franc.
- It’s broken down from a head and shoulders top pattern, and has not rallied since arriving at technical support yesterday.
- The rally could still happen, and that would likely push gold down to $1170 ahead of the jobs report.
- Given that gold has rallied from $1125 to $1220, a decline to $1170 is perfectly normal. An orderly decline like this should not make gold investors nervous.
- Please click here now. Double-click to enlarge this dollar versus yen chart.
- All gold community eyes should be focused on the 112.50 price level. A breakdown below that level would almost certainly usher in a gold price rally to my $1250 target zone.
- The Swiss franc, the Japanese yen, and gold bullion are all viewed as key “risk off” assets by bank FOREX traders.
- It’s clear that the dollar is struggling now against both the franc and the yen.
- Please click here now. Double-click to enlarge this weekly bars euro versus the dollar chart.
- The euro never rallied against the dollar in 2016 in the way that the franc, yen, and gold did.
- That’s partly because Europe’s economic recovery has been more anemic than America’s, but mainly because euro is not viewed as a safe haven currency by the large bank traders.
- Having said that, most gold price discovery takes place in US dollars, and a rally in the euro could add some zest to the gold price!
- The recovery taking place in Europe now could be enough to reverse the ECB’s policies of QE and low interest rates.
- That would create both European inflation and a euro rally.
- Please click here now. Double-click to enlarge this daily bars GDX chart.
- Gold stocks are performing exceptionally well since gold ran into resistance at my $1220 target zone.
- Can GDX rally to $25 if gold falls to $1170? I think that’s asking a bit much (for now), but GDX should easily rally to $25 if gold can climb back to $1220.
- A rally to $1250 would likely see GDX surge to $28, and a bigger move to $1650 for gold should see GDX make a new all-time high. That’s a bit further down the road, but eager gold stock investors should ensure they are building a solid block of core positions now, to partake in all the upside fun!
Special Offer For Website Readers: Please send me an Email to freereports4@gracelandupdates.com and I’ll send you my free “Senior Super Stars” report. I cover seven of the top senior gold stocks, with key buy and sell tactics for both short term traders, and long term core position enthusiasts!
Thanks!
Cheers
St
Stewart Thomson
Graceland Updates
Note: We are privacy oriented. We accept cheques, credit card, and if needed, PayPal.
Written between 4am-7am. 5-6 issues per week. Emailed at aprox 9am daily.
https://www.gracelandupdates.com
Email:
Rate Sheet (us funds):
Lifetime: $999
2yr: $299 (over 500 issues)
1yr: $199 (over 250 issues)
6 mths: $129 (over 125 issues)
To pay by credit card/paypal, please click this link:
https://gracelandupdates.com/subscribe-pp/
To pay by cheque, make cheque payable to “Stewart Thomson”
Mail to:
Stewart Thomson / 1276 Lakeview Drive / Oakville, Ontario L6H 2M8 Canada
Stewart Thomson is a retired Merrill Lynch broker. Stewart writes the Graceland Updates daily between 4am-7am. They are sent out around 8am-9am. The newsletter is attractively priced and the format is a unique numbered point form. Giving clarity of each point and saving valuable reading time.
Risks, Disclaimers, Legal
Stewart Thomson is no longer an investment advisor. The information provided by Stewart and Graceland Updates is for general information purposes only. Before taking any action on any investment, it is imperative that you consult with multiple properly licensed, experienced and qualified investment advisors and get numerous opinions before taking any action. Your minimum risk on any investment in the world is: 100% loss of all your money. You may be taking or preparing to take leveraged positions in investments and not know it, exposing yourself to unlimited risks. This is highly concerning if you are an investor in any derivatives products. There is an approx $700 trillion OTC Derivatives Iceberg with a tiny portion written off officially. The bottom line:
Are You Prepared?
Tonight I would like to update the Basic Materials sector as this area now looks like it’s ready to resume its bull market. Also with the stock markets breaking out today, especially the INDU, this adds another layer of confirmation that the breakout is the real deal. As we’ve discussed previously there are many big cap Dow stocks that make up the XLB, Basic Materials fund, and with the INDU making a new all time high today there will be some individual components making new all time highs as well.
Lets start by looking at a weekly chart for the XLB, Basic Materials fund, that is breaking out of a bullish rising flag this week. This bull flag has been building out since last spring and now the price action is trading into new all time highs. There was a conventional bull flag that formed between 2015 and 2016 that sloped down.
That down sloping black flag started to form after the 7 point bearish rising wedge completed.


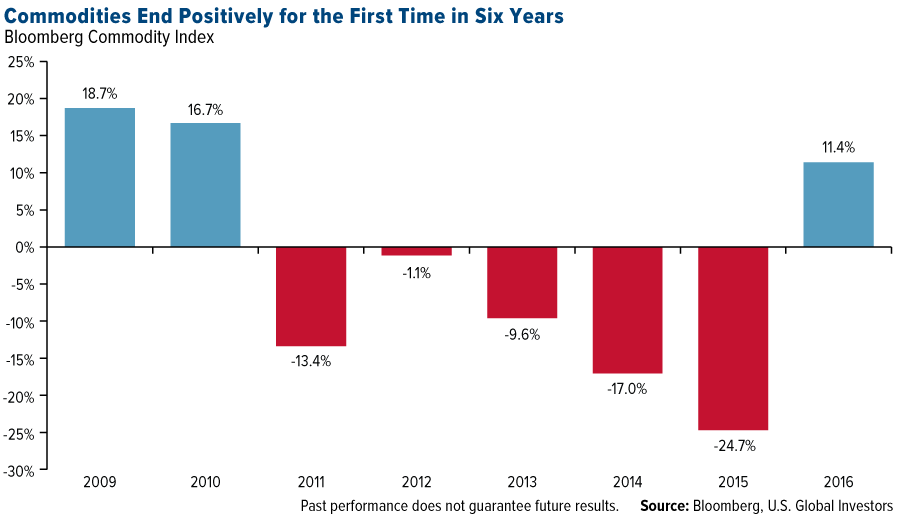
Commodity investors have had to endure a dry spell for a while now, but those days are starting to look as if they might be behind us. We see encouraging signs that a bottom has been reached and a new commodities super-cycle has begun, as global manufacturing expansion and inflation are finally gathering steam following the financial crisis more than eight years ago.
As a group, commodities had their first positive year since 2010, ending 2016 up more than 11 percent, as measured by the Bloomberg Commodity Index.
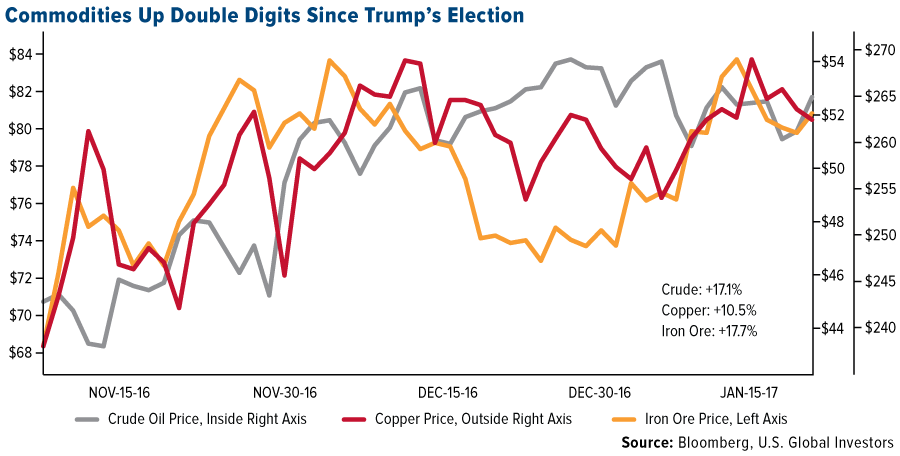
A large percentage of this growth occurred in the days following the U.S. election, suggesting the reflation trade is officially in motion, which should be supported in the coming weeks and months by President Donald Trump’s pro-growth policies.
Just this week, Trump signed executive orders to proceed with the controversial Keystone XL and Dakota Access pipelines, emphasizing that the steel to be used in their construction will be American-made. Following the announcement, stock in energy infrastructure company TransCanada, which is expected to resubmit plans for the pipeline after it was rejected by the Obama administration, immediately hit a new high, while shares of several steel companies traded up.
Between Election Day and Inauguration Day, the commodities index rose 5.4 percent, with double-digit growth in crude oil (up 17.1 percent), copper (10.5 percent) and iron ore (17.7 percent).
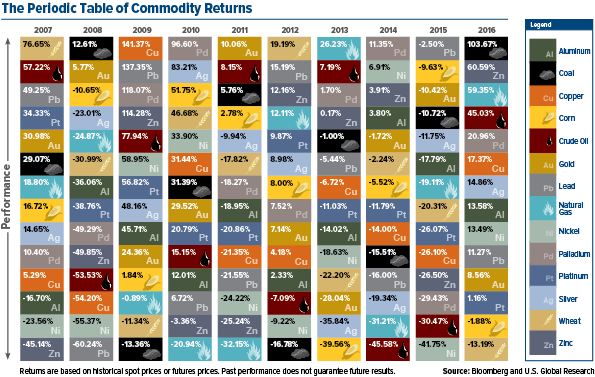
Of the 14 commodities that we track in our ever-popular Periodic Table of Commodity Returns—which has been updated for 2016 and is available for download—only two ended the year down: corn and wheat. All this, following the group’s worst annual slump since the 2008 financial crisis.
Investment Banks Turn Bullish on Commodities
Back in May, Citigroup was first to say that the worst was over for commodities, and in December it made the call that most raw materials were poised to “perform strongly” in 2017 on global fiscal stimulus and economic expansion.
Now, for the first time in four years, Goldman Sachs has recommended an overweight position in commodities, following reports that revenue from commodity trading at the world’s 12 biggest investment banks jumped 20-25 percent in the fourth quarter of 2016 compared to the same period in 2015.
As reported by Bloomberg, Goldman’s head of commodities research, Jeffrey Currie, drew attention to the “cyclical uptick in global economic activity,” which is “driving demand, not only for oil but all commodities.”
“U.S. and China are focal points where we’re seeing the uptick,” Currie continued, “but even the outlook for Europe is much more positive than what people would have thought six months to a year ago.”
Indeed, manufacturing activity continues to expand at a robust pace, with January’s preliminary purchasing managers’ index (PMI) for the U.S. and the eurozone registering an impressive 55.1 and 54.3, respectively. We won’t know China’s January PMI until next week, but in December it improved at its fastest pace in nearly four years. As I shared with you earlier this month, the global manufacturing PMI expanded for the fourth straight month in December, reaching its highest reading since February 2014. I’m optimistic that it will expand again in January.
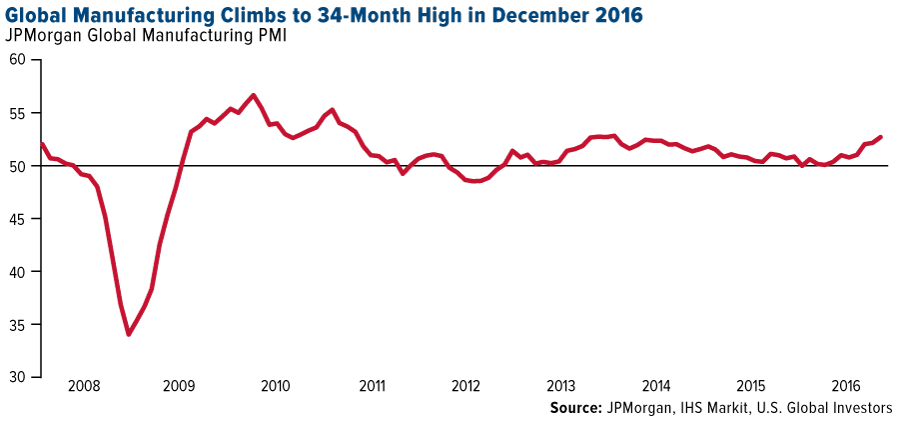
Again, we closely monitor the PMI, as our research has shown that it can be used to anticipate the performance of commodities and energy three and six months out. It looks as if the world’s big banks have begun to acknowledge this correlation as well. With the health of global manufacturing trending up, we see commodities demand following suit in the coming months.
Number of Auto Sales Hits an All-Time High
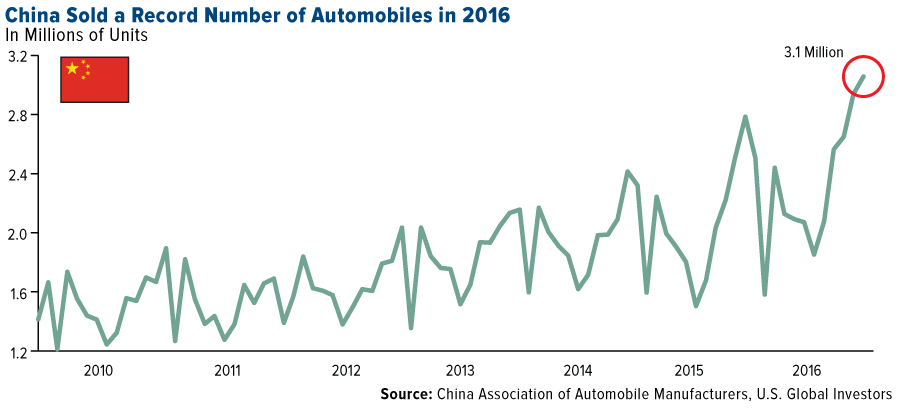
Case in point: auto sales. Last year marked a new record high, with 88.1 million cars and light commercial vehicles driven off of car lots. That figure was up 4.8 percent from 2015.

China was the standout, which increased sales 13 percent and saw 3.2 million new units sold. It should be noted, however, that sales were assisted by a 50 percent tax cut on smaller vehicles, which is no longer in place.
But consider this: Here in the U.S., the average age of cars and light trucks continues to creep up and is now 11.6 years, as of January 2016, according to IHS Markit. Improvements in quality is the main reason for the increase.
Even so, these aging vehicles will need to be replaced in the next few years, meaning domestic auto sales should remain strong. This bodes well for platinum and palladium, both of which are used in the production of catalytic converters.
But what about electric cars, which have no need for catalytic converters since they’re emissions-free? As I’ve shared with you before, electric cars—the demand for which continues to climb—use three times more copper wiring than vehicles with a conventional internal combustion engine.
There’s always an opportunity if you know where to look!

-
I know Mike is a very solid investor and respect his opinions very much. So if he says pay attention to this or that - I will.
~ Dale G.
-
I've started managing my own investments so view Michael's site as a one-stop shop from which to get information and perspectives.
~ Dave E.
-
Michael offers easy reading, honest, common sense information that anyone can use in a practical manner.
~ der_al.
-
A sane voice in a scrambled investment world.
~ Ed R.
Inside Edge Pro Contributors

Greg Weldon

Josef Schachter

Tyler Bollhorn

Ryan Irvine

Paul Beattie

Martin Straith

Patrick Ceresna

Mark Leibovit

James Thorne

Victor Adair