Energy & Commodities

The Top 10 Reasons Investors Should Look at Cobalt

Screen Shot 2017-01-23 at 12.43.16 PM

Every once in a while a previously underappreciated metal rises to prominence.

It may be cobalt’s time to be that metal.

Cobalt is powering the green economy, and by 2020, 75% of all li-ion batteries will have cobalt in them.

….continue reading & viewing HERE

….also from Visual Capitalist:

Black Swans: 9 Recent Events That Changed Finance Forever

Divergence Between Oil and Oil Stocks Signals Decline in Oil-Related ETF’s

Technical analyst Jack Chan reports the energy sector cycle is down and a multiweek correction is in progress, and discusses what that means.

Chan5-16-16-1

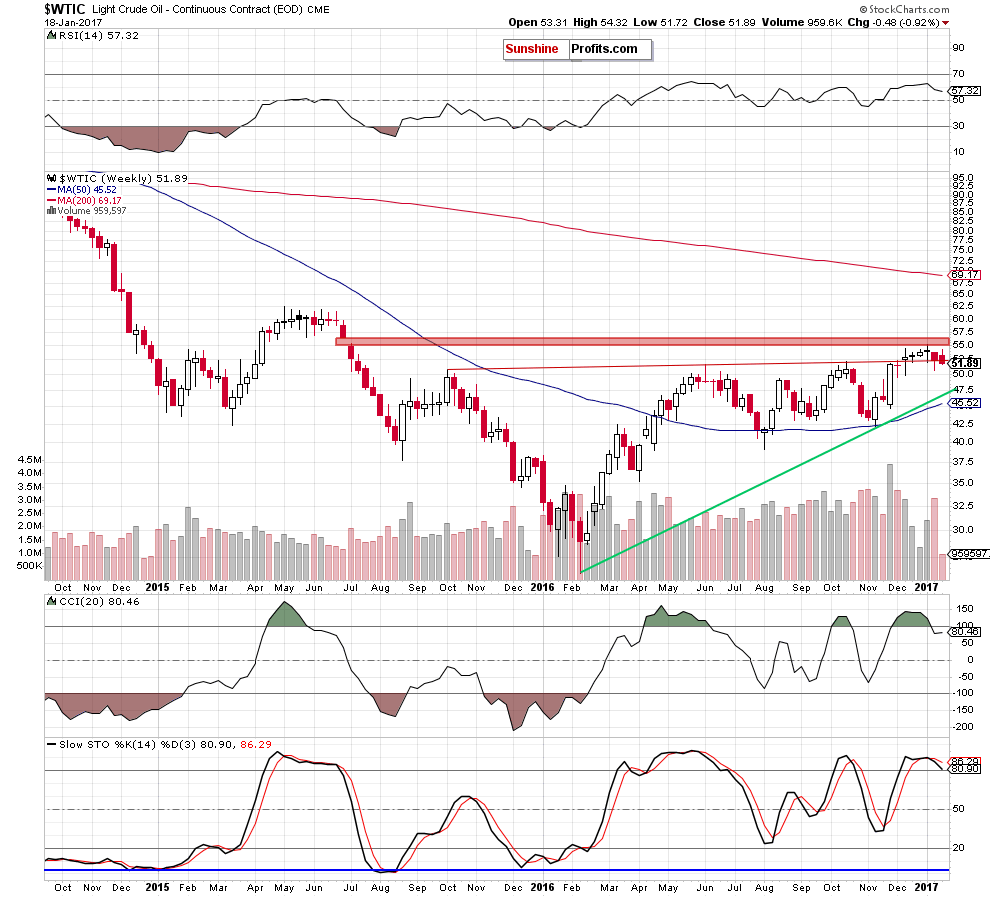
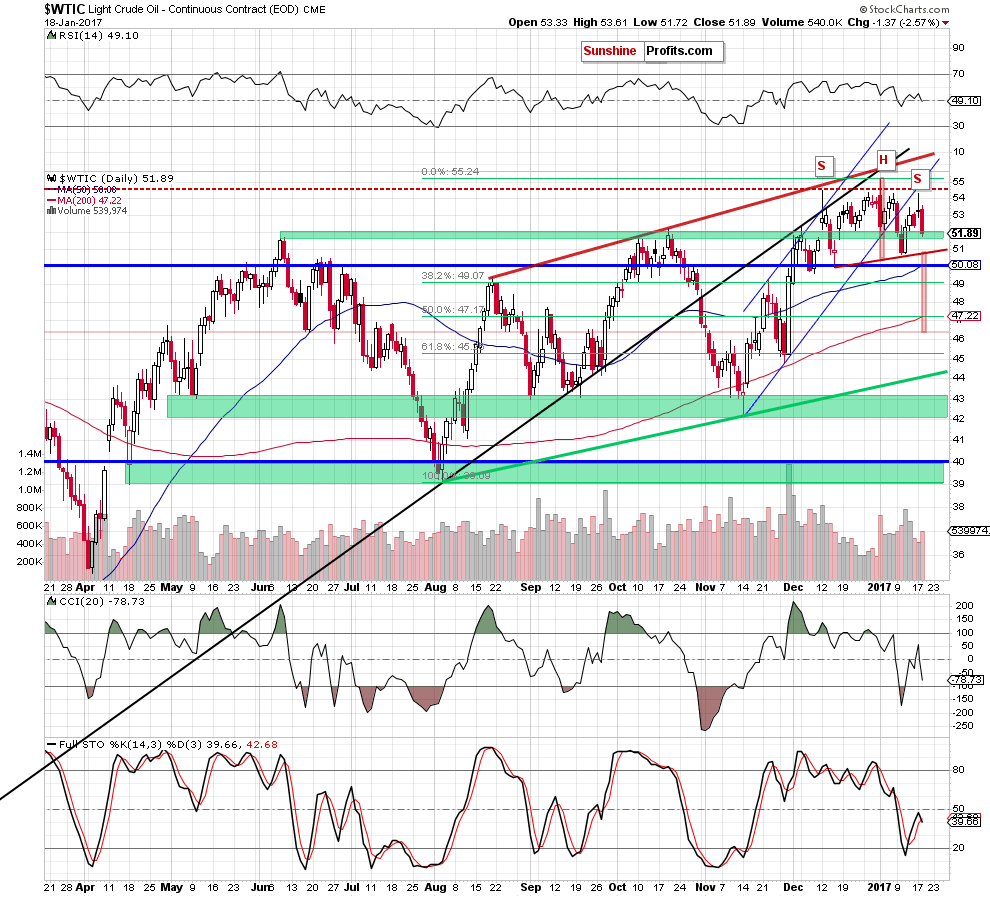
Our proprietary energy cycle indicator turned down last week from the divergence as noted previously

OSX Oil Services Index

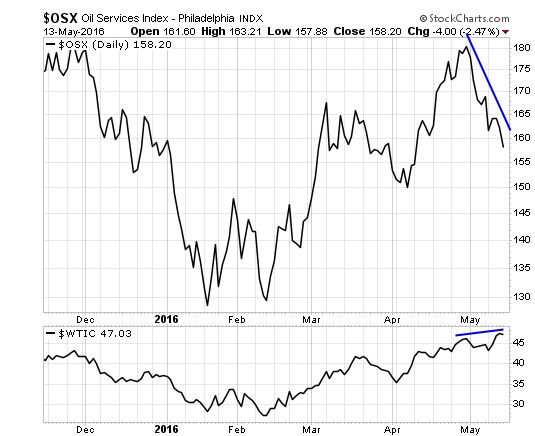
We have a serious divergence this week between oil and oil stocks. Such divergences have almost always led to a substantial decline in prices in oil-related ETFs. 

DUG ProShares UltraShort Oil & Gas

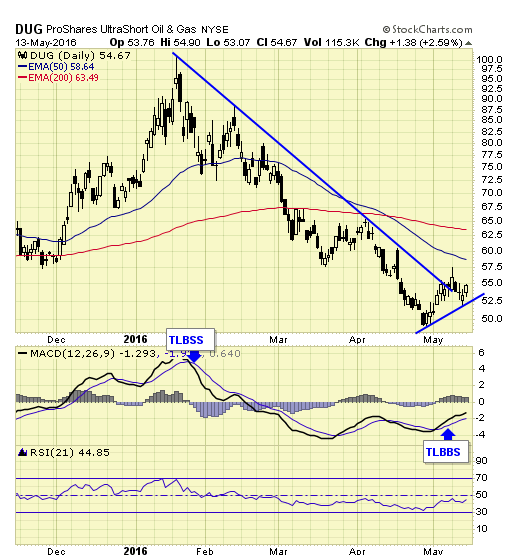
It so happens that we have a new buy signal and set up on the inverse ETF this week. 

Summary
The energy sector cycle is down and a multiweek correction is in progress. Traders can consider shorting the sector via an inverse ETF, and manage their risk by using stops. 

Related Articles


Jack Chan is the editor of Simply Profits at www.simplyprofits.org, established in 2006. Chan bought his first mining stock, Hoko Exploration, in 1979, and has been active in the markets for the past 37 years. Technical analysis has helped him filter out the noise and focus on the when, and leave the why to the fundamental analysts. His proprietary trading models have enabled him to identify the NASDAQ top in 2000, the new gold bull market in 2001, the stock market top in 2007, and the U.S. dollar bottom in 2011.

Want to read more Energy Report interviews like this? Sign up for our free e-newsletter, and you’ll learn when new articles have been published. To see a list of recent interviews with industry analysts and commentators, visit our Streetwise Interviews page.

Disclosure:
1) Statement and opinions expressed are the opinions of Jack Chan and not of Streetwise Reports or its officers. Jack Chan is wholly responsible for the validity of the statements. Streetwise Reports was not involved in any aspect of the article preparation or editing so the author could speak independently about the sector. Jack Chan was not paid by Streetwise Reports LLC for this article. Streetwise Reports was not paid by the author to publish or syndicate this article.
2) This article does not constitute investment advice. Each reader is encouraged to consult with his or her individual financial professional and any action a reader takes as a result of information presented here is his or her own responsibility. By opening this page, each reader accepts and agrees to Streetwise Reports’ terms of use and full legal disclaimer. This article is not a solicitation for investment. Streetwise Reports does not render general or specific investment advice and the information on Streetwise Reports should not be considered a recommendation to buy or sell any security. Streetwise Reports does not endorse or recommend the business, products, services or securities of any company mentioned on Streetwise Reports.
3) From time to time, Streetwise Reports LLC and its directors, officers, employees or members of their families, as well as persons interviewed for articles and interviews on the site, may have a long or short position in securities mentioned. Directors, officers, employees or members of their families are prohibited from making purchases and/or sales of those securities in the open market or otherwise during the up-to-four-week interval from the time of the interview until after it publishes.

All charts courtesy of Jack Chan.


Oil Trading Alert: Time for Drop below $50?

Sent to subscribers on January 19, 2017, 7:11 AM.

Trading position (short-term; our opinion): Short positions (with a stop-loss order at $56.45 and an initial downside target at $45.81) are justified from the risk/reward perspective.

On Wednesday, crude oil lost 2.57% after the head of the IEA warned of a significant increase in U.S. shale output as OPEC and non-OPEC producers cut output. This news negatively affected the investors’ sentiment and pushed the black gold under important support levels. What does it mean for light crude?

Let’s examine the charts below to find out (charts courtesy of http://stockcharts.com).

2017-01-19-wtic-W-1

Yesterday, we wrote the following:


(…) although crude oil moved higher yesterday, the red gap continues to keep gains in check. Additionally, the sell signals generated by the indicators are still in play, supporting oil bears and another attempt to move lower.

From today’s point of view we see that the situation developed in line with the above scenario and crude came back below the previously-broken long-term red support/resistance line, invalidating the earlier breakout. This is a negative event, which together with the sell signals suggests further deterioration in the following days.

Having said the above let’s examine the daily chart and look for more bearish factors.

WTIC - the daily chart

Looking at the very short-term chart, we see that crude oil extended losses and dropped under the October high. This move materialized on higher volume, which confirms the oil bears’ strength. Additionally, the CCI reversed and the Stochastic Oscillator re-generated a sell signal, which suggests that what we wrote yesterday is up-to-date also today:

(…) light crude not only hit a double top, but also declined below last week’s high, which doesn’t bode well for the commodity.

On top of that, when we take a closer look at the daily chart, we can notice a potential head and shoulders formation. If this is the case, yesterday’s move to the upside created the right shoulder of the pattern, suggesting lower prices of the black gold in the coming days.

How low could crude oil go in the near future? In our opinion, the initial downside target will be the neck line of the head and shoulders formation (around $50.89 at the moment of writing these words). If it is broken, we’ll see an acceleration of declines and a drop even to around $46.36, where the size of the downward move will correspond to the height of the mentioned formation.

Before we finish today’s alert we would also like to draw your attention to the relationship between the black gold and the precious metals.

the oil-to-gold ratio - the weekly chart

On the medium-term chart, we see that the oil-to-gold ratio declined under the lower border of the blue consolidation once again, which increases the probability of further deterioration in the coming week(s). If his is the case and we see such action, crude oil will also move lower, because the strong positive correlation between light crude and the ratio remains in place.

We can also notice one more bearish development on the medium-term chart of the oil-to-silver ratio.

the oil-to-silver ratio - weekly chart

From this perspective we see that the invalidation of the breakout above the 38.2% Fibonacci retracement triggered further deterioration and a drop below last week’s low, which is a negative event. Additionally, there are also the sell signals generated by the indicators, which support oil bears and lower values of the ratio and crude oil.

Summing up, short positions continue to be justified as the double top formation, the potential head and shoulders pattern and the current situation in the oil-to-gold and oil-to-silver ratios suggest further deterioration in the coming days.

Very short-term outlook: bearish
Short-term outlook: bearish
MT outlook: bearish
LT outlook: mixed

Trading position (short-term; our opinion): Short positions (with a stop-loss order at $56.45 and an initial downside target at $45.81) are justified from the risk/reward perspective. We will keep you informed should anything change, or should we see a confirmation/invalidation of the above.

As a reminder – “initial target price” means exactly that – an “initial” one, it’s not a price level at which we suggest closing positions. If this becomes the case (like it did in the previous trade) we will refer to these levels as levels of exit orders (exactly as we’ve done previously). Stop-loss levels, however, are naturally not “initial”, but something that, in our opinion, might be entered as an order.

Thank you.

Nadia Simmons
Forex & Oil Trading Strategist

Crude Oil – Maxed Out & On The Brink of a Significant Move

oil1 BTBIf You Make a Grand Shorting Oil, It’s on Me!

Free.

And sufficiently timely, yes.

That’s what today’s idea is. Just remember, when you jump on today’s trade idea and make a grand, this one’s on me.

I’ve already begun preparing my paid subscribers with exact trade recommendations. But you can still act on this idea, because it is driven by key indicators that have performed well in the last 12 months.

The idea is that crude oil’s climb has maxed out.

Forever? Nah.

For the month? Likely.

For the year? Perhaps.

Basically, as I’ve been telling my paid subscribers for several weeks now, things are coming together in the crude oil market.

Unfortunately, they are converging to disappoint the bulls … at least for the time being.

I could make the case, technically, for crude oil to rise to around $60 per barrel before its fortunes turn sour in a negative feedback loop sort of way.

But things like sentiment surrounding the OPEC agreement, wave and Fibonacci analysis as well as speculators’ net long positioning all seem to suggest one thing.

That is, crude oil’s path of least resistance is quite clearly down.

And it’s this last point that I think deserves our attention.

I’ve talked about it before — many times — in these pages and others, how extreme positioning in the futures market can signal price reversals. 

This seems particularly true for crude oil, where it has helped me and my subscribers identify a series of profitable trade opportunities.

And it seems the mainstream financial press is catching on to its forecasting worth.I found the following chart in a MarketWatch article:

2349 1

speculators appear to be ‘obscenely’ long oil. Image credit: CFTC.

Amen!

This chart is telling us that large speculators have amassed an extreme net long position. One that rivals the 2014 peak when the price of crude oil collapsed. 

(Note the blue dot in the upper-right corner of the image, which represents July 3, 2014. The image reads: “Oil Speculators Net-Long to Obscene Extreme.)

In other words, oil traders are super-bullish … and that’s a contrarian indicator.

Despite crude oil finishing off last week on a strong note, now would seem like an opportune time to short crude oil.

Of course, you can do that in the futures market if that’s your playground of choice.

Or you can sell short oil ETFs: the U.S. Oil Fund (USO) or shares of oil producers like ExxonMobil (XOM), for example.

Or you can purchase shares of inverse ETFs such as the DB Crude Oil Short ETN (SZO) that are designed to move up when the price of oil goes down.

And if you’re looking for some other ways to trade crude, I know two great ones. 

You can buy put options on oil ETFs or oil producers. This will let you profit on downside in the price of oil and oil names … without having to pony up large amounts of margin to sell short the shares. 

And if you have oil stocks and/or ETFs in your portfolio that you don’t want to part with, you can write call options against those securities if you think a top is in and you’d like to collect some cash payments from selling those calls.

Do right,
JR Crooks

These New Numbers Suggest A Big Year Coming In This Oil Sub-Sector

Here’s one of the most important charts we might see in oil and gas this year. New this week from industry watchdog Wood Mackenzie — showing how many offshore petroleum projects will likely see final investment decisions (FIDs) during 2017.

oilgas

Wood Mackenzie sees a major surge coming this year in investment decisions on offshore oil and gas projects

There are a few important things to note here. First, approvals of new petroleum projects were running strong between 2007 and 2014 — with the blue bar on the left showing how FIDs during this period averaged 40 projects per year.

Move to the 2015 however, and approvals for new project construction fell off a cliff. With only 8 projects getting off the ground that year. 

The past year wasn’t much better — with only 9 projects reaching FIDs during 2016.

That drop-off was triggered by falling crude prices globally. But here’s the good news — even with oil still languishing at $50 per barrel, Wood Mackenzie thinks the coming year will be very good for new projects. 

These experts see at least 20 offshore projects reaching a final investment decision this year. With FIDs potentially reaching as high as 40 projects — returning to pre-oil crash levels. 

Why are so many projects making a comeback even at lower oil prices? Two words: lower costs.

Wood Mackenzie points out that capital costs for offshore projects have fallen 20% since 2014. A fact they say will raise internal rates of return on new projects to an average 16% this year, well above the 9% average IRR for projects launched three years ago. 

All of which shows lower commodities prices are manageable, for the right projects. The consultants say the biggest winners will be smaller projects that benefit most from cost reductions — watch for announcements on project go-aheads for small to mid-sized fields (and likely a few bigger ones) as the year goes on. 

Here’s to finally investing,

Dave Forest
dforest@piercepoints.com

…also from Larry Edelson: Gold’s fate as Western society cracks apart …