
Energy & Commodities
 Larry here, with an important message. Right now, gold is still caught in a trading range, but with a long-term bias toward exploding higher over the next few years to at least $5,000 an ounce.
In other words, gold is in the pressure-cooker right now, and once it blasts off, there may be no turning back.
I have another important warning for you: If you think gold’s next major move higher will be due to inflation, think again: Gold’s next leg higher will be primarily caused by Western society tearing itself apart at the seams.
Not because of inflation. Not because of a collapse in the U.S. dollar, which one well-known — but almost always wrong — analyst keeps predicting.
Just consider all the spying that’s going on which has increased, not decreased. If you haven’t already, go see the excellent documentary “Snowden.”
Where you’ll learn of how our government has a dragnet and has intruded into the privacy of not just every American citizen via electronic devices, but every individual in the world via computers and cell phones. And yes, even heads of state.
Or the moves by many developed countries to go to a digital currency. Or the many countries that are now implementing various capital controls.
Or the high-level cyber-espionage now happening.
Or, Obamacare, a disaster of epic proportions.
Then there are the new moves, behind closed doors in Washington, to make depositors in U.S. banks creditors of the bank, meaning if the bank goes under, a certain amount of your deposits is at risk of substantial loss, as if you were a shareholder in the bank.
And then, of course, there’s the fact that our country is dead broke, bankrupt, and there will be no recovering from it until the system crashes and burns and is allowed to start over, anew.
And my war cycles, which are heating up again in 2017, with May/June showing the most volatility and danger, especially in Europe — forecasting civil strife, a further decline in the euro, Italy leaving the EU and more.
Riots in the streets of Europe and the U.S. More turmoil and war in the Middle East. More friction between China and Japan over the Senkaku Islands. Between China and Southeast Asia over the South China Sea. And more.
All this is why I want you to understand the real driving forces behind the next bull market in the precious metals. Because if you don’t — and instead you’re waiting for inflation or a dollar crash — you’ll miss the boat, big time.
And I don’t want that to happen to you.
So the question then is “Has gold bottomed?”
No, not yet. It’s possible. But I can’t yet be sure. No one can.
Yet, according to my Artificial Intelligence Neural Net Model (the E-wave), it’s showing a decent rally should be forming, which has indeed already started.
That rally should extend into mid-April before a pullback sets in. Look for resistance at the $1,200 to $1,220 levels. Support will be initially found at roughly $1,167 and $1,130. Silver and the other metals — platinum and palladium — will generally follow gold’s path.
Do not expect $30,000 … $40,000 … $50,000 gold. It is not going to happen. Those are merely fear-based promotions based on inaccurate information, designed to part you from your money.
Stay tuned, very tuned in to my writings and analysis of the gold market. In fact, of all major markets. And be sure to read my E-wave columns each Monday, Wednesday and Friday afternoon publishing around 4 p.m. EST. They are short, but very insightful.
Best wishes,
Larry
P.S. Get your free copy of “STOCK MARKET TSUNAMI” right away, click here to download now!
…related: Gold Price Plummets After Trump Win, Huge PM Purchase Opportunity

 Despite a small decline yesterday, the U.S. Henry Hub natural gas benchmark rate is now up 36.7% for the month.
At close yesterday, the price was $3.61 per 1,000 cubic feet or million BTUs (British Thermal Units), the standard measurement in the U.S.
To put that in some perspective, the price was $1.96 as recently as May 26, and the year-to-date low was $1.65 on March 3. Meanwhile, the $3.65 level reached at close on Monday, December 5 was the highest in two years.
Traditionally, the price for natural gas in the U.S. has been heavily by the seasons, with the severity of winters generally being the main determinant of how high prices would go.
But that’s no longer the case…
With demand for natural gas coming from many new sources, the price is no longer tied to the weather – setting prices up to go higher.
Here’s exactly how high the price of natural gas will go in 2017…
Believe It or Not, People Used to Worry About a Lack of Gas
Almost a decade ago, prices jumped above $13 as the result of something else…
Back then, the concern was supply. There was not enough natural gas to meet expected demand, even without considering the newer end-uses for natural gas that we’ll talk about in a moment.
I remember siting in a 2005 meeting of market experts where everyone around the table agreed that at least 15% of natural gas consumed in the U.S. would have to be imported as liquefied natural gas (LNG) by 2020. At least 40% of the rest was expected to come from Canada via pipeline.
Well, along came shale and tight gas – and the picture was fundamentally changed. Today, significant reserves of this “unconventional” natural gas have fundamentally altered the domestic market mix.
This massive shift has led to two results. First, surplus supply inside the U.S. ballooned. Second, the price started coming down – and fast.
As the cost of drilling declined and the amount of extractable gas consistently exceeded estimates, serious discussion emerged about America becoming energy independent, a target likely to become reality even quicker when the prospects for a similar Canadian shale boom is taken into account.
But this rush into shale came with its own cost…
Natural Gas Drillers Became the Victims of Their Own Success
In addition to environmental concerns over the fracking necessary to bring the gas up, the sudden additions to the national surplus produced significant pressure on the sector itself. A rising number of operating companies were threatened by the sheer size of the changes underway.
A natural gas well, even one in a shale play, is much cheaper to drill than anything beyond a very shallow (2,000 foot) oil well. However, a shale well’s primary production comes in over the first 18 months, after which it quickly declines. So producers have a much bigger front loaded volume flow.
The combination of these two factors has run through smaller producers like a wild fire. Combined with the knock-on effect of a major move down in crude oil prices, a rising number of companies came under siege.
Producers needed to replace declining production rates with new wells that were justified as replacement but hardly by the market as such. The combined spike in surplus production just put additional downward pressure on the price of natural gas and further reduced the profitability at the well head (where companies get paid well below the final market price).
Now, companies will regularly hedge contracts forward to shield themselves from declining prices. But that approach only works if there are genuine prospects that prices will improve. Otherwise, the cost of hedging becomes untenable.
At the current price for natural gas, companies are once again getting access to money (through debt and issuing new stock) needed to subsidize forward operations. This used to be the norm, with most producers operating cash-poor – bringing in less from gas sales than current operations cost. The difference was covered by debt or selling new stock, with sale revenue used for acquisitions, dividends, or stock buy-backs.
Increasing field efficiency and new technology has further lowered costs. With natural gas trading north of $3.50, wells in basins such as the Marcellus are now profitable. But this is still a precarious balance…
My Natural Gas Price Forecast for 2017
All analysts understand that natural gas is in the early stages of major expansion in its usage.
The demand side is no longer dictated only by how cold winters get. While seasonal considerations are still important, we have discussed here in Oil and Energy Investor on several occasions that the future use of natural gas lies elsewhere.
The transition from coal to gas for electricity generation is already well underway. In addition, the export of LNG from the U.S. to higher-priced markets has begun, with the guarantee of adequate supply for the establishment of spot markets elsewhere likely to offset the higher cost of bringing U.S. LNG into competition.
Decisions to construct cracker plants outside Pittsburgh and on the Gulf Coast are the latest indicators of a rise in using natural gas value-added products to replace those made from oil in the production of petrochemicals.
Then there is the widening industrial use for gas and the transition from gasoline to LNG and compressed natural gas (CNG) for vehicle fuel – both in normal and hybrid engines. That exchange has been accelerating on the large-end truck side of the scale, along with metropolitan buses and taxis. The smaller car engine part of the spectrum will still take a bit longer.
As for the surplus, in the U.S. it currently stands at about 4 trillion cubic feet. While high, it’s been stable and is now only slightly above the five-year average. This should be enough to provide a floor supporting a slowly strengthening price.
On the other hand, all of this depends on operators being able to strike their own balance between immediate revenue needs and longer-term market trends. The supply is certainly there and the demand is increasing.
Yet an improving natural gas picture is now in the hands of the producing companies.
I estimate natural gas prices will test $4.50 before the current cycle flattens out. By that point, probably mid-2017, the demand for broader uses will determine the next price level.
….related: Calling Putin’s Bluff
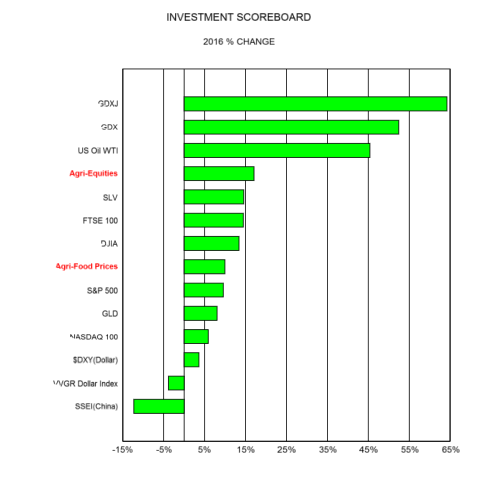
When has food been more valuable than technology? Aside from all of history, that was especially true in 2016. Chart below is our Investment Scoreboard for 2016. In it are portrayed the returns for a variety of important market measures. Gold stocks, Silver, oil, and Agri-Equities clearly owned the year. Agri-Equities, number four in chart, substantially outperformed most of the equity markets. In 2016 food was clearly more valuable than those tired, old, over owned technology and internet stocks as indicated by the NASDAQ 100 being far down in the list.
….related: Chart: How Every Commodity Performed in 2016
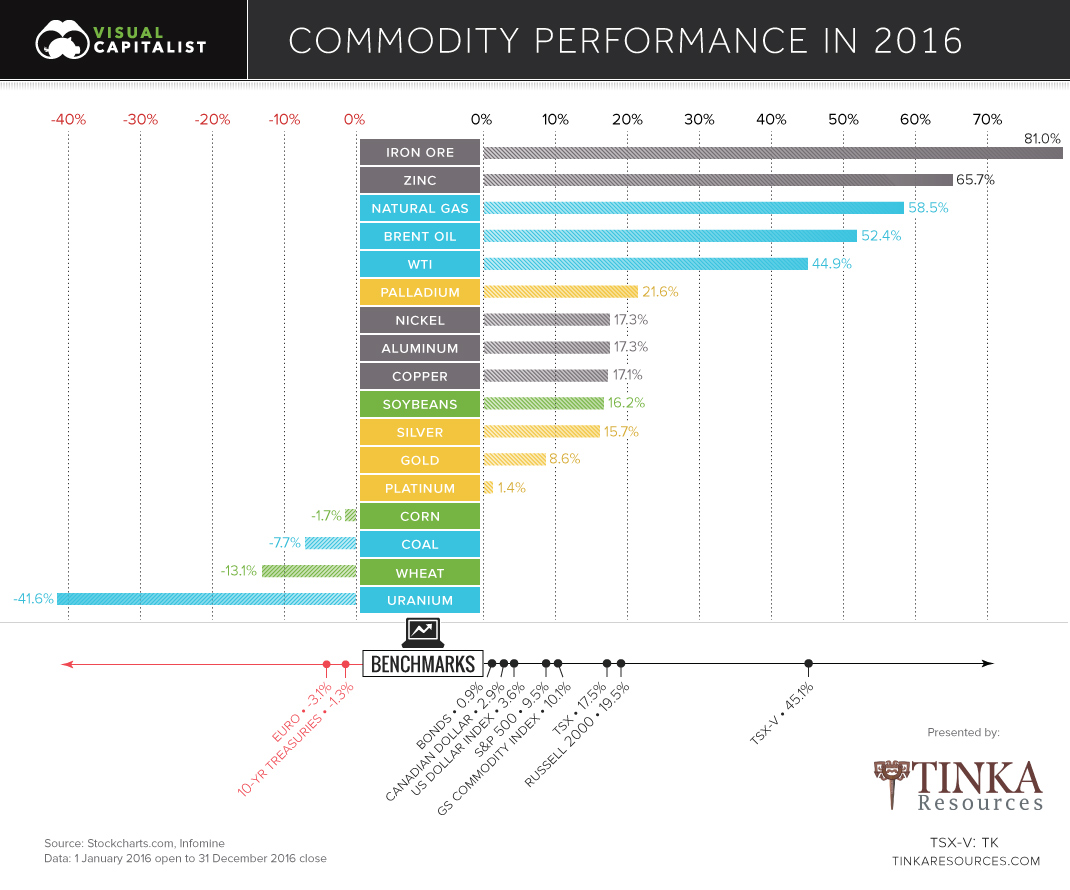
2016 Commodity Performance
It was an up and down year for commodities, but things ultimately finished in the black.
The S&P Goldman Sachs Commodity Index (GSCI) climbed 10.1% on the year – it was just enough to edge out the S&P 500, which ended 2016 with a 9.5% return.
Winners in 2016
The biggest winners on the year were base metals and the oil and gas sector.
Here’s how base metals did:
| Base Metal | Q1 | Q2 | Q3 | Q4 | 2016 |
|---|---|---|---|---|---|
| Iron Ore | 37.0% | -6.2% | 6.3% | 31.1% | 81.0% |
| Zinc | 20.0% | 13.1% | -3.2% | 26.1% | 65.7% |
| Nickel | -3.1% | 13.9% | 11.9% | -5.0% | 17.3% |
| Aluminum | 3.8% | 7.2% | 1.4% | 4.0% | 17.3% |
| Copper | 0.1% | 3.9% | -0.5% | 13.1% | 17.1% |
Iron ore and zinc were the best performing commodities on the face of the planet in 2016. Iron finished up 81%, its first calendar gain in four years. Meanwhile, zinc shot up 65.7% on the year as major zinc mines shut down, and supply stockpiles dwindled.
Oil and gas also posted a major comeback in 2016:
| Energy | Q1 | Q2 | Q3 | Q4 | 2016 |
|---|---|---|---|---|---|
| Natural gas | -17.0% | 53.3% | -2.7% | 28.0% | 58.5% |
| Oil (Brent) | 0.6% | 35.1% | -1.2% | 13.6% | 52.4% |
| Oil (WTI) | -3.2% | 37.3% | -2.1% | 11.4% | 44.9% |
It was a volatile year overall, but it appears that the worst of the downturn in energy prices is over.
Losers in 2016
Not all energy-related commodities could be so lucky.
Uranium continued its epic nosedive, losing -41.6% on the year. U3O8 now trades for $20.25/lb, a tiny fraction of its previous highs of over $100/lb in 2007.
| Energy Losers | Q1 | Q2 | Q3 | Q4 | 2016 |
|---|---|---|---|---|---|
| Uranium | -16.0% | -7.4% | -12.0% | -14.7% | -41.6% |
| Coal | 0.5% | -9.3% | 1.3% | 0.0% | -7.7% |
Coal has also performed abysmally, at least in North America where CAPP prices finished down on the year -7.7%. We previously showed the decline of coal in three charts, and it seems that coal will likely continue to be an unpopular choice for utility companies in the U.S. and Canada.
That said, it is worth mentioning that Australian coal prices went bonkers earlier this year due to a Chinese administrative oversight.
New year, same old market.
Only now we’ve finally got some momentum going in oil. Prices surged above $55 per barrel on the first trading day of the year on news that OPEC had not only agreed to a production output, but was actually going through with it.
If you’ve been watching the market the last few years, you’ll know those are two entirely different things. But the issue has finally come to a head; the group can’t afford to keep suppressing prices as it’s been doing since 2014.
By now I’m sure you’ve guessed that “the group” mainly means Saudi Arabia. The country’s income is tied a great deal to oil, though it’s working to reduce its reliance on the commodity as much as possible.
And the House of Saud isn’t the only oil royalty suffering at the hands of low prices…
Russia Takes a Hit
Late last year, we saw yet another OPEC meeting come and go, only this time it ended with a real decision: the group called for a global oil production cut.
For the first six months of 2017, 1.2 million barrels per day will be cut from various OPEC members’ production levels, not including Libya and Nigeria, which had already seen production decreases due to unrelated circumstances over the past year.
The vast majority of this is, predictably, coming out of Saudi Arabia’s share, and will still leave the country with production levels above 10 million barrels per day if it cuts from its record December numbers.
But it’s not just OPEC that’s participating in the cut. The group stated that it would only agree if other non-members were to join it in reducing output, and several countries hopped on board.
 One of these was Russia, another top global oil producer. Putin has long been a supporter of a production cut and has been a notable part of many of the past year’s meetings on the subject.
Taking a look at his country’s finances, it’s no wonder why.
Russia’s economy, much like Saudi Arabia’s, is largely tied to oil exports. In 2014, the country’s export revenues amounted to $449 billion. That number dropped 33% to $331.5 billion in 2015.
More than half of the country’s exports are tied to oil, including crude oil and refined petroleum products.
When oil prices were cut to less than half of their 2014 highs, Russia lost a huge chunk of its income all at once. It’s been dealing with the effects of this loss ever since.
In 2015, the country ran on a budget deficit of nearly $25 billion, 2.5% of its GDP.
Even though earlier expectations called for the 2016 deficit to be smaller, the latest numbers are estimating that it grew to between 3.5% and 3.7% of GDP instead.
This was due to one major mathematical flaw:
“Our budget will be balanced when the price is $82 per barrel, so there are still a lot of decisions to be made when it comes to budget policy,” said Russian Finance Minister Anton Siluanov in January last year.
With prices bouncing around $40 for most of the year, $82 was really a stretch. Even Business Insider’s recalculation that the country could at least break even at $68 per barrel was a bit much to hope for, considering we’re only just now entering the real recovery.
Will It Cut?
Let’s take a look at what that break-even point would look like for Russia:
Its 2017 budget is based on oil at $40, which we’ve already surpassed. Now, that may make it look like the country doesn’t really need to participate in the cut at all, since it’s clearly reduced expectations.
But you have to keep in mind that this budget includes massive cuts elsewhere.
The country has already begun draining its reserve funds, reducing funding for social services, and even decreasing the salaries of government workers.
It’s also been borrowing more from foreign partners. In 2015, the country managed to pay down its foreign debt by more than $85 billion, but it has plans to start borrowing again, as much as $7 billion throughout 2017.
And with all this, the country still only expects to break even with a 3% deficit for the year.
Last year, the country revised its budget plan to account for all these cuts… but increased overall government spending by nearly $5 billion, presumably on defense and militarization.
To rein in the overspending and stop the deficit from getting any worse, Russia’s Finance Ministry wrote up a plan to nominally freeze the country’s budgetary allocations at 2016 levels for the next three years. Government spending would be stuck at about $260 million per year until 2019.
So what does this mean for Russia’s part in the production cut?
Well, the country doesn’t have much of a choice but to comply. It desperately needs the higher prices to get out of the hole it’s dug itself into.
Now, the cut is only supposed to last through the first half of 2017, though it could be extended if participants decide that’s necessary to balance the market back out.
If Russia wants a say in that decision, it will have to play nice with the other producers.
The Tipping Point
There’s always a mess of things that can go wrong when you get large numbers of geopolitical powers in on the same deal.
But for now, I expect we’re actually going to see some cooperation.
The two biggest players, Saudi Arabia and Russia, are in the same boat: they literally cannot afford to keep prices this low any longer.
And the U.S. — though I fully expect it to start grabbing up market share while it can — also won’t be too quick to pressure oil back down to the lows we’ve been seeing. Too many companies have been working at a loss to let that happen so soon.
Until next time,

Keith Kohl
 @KeithKohl1 on Twitter
A true insider in the energy markets, Keith is one of few financial reporters to have visited the Alberta oil sands. His research has helped thousands of investors capitalize from the rapidly changing face of energy. Keith connects with hundreds of thousands of readers as the Managing Editor of Energy & Capital as well as Investment Director of Angel Publishing’s Energy Investor. For years, Keith has been providing in-depth coverage of the Bakken, the Haynesville Shale, and the Marcellus natural gas formations — all ahead of the mainstream media. For more on Keith, go to his editor’s page.


-
I know Mike is a very solid investor and respect his opinions very much. So if he says pay attention to this or that - I will.
~ Dale G.
-
I've started managing my own investments so view Michael's site as a one-stop shop from which to get information and perspectives.
~ Dave E.
-
Michael offers easy reading, honest, common sense information that anyone can use in a practical manner.
~ der_al.
-
A sane voice in a scrambled investment world.
~ Ed R.
Inside Edge Pro Contributors

Greg Weldon

Josef Schachter

Tyler Bollhorn

Ryan Irvine

Paul Beattie

Martin Straith

Patrick Ceresna

Mark Leibovit

James Thorne

Victor Adair