
How is it that Canada could be dependent on U.S. oil production? As of 2015, 36% of total U.S. crude imports come from Canada. As Canada continues to exports over 3 million barrels per day of oil to the U.S., what direct role does the U.S. have in allowing Canadian oil to flow southward?
Energy & Commodities
 Summary
As of 2015, 36% of total U.S. crude imports come from Canada.
Canada is a large exporter of low API grade crude referred to as heavy crude oil, most of which comes from Canada’s bituminous Oil Sands deposits.
To deal with the lack of fluid-flow of Canadian heavy oil and bitumen, some oil production is partially refined to produce synthetic crude, which creates more fluidity.

FCC Releases Canadian Agriculture’s Productivity and Trade Report

For 2016 to date:
Agri-Equities: +18%
S&P 500: +11%
NASDAQ: + 9%
Farm Credit Canada (FCC) has released its latest Canadian agriculture productivity and trade report.
The purpose of the report is to look at the overall performance of Canadian agriculture and world markets.
FCC chief economist J.P. Gervais explains what sets Canada apart from other countries when it comes to productivity.
“We’re the fifth largest exporter when it comes to agriculture commodities in the world. The idea that we’ve been able to grow production on our farms faster than the rate of growth of farm inputs. Because of that we manage to grow our exports in world markets, that’s what really sets us apart in when it comes to expanding our success in the world markets,”
Gervais notes that 30 per cent of Canada’s income in the ag sector comes from exports to the United States, although that could change in the future.
“We have diversified the importance of the US market, we’ve diversified away from the US, in terms of relying on the US as an export destination over the last few years. I think we’re going to be able to continue doing the same, I think it’s a good strategy, we’re going to always the United States for probably a long time, but diversifying away from the US is actually a pretty good thing,” Gervais said.
Canada was the world’s fifth largest agriculture exporter in 2015.
An investment reality is that neither bear nor bull markets last forever. From high, July 2014, to low, October 2016, the Agri-Food Price Index fell 23%. Since that low, this index of 18 Agri-Commodity prices has risen 19%, and is nearing a new 52-week high. If we accept the popular notion that a 20% rise from a low signals a new bull market, Agri-Commodity prices may be birthing a new bull market. Chart below is for Agri-Food Price Index over the past year.
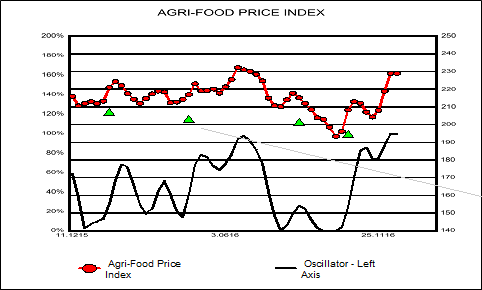
Above chart is not the only observable hoof print of perhaps a new Agri-Commodity bull market emerging. In chart below is plotted the year-to-year percentage change for Agri-Food Price Index. Recently, that measure moved sharply higher into positive territory. That condition has not existed since beginning of 2015, when price index was basically moving down. This momentum measure is good picture of developing strength in Agri-Commodity prices.

In chart below percentage gains from 52-week lows for each of 18 Agri-Commodity prices are portrayed. While range is fairly large, average gain from lows is 31%. Thus far, 8 Agri-Commodities, or 44%, have gains in excess of 20%. As harvests in general have been good this year, demand has been source of energy for prices. For example, number three in chart is dollar price of Malaysian palm oil, which seems to have ignored forecasters most of the year. Palm oil is the most important vegetable oil to global consumers, especially in Asia. Consumer demand for this oil has been strong, pushing dollar prices up more than 30%, and Malaysian prices to multi year highs.


At heart of this price performance is demand, a topic largely ignored by many commodity traders. In chart to right, using USDA global estimates for wheat, corn, and soybeans, red bars are growth rates for demand projected over two year period beginning with 2015 and ending with crop year 2017. Growth rates for supply for same period are in green. As is readily apparent, demand growth is faster than supply, a condition that is generally supportive of prices.
With volumes in Agri-Industries strong this year due to good harvests and a turn in pricing, Agri-Equities have been rewarding for investors. In our last chart below are plotted 2016 returns to date for Agri-Equities, S&P 500, and NASDAQ Composite. Winner is fairly obvious, and not actually surprising. Agri-Equities have returned nearly double that of the NASDAQ Composite. Also note that NASDAQ 100, home of popular tired, over owned, and over priced “growth” stocks, has also failed to be competitive with Agri-Equities.

Ned W. Schmidt,CFA is publisher of The Agri-Food Value View: www.agrifoodvalueview.com

Perspective
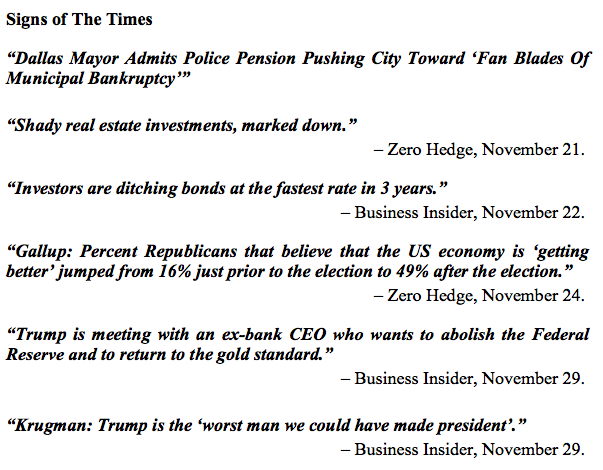
It is uncertain if Krugman knew about the discussion of a gold standard. Possibly not, as he would have become apoplectic and unable to comment. The “ex-bank CEO” is John Allison who recently retired as president of the Cato Institute. Our comment on a convertible dollar has been that it “manages” the ambition of government. This contrasts with the long-running promotion that a committee of experts must have a fiat currency so they can “manage” the economy. In so many words, a convertible currency disciplines predatory bureaucracy.
The Republican platform in the 1980 election included the constraint and honesty of a gold standard. A serious attempt was made, but was derailed by the serious recession that began in 1981. Also, Democrats had the majority in both houses.
With their strongest position since 1928, the Republicans have a mandate for reform. That would be towards a civil service and administration bound by constitutional norms. It is almost startling to think that immigration agencies would obey their own regulations.
Other interesting news is the sharp decline in the November post on the satellite global temperature. This set a big high with the 2015-2016 El Nino and the drop is steeper than the one following the last strong El Nino in 1989. It is now plunging at the fastest pace on the 28-year record.
A few months ago, climatologist Roy Spencer updated the chart. This showed the decline needed a significant plunge to resume the 18-year flat trend. It looked a long way, but it is almost there now.
The main forces acting to restore the flat-lining trend are that the El Nino weather-event is over and the Solar Minimum, which is a climate event, continues. November 22nd and 23rd set two “zero” days, making 25 for the year. The last cyclical minimum clocked 260 “spotless” days in 2009 and 51 days in 2010.
Inspired by experts, the overbearing state needs to maintain the front of omniscience as well as the endless funding. More and more people are becoming indifferent to its climate propaganda. A cool winter could spread skepticism.
And we all know that state funding relies upon the perpetual financial bubble. The plunge in long-dated Treasuries since July is serious. The crash in Municipal bonds is worse. The bond bubble is in the early stages of a profound deflation.
Currencies
We have had two reasons for the firming dollar. One is the chart pattern and the other will be debt service into New York payable in US dollars. Now, there is another reason. The Republican majority will redirect the Federal Reserve from reckless speculation to prudence. This could be disquieting to interventionist economists. They could eventually be reduced from rent-seekers to real job seekers. How many reckless economists can The New York Times hire a columnists?
On the chart, the DX needed to rise through the 20-Week ema, which was accomplished on October 1st at 95.5. At the 101 level now, there is resistance at the 102 level. Our longer-term target has been 112.
With firming commodities, the Canadian dollar has recovered from 73.59 in early November to 74.50. Getting above the 20-Week ema at 75.35 would be constructive.
Precious Metals
There are some cross-currents, which can be fun if you are a white-water kayaker. In the financial markets, it can be an intellectual challenge.
With the intent of making financial speculation perpetual, central bank recklessness became unlimited. Market distortions are without precedent and we all know about reversion to the mean. As in central bank practices. The most distorted market is that for interest rates.
Politics and finance can never be separated and history is working on a profound change. People are taking political power from the “experts” into their own hands, which is constructive. This will also involve the equivalent in finance. The confection of a national currency has been to serve the state, not the markets. On the Great Reformation, the public will “privatize” national currencies by forcing convertibility. Gold has always provided the best choice.
A complete reformation will include making the senior currency convertible into gold. In anticipation of this, one would not buy gold or Treasuries. It will take a few years.
As part of the last Great Reformation, in 1717 Isaac Newton put England on to a bi- metallic standard. This became a simple gold standard.
In the meantime, the prospect of a firming dollar prevents us from getting excited about a possible outstanding rally for gold in US dollars. The same holds for silver, making this another ideal time to avoid fundamental studies that “prove” there is a “concerning” shortage of silver.
As noted last week, gold stocks relative to the bullion price will need to end the decline that began in early August.
Using HUI/Gold, the worst was 142 in early November. The next low was 144 and at 150 now, breaking above 155 would be constructive. Getting above the 50-Day at 163 would set the uptrend. With some technical improvement in this indicator, one could begin to accumulate gold stocks. Lightening up on the hot coal and base metal stocks would also be timely.
Link to December 2, 2016 Bob Hoye interview on TalkDigitalNetwork.com:
http://www.howestreet.com/2016/12/02/us-canada-post-promising-gdp-numbers/
Trading position (short-term; our opinion): No positions are justified from the risk/reward perspective.
On Friday, crude oil gained 1.21% as OPEC deal continued to support the price of the commodity. In this environment, light crude re-approached the Oct high. Will we see fresh 2016 peak in the coming week?
Let’s take a look at the charts below to find out (charts courtesy of http://stockcharts.com).

On Friday, we wrote the following:
(…) With yesterday’s increase light crude broke not only above the barrier of $50, but also the red resistance line (based on the Aug and Sep lows), which triggered further improvement and a rally above the upper border of the blue rising trend channel. Despite this move, the black resistance line (based on the Feb and Aug lows) in combination with the proximity to the Oct high encouraged oil bears to act, which resulted in a pullback and a daily closure below both resistance lines.
Such price action means that light crude invalidated the breakout above upper line of the blue trend channel and suggests a verification of the breakdown under the black resistance line which doesn’t bode well for oil bulls. If this is the case, we may see a correction of recent rally and a drop to the previously-broken red line based on the Aug and Sep lows (currently around $50.15)
From today’s point of view, we see that the situation developed in line with the above scenario and crude oil moved lower after the market’s open, reaching our initial downside target. Despite this drop, the proximity to the barrier of $50 encouraged oil bulls to act, which resulted in a rebound and a comeback to the Thursday’s high.
As you see, with Friday’s increase, the commodity also moved above the previously-broken upper borer of the blue rising trend channel, invalidating earlier breakdown. Although this is a positive development, which suggests further improvement and a test of the Oct high, we should keep in mind that the medium-term black resistance line based on the Feb and Aug lows remains in play, keeping gains in check (as a reminder, as long as there is no daily closure above this line all upswings could be nothing more than a verification of earlier breakdown).
Additionally, this area is also reinforced by the long-term red resistance line (based on the previous peaks), which successfully stopped earlier rally in Oct.

On top of that, the size of volume that accompanied recent increases (since Wednesday) has steadily decreased, which suggests that the rally can go without steam and reversal in the coming days should not surprise us. If this is the case and we see a correction of the recent rally, the initial downside target would be the previously-broken red line based on the Aug and Sep lows, the Nov 22 high of $49.20 or even the 50-day moving average.
Summing up, crude oil bounced off the previously-broken red rising line and re-approached the Oct high. Despite this move, the medium-term black resistance line based on the Feb and Aug lows and the long-term red resistance line based on the previous peaks continue to keep gains in check, which means that as long as there won’t be a breakout above them further rally is not likely to be seen.
Very short-term outlook: mixed
Short-term outlook: mixed
MT outlook: mixed
LT outlook: mixed
Trading position (short-term; our opinion): No positions are justified from the risk/reward perspective.
Thank you.

-
I know Mike is a very solid investor and respect his opinions very much. So if he says pay attention to this or that - I will.
~ Dale G.
-
I've started managing my own investments so view Michael's site as a one-stop shop from which to get information and perspectives.
~ Dave E.
-
Michael offers easy reading, honest, common sense information that anyone can use in a practical manner.
~ der_al.
-
A sane voice in a scrambled investment world.
~ Ed R.
Inside Edge Pro Contributors

Greg Weldon

Josef Schachter

Tyler Bollhorn

Ryan Irvine

Paul Beattie

Martin Straith

Patrick Ceresna

Mark Leibovit

James Thorne

Victor Adair