
Energy & Commodities
 The oil market is overjoyed and back above $50 a barrel following this week’s OPEC deal to cut production by 1.2 million barrels per day (bpd). The deal is expected to rebalance global inventories, perhaps in the first half of 2017.
I’ve got one word for that: Malarkey!
The fact is, oil’s in a temporary upswing at best. My models have been predicting bearish action in oil for a while now and I’ve spared no breath telling you about it. (More on this in a moment.)
And they’re not alone. Here are the latest reasons that oil is going down … and going down hard.
Bearish Factor #1: OPEC has a lackluster history of compliance with these kinds of deals: Over the last 17 production cuts – from 1982 to 2009 – their cuts came in at just 60% of what they promised. That translates to a measly 720,000 bpd — a drop in the bucket compared to world petroleum and liquids production of 96.26 million bpd.
Bearish Factor #2: Will non-OPEC member nations follow through with a 600,000 bpd cut? That’s a tall order with Russia already watering down their ability to cut their allotted 300,000 bpd because of “technical issues”.
Bearish Factor #3: The November 9th non-OPEC member meeting is liable to nix the entire OPEC deal before it even begins. Mexico already said they won’t cut their allotted 150,000 bpd in 2017. And Norway, Kazakhstan and Oman are sending mixed messages.
Bearish Factor #4: Even if all parties (OPEC and non-OPEC members) comply with stated adjustments, there are still concerns over supply and demand not addressed by the cartel.
Bearish Factor #5: Oil demand uncertainties have been moved to the back burner with headlines of a deal — but they’ve not gone away: Higher U.S. interest rates and a surging dollar — just like I predicted — are going to slam oil demand.
Bearish Factor #6: Recent data from China shows oil imports falling to their lowest level of the year in October. Plus, oil demand could come under added pressure from the yuan devaluation.
Bearish Factor #7: Then there’s economic uncertainty in India after Prime Minister Modi’s demonetization maneuvering, which is a threat to their appetite for crude oil.
Bearish Factor #8: Higher oil prices encourages greater production, which exacerbates an already massive global oil glut. In fact, the latest weekly stats from the U.S. Energy Information Administration shows oil production up 250,000 bpd in the last two-months to 8.699 million bpd.
I expect this figure to ratchet sharply higher with oil prices above $50, especially as U.S. shale producers have become technologically efficient. And higher oil prices will only bring more U.S. supply online.
Bearish Factor #9: Prospects for President-elect Trump’s administration to ease regulations on U.S. oil producers is another factor that aims at greater output, not less.
Why is this important to You?
The initial excitement surrounding the OPEC deal means prices are bid up artificially. That creates an ideal selling — not buying — opportunity. And like I said, that’s right in line with what my models have been calling for all along: Lower oil prices into early February. Take a look:
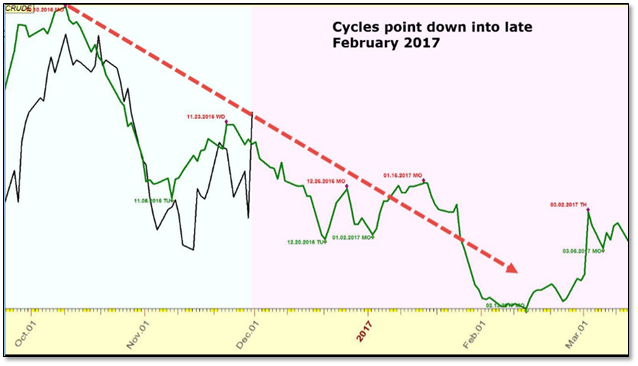
I’ve advised my members to begin positioning for the next leg lower in oil prices. They stand to make a bundle as excitement over OPEC’s latest scheme fizzles and global market realities come home to roost.
Be proactive, guard your wealth and take advantage of these market anomalies by subscribing to the Real Wealth Report today.
Best wishes,
Larry

 This is a big OPEC’ing deal. While the naysayers said it could not be done, OPEC went ahead and did it anyway. The cartel agreed to cut production by 1.2 million barrels a day(mbd) to 32.5 mbd and has enticed non-OPEC producers to add another 600,000 barrels. Now that the months in making the deal is done, what does this mean for oil as well as the outside market.
Well, first, I don’t think you can doubt OPEC’s commitment to making these cuts work. Not only will they have OPEC countries monitor compliance, they will also have an independent group count the barrels. In other words, they will have monitors montoring the monitors. Kuwait, Venezuela and Algeria will be montoring compliance and a disinterested third party will be keeping score of the barrels produced.
also: Copper Poised to Surge

 Watch For This Africa X-Factor In Copper Prices For 2017
Warnings of a potential surge coming in global copper prices this week. Emerging from a place few observers in the space are focused on.
The southern Africa producing nation of Zambia.
Industry sources in Zambia told Reuters this past week that some big changes are quietly afoot in the copper market here. Triggered by a change in government policy for local smelters.
That’s a new tax reportedly being introduced by the Zambian government on imports of copper concentrates. With officials apparently planning to tax incoming shipments of concentrate at up to 7.5%.
Here’s why that matters for global copper prices.
Industry sources said the proposed tax would likely make concentrate imports uneconomic for most Zambian smelters. With these buyers unable to make a profit if the additional levy is added on top of already-thin margins.
That would likely bring a halt to concentrate imports into Zambia. Which currently run at least 500,000 tonnes yearly, coming from mines in the neighboring Democratic Republic of Congo.
Industry sources said the sudden surplus of Congolese concentrate would “upset the supply chain for the first six months of 2017.” With 500,000 tonnes of concentrate supply here now seeking buyers elsewhere in the world – possibly in China or India, shipped through South African ports.
Given the long distance involved, it could take up to two months for these concentrates to start reaching smelters. With sources estimating that up to 150,000 tonnes of copper metal production could be delayed by the transit.
That could result in a short-term supply squeeze. Potentially spiking copper prices higher, at least for a few months in early 2017.
Zambia’s smelters have reportedly been pressuring the government to drop the new tax. Watch for a final decision on this critical legislation, and for resulting effects in copper supply and prices if the measure does go ahead.
Here’s to butterfly wings flapping,

Dave Forest
dforest@piercepoints.com
Originally published on Nov 29, 2016, 9:35 AM
Trading position (short-term; our opinion): No positions are justified from the risk/reward perspective.
Crude oil gained 2.21% yesterday and came back above $47, but taking a dive today, confirming that closing the long positions yesterday and taking profits off the table was a good idea. Now, the question is how much does today’s decline actually change.
Let’s take a look at the charts to find out (charts courtesy of http://stockcharts.com).
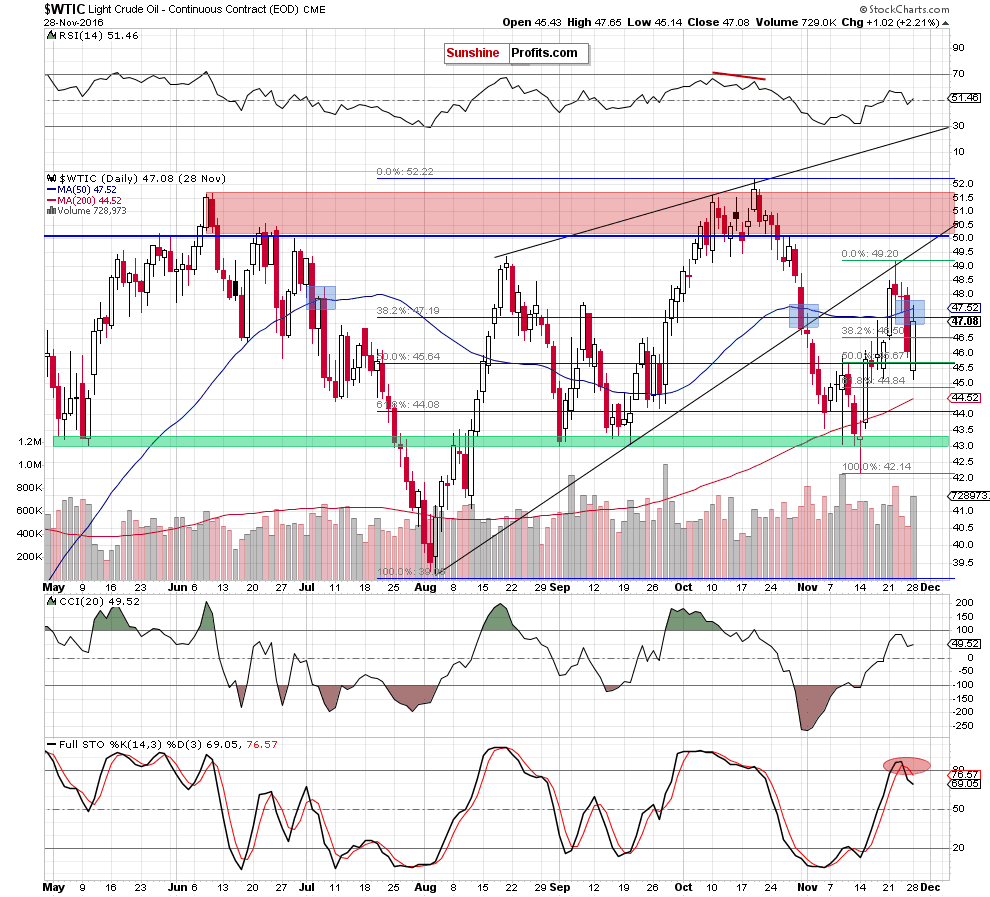
Looking at the daily chart, we see that crude oil bounced off the mid-Now lows and climbed above $47, reaching the previously-broken 50-day moving average. We saw similar situation at the beginning of Jul and at the turn of Oct and Nov. In both previous cases, verification of breakdowns preceded further declines, which increases the probability of the realization of our yesterday’s outlook:
(…) With Friday’s decline, the commodity also slipped below the 50-day moving average and Fibonacci levels, which doesn’t bode well for light crude – especially when we factor in a sell signal generated by the Stochastic Oscillator. Taking all the above-mentioned negative factors into account, it seems that crude oil could extend losses and even a test the previously-broken 200-day moving average in the coming days.
With the outlook being rather bearish despite yesterday’s upswing, it is quite natural to view today’s decline as a confirmation. Besides, the bearish scenario is also supported by the current situation in the oil-to-gold ratio.
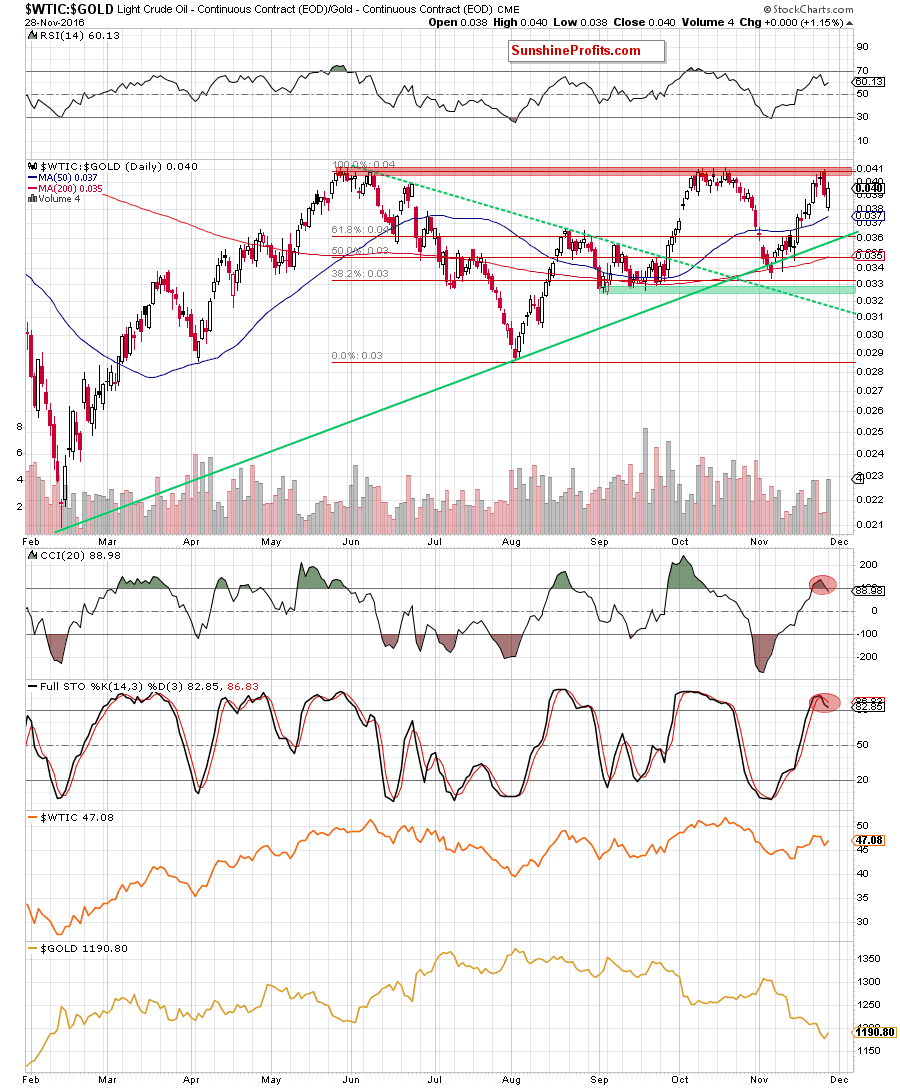
From this perspective, we see that the ratio reached the key red resistance zone, which stopped increases in Oct. This area triggered also a pullback on Friday, which in combination with sell signals generated by the CCI and Stochastic Oscillator suggests that lower values of the ratio (and crude oil as strong positive correlation remains in play) are just around the corner.
Summing up, although crude oil rebounded yesterday, the 50-day moving average stopped further improvement, which in combination with a sell signal generated by the Stochastic Oscillator and the current situation in the oil-to-gold ratio suggests that we’ll see another attempt to move lower and even a test the 200-day moving average in the coming days. For now, it seems that keeping the profits from the previous trades intact and waiting for another trading opportunity is justified from the risk to reward point of view.
Very short-term outlook: mixed
Short-term outlook: mixed
MT outlook: mixed
LT outlook: mixed
Trading position (short-term; our opinion): No positions are justified from the risk/reward perspective.
Thank you.
….also:
Stock Trading Alert: New Record Highs, But Will The Uptrend Continue

When a massive country de-nationalizes its entire energy sector and opens its oil and gas doors for the first time ever to foreign companies, the opportunities are staggering.
Welcome to the ‘new’ Mexico, and welcome to the early stages of an oil and gas game that will be bigger—from an investor’s perspective—than anything in history.
….related:
Canada Vows To Abandon Coal By 2030
As United States President-elect Donald Trump vows to revive the nation’s waning coal industry, the North American country’s northern neighbor announced new plans to speed up the abandonment of the powerful polluter.

-
I know Mike is a very solid investor and respect his opinions very much. So if he says pay attention to this or that - I will.
~ Dale G.
-
I've started managing my own investments so view Michael's site as a one-stop shop from which to get information and perspectives.
~ Dave E.
-
Michael offers easy reading, honest, common sense information that anyone can use in a practical manner.
~ der_al.
-
A sane voice in a scrambled investment world.
~ Ed R.
Inside Edge Pro Contributors

Greg Weldon

Josef Schachter

Tyler Bollhorn

Ryan Irvine

Paul Beattie

Martin Straith

Patrick Ceresna

Mark Leibovit

James Thorne

Victor Adair