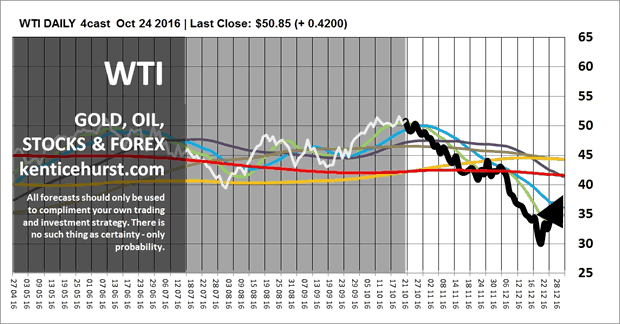
Wednesday October 26, 2016- 3:00pm Pacific (MT Ed: Stephen went bearish crude Oct 25th after gaining $10 being bullish from August 3)
DOW + 30 on 850 net declines
NASDAQ COMP – 33 on 1000 net declines
SHORT TERM TREND Bullish
INTERMEDIATE TERM TREND Bullish
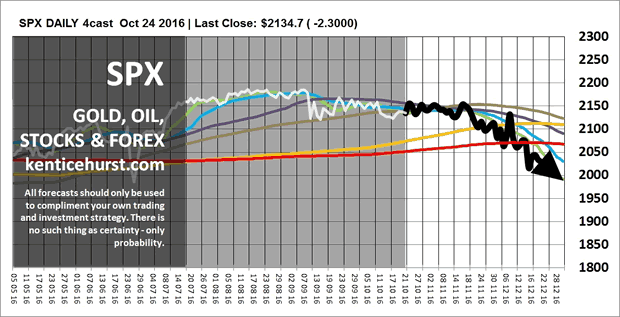
STOCKS: Apple reported its first annual revenue decline in 15 years and led the stock market lower. Boeing helped buoy the Dow by rising over 4% on higher guidance.
Oil prices dragged the overall market lower even though inventories showed a drawdown.
GOLD: Gold was down $7. The Wall Street Journal said that rate concerns were responsible for the decline. In other words, they don’t have a clue. Sometimes it’s just more buyers than sellers. It certainly wasn’t the dollar.
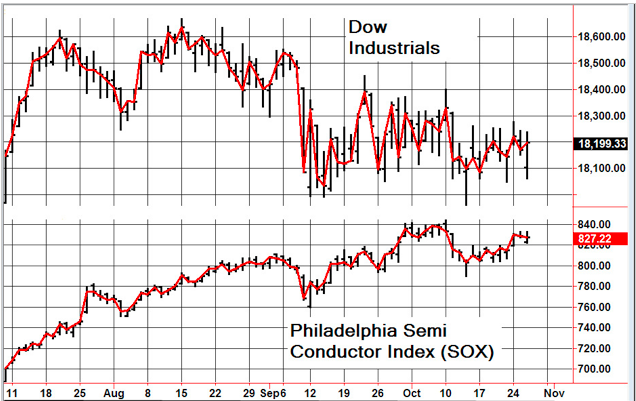
CHART We’re somewhat encouraged that the Philadelphia Semi conductor index has been outperforming the Dow. When this happens, it shows that investors still have animal spirits. These are riskier than average stocks.
BOTTOM LINE: (Trading)
Our intermediate term system is on a buy.
System 7 We bought the SSO at 68.82. Let’s sell at the close on Thursday.
System 8 We are in cash. Stay there.
News and fundamentals: he trade deficit was $56.1 billion, less than the expected $60.5 billion. New home sales were 593,000, less than the anticipated 601,000. Oil inventories dropped 600,000 barrels. Last week they dropped 5.2 million. On Thursday we get durable goods, jobless claims and pending home sales.
Interesting Stuff: I am for doing good to the poor, but I differ in opinion about the means. I think the best way of doing good to the poor is not making them easy in poverty, but leading or driving them out of it. ———-Benjamin Franklin
TORONTO EXCHANGE: Toronto was down 63.
BONDS: Bonds lower.
THE REST: The dollar was slightly lower. Silver was lower as was crude oil.
Bonds –Bearish as of Oct. 4.
U.S. dollar -Bullish as of August 30.
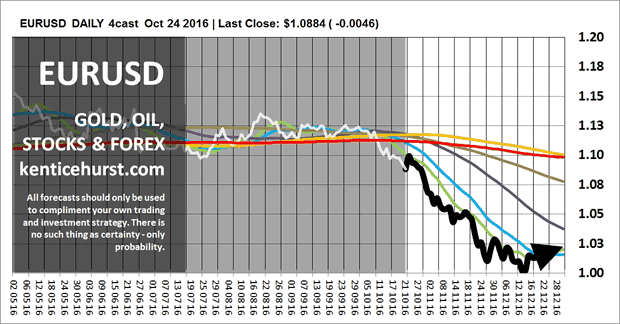
Euro — Bearish as of August 30.
Gold —-Bullish as of October 19.
Silver—- Bullish as of October 25.
Crude oil —- Bearish as of October 25.
Toronto Stock Exchange—- Bullish from January 22.
We are on a long term buy signal for the markets of the U.S., Canada, Britain, Germany and France.
www.toddmarketforecast.com
…also: Monthly Charts Argue for Lower Prices in Precious Metals Complex
|
|
Wed.
|
Thu.
|
Fri.
|
Mon.
|
Tue.
|
Wed.
|
Evaluation
|
|
Monetary conditions
|
0
|
0
|
0
|
0
|
0
|
0
|
0
|
|
5 day RSI S&P 500
|
54
|
50
|
49
|
65
|
50
|
44
|
0
|
|
5 day RSI NASDAQ
|
51
|
48
|
57
|
75
|
60
|
45
|
0
|
|
McCl-
lAN OSC.
|
+17
|
-10
|
-9
|
+19
|
-16
|
-56
|
0
|
|
Composite Gauge
|
6
|
8
|
8
|
9
|
13
|
12
|
0
|
|
Comp. Gauge, 5 day m.a.
|
10.4
|
9.6
|
8.8
|
8.2
|
9.2
|
10.4
|
0
|
|
CBOE Put Call Ratio
|
.94
|
.98
|
.97
|
.91
|
.98
|
.90
|
0
|
|
VIX
|
14.41
|
13.75
|
13.34
|
13.08
|
13.46
|
14.24
|
|
|
VIX % change
|
-6
|
-5
|
-3
|
-2
|
+3
|
+6
|
+
|
|
VIX % change 5 day m.a.
|
-1.8
|
-3.8
|
-3.8
|
-4.4
|
-2.6
|
-0.1
|
0
|
|
Adv – Dec 3 day m.a.
|
+724
|
+752
|
+243
|
+33
|
-14
|
-300
|
0
|
|
Supply Demand 5 day m.a.
|
.40
|
.37
|
.54
|
.62
|
.55
|
.54
|
0
|
|
Trading Index (TRIN)
|
.74
|
.62
|
1.27
|
1.14
|
1.22
|
.69
|
0
|
|
S&P 500
|
2144
|
2141
|
2141
|
2151
|
2143
|
2139
|
Plurality +1
|
Indicator Parameters
Monetary conditions (+2 means the Fed is actively dropping rates; +1 means a bias toward easing. 0 means neutral, -1 means a bias toward tightening, -2 means actively raising rates). RSI (30 or below is oversold, 80 or above is overbought). McClellan Oscillator ( minus 100 is oversold. Plus 100 is overbought). Composite Gauge (5 or below is negative, 13 or above is positive). Composite Gauge five day m.a. (8.0 or below is overbought. 13.0 or above is oversold). CBOE Put Call Ratio ( .80 or below is a negative. 1.00 or above is a positive). Volatility Index, VIX (low teens bearish, high twenties bullish), VIX % single day change. + 5 or greater bullish. -5 or less, bearish. VIX % change 5 day m.a. +3.0 or above bullish, -3.0 or below, bearish. Advances minus declines three day m.a.( +500 is bearish. – 500 is bullish). Supply Demand 5 day m.a. (.45 or below is a positive. .80 or above is a negative). Trading Index (TRIN) 1.40 or above bullish. No level for bearish.
No guarantees are made. Traders can and do lose money. The publisher may take positions in recommended securities.

 BP and Royal Dutch Shell reported their latest financial figures for the third quarter and both companies showed some improvement, a sign that the oil markets are starting to find their footing.
 As warned
  Summary