


Oil stocks as represented by $OSX remains on a major sell signal, which is now two years old.
Crude oil remains on a short-term buy signal, but is due for a correction.

Ace Analyst Josef Schachter Sees Six Reasons For A Substantial Energy Decline:
During the recent robust move up in crude, the conventional wisdom and commentary in the media was that the crude price bottom was in place and that the price of crude would lift to US$70-$80 by late 2016. This euphoric phase lifted energy stocks to lofty heights, and in our opinion, excess valuation. Many stocks at the top last week were discounting $US70/b. The S&P/TSX Energy Index rose from 126 in mid-January to over 200 last week. It has now retreated and commenced another corrective phase as markets and investors overplayed the rise in crude and with the recent breakdown in crude prices have seen a start of a new down leg.
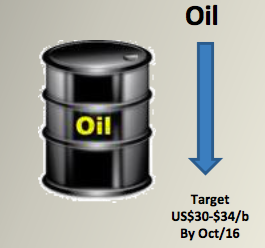 So why are we back in the bear camp? We see six issues that collectively will drive crude prices down to the low US$30’s over the next 4 months. The issues are highlighted below with further explanation of each issue.
...continue reading the entire 30 page report HERE

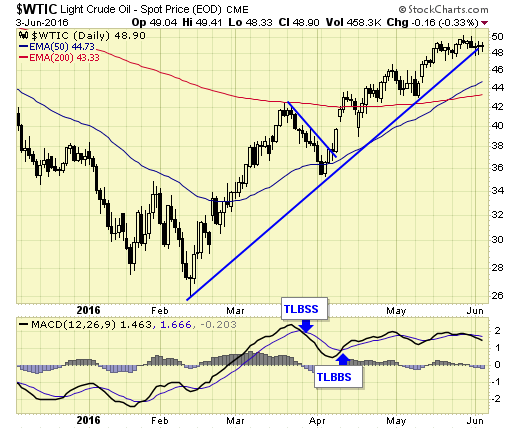
On Tuesday, crude oil lost 1.36% as rising uncertainty around Brexit weighed on investors’ sentiment (leaving the European Union by Britain could trigger a recession and slow demand for crude in Europe). In these circumstances, light crude declined under the short-term support line and approached the Jun lows. Will we see lower prices in the coming days?
Let’s examine charts below and find out what can we infer from them about future moves (charts courtesy of http://stockcharts.com).
On Monday, we wrote:
(…) the commodity increased slightly above the Oct high, but then moved lower and invalidated earlier breakout. This negative signal encouraged oil bears to act, which resulted in a drop under the barrier of $50. Additionally, the Stochastic Oscillator generated a sell signal, while the CCI is very close to doing the same, which suggests further deterioration in the coming week.
Looking at the above chart, we see that the situation developed in line with the above scenario and light crude extended losses.
What impact did this drop have on the very short-term chart? Let’s examine the daily chart and find out.
Quoting our Monday’s alert:
(…) crude oil extended losses, closing the day under the barrier of $50 and invalidating earlier breakout above it, which is a negative signal, which suggests a drop to the blue support line based on the late May and Jun lows. If it is broken, oil bears will test the green support zone created by the late-May and Jun lows (around $47.40-$47.75) in the coming day(s).
On the daily chart, we see that oil bears pushed the commodity lower as we had expected, which resulted in a drop to the green support zone. What’s next? Taking into account sell signals generated by the indicators, we think that light crude will move lower once again and test the late-May low of $47.40 or even the Apr high of $46.78 in the coming day(s). If the commodity closes the day under these supports, we’ll consider opening short positions.
Having said the above, let’s take a closer look at the gold-to-oil ratio and look for more clues about future moves.
On Monday, we wrote the following:
(…) the ratio invalidated earlier small breakdown under the lower border of the red declining wedge (seen on the daily chart), which resulted in further improvement and a breakout above the upper border of the formation, which is a very positive signal – especially when we factor in buy signals generated by all daily indicators.
As you see on the daily chart, the breakout above the upper border of the red declining wedge triggered further improvement, which suggests that we’ll see a test of the 50-day moving average in the coming day(s).
What does it mean for crude oil? As you see on the above charts, may times in the past higher values of the ratio have corresponded to lower prices of light crude. We have seen this strong negative correlation in the second half of Jun 2008, between Apr and Sep 2011 and also between Jul 2013 and Feb 2016 (we marked all these periods with green), which suggests that another move to the upside on the above chart will translate into lower values of crude oil in the coming days.
Summing up, crude oil extended losses and closed the day under the blue support line, which suggests a test of the late May low of $47.40 or even the Apr high of $46.78 in the coming day(s). If the commodity closes on of the following days under these supports, we’ll consider opening short positions.
Very short-term outlook: mixed with bearish bias
Short-term outlook: mixed with bearish bias
MT outlook: mixed
LT outlook: mixed
Trading position (short-term; our opinion): No positions are justified from the risk/reward perspective.
Oil Trading Alert originally published on June 15, 2016, 6:25 AM
related: Martin Armstrong had a different view on Oil several days ago: Oil Bursts Through Resistance – Next Stop $69-$70
 Crude oil prices are struggling as global markets get fearful about the future causing safe haven buying in Treasuries and the U.S. dollar. The massive comeback in crude oil is put on hold as traders fear everything from a Brexit vote to the Fed as well as dire predictions about the economy from none other than George Soros and “Bond King” Bill Gross.
Soros may be a diabolical genius. He spent huge money to put left leaning and socialist governments in place and then made huge bets against their economies as the leftist socialist policies inevitably fail. Then Soros made billions as he profits from the ruination. Genius! Soros kind of reminds me of the pale-faced and cloaked Emperor of the Galactic Empire as he bets big on and selling stocks.
Of course the gold bet, while pulling back on the weak dollar, was strong yesterday. Safe haven buying ahead of the Brexit vote and fear was a major factor. Still, as the Wall Street Journalpoints out, “Front-month Comex gold futures have been among the best-performing major asset classes in financial markets this year, up about 20% as of Thursday. But those gains have been dwarfed by the surge in many gold-related securities, the latest sign of the topsy-turvy trading across markets in 2016 that for now has transformed some of the least-beloved investments on Wall Street into top performers.”
Yet, it isn’t just Lord Darth Soros that is raising fears of doom and gloom, it is also Bill Gross. Gross, manager of the $1.4 billion Janus Global Unconstrained Bond Fund, said bonds were the “short of a lifetime” is now doubling down by saying that, $10 trillion of negative rate bonds is a supernova that will explode one day.
This could happen in a galaxy that is not that far, far away.
If these dire predictions of a global economic collapse do not come to fruition, then the oil supply demand story looks a lot tighter. Not only will these fears slow down global markets but fear may also slow more energy investment. So assuming that global stock markets can avoid a total meltdown, then today’s Baker Hughes rig count number will be a major factor for oil’s direction. (Ed Note: Rig count posted 40 minutes ago – US oil rig count rises for 2nd straight week, up 3 rigs to 328)
Last week Baker Hughes said that the U.S. crude oil rig count rose by nine to 325 rigs. That was the first time that the oil rig count rose in 11 weeks. Of course, while the jump was up 2.8% week-over-week, it is still down 49.4% from a year ago.
Yet, it was the natural gas rigs that should raise real concerns. Last week Baker Hughes’s reported that the U.S. natural gas rig count fell by five rigs to 82 rigs down 63.1 from a year ago. This drop in rig counts may be reflecting what could be a substantial drop in U.S. production as evidenced by yesterday’s shocking natural gas weekly supply report. The EIA reported that natural gas in storage rose 65 billion cubic feet for the week ended June 3. That was below the average rise of 80 billion cubic feet expected by analysts polled by S&P Global Platts. This fall is disturbing because it suggests that natural gas production is falling at a time when demand is expected to shatter records.
Andrew Weissman of EBW AnalyticsGroup is predicting that in four weeks from now, the year-over-year natural gas surplus will likely have fallen another 100 Bcf, demand will probably have increased by 4.5 Bcf/d and production could have easily posted a further 0.5-1.0 Bcf/d decline. He is warning that this is a “bullish concoction — combined with enduring high levels of coal displacement — that could result in injections falling to 20-30 Bcf or lower, exerting significant further upward pressure on NYMEX natural gas futures. For the remainder of the 2016 injection season, the year-over-year core natural gas supply/demand balance — even after adjusting for coal displacements – projected to tighten by 5.6 Bcf/d. He said that low natural gas prices have taken the legs out from under coal markets, with 2016 likely to post the largest annual production decline on record.”
In Illinois, a state that heavily relies on natural gas, will have to rely on it even further. Exelon Corporation — the nation’s largest nuclear power supplier — announced it would have to close two of the state’s best-performing plants. It has said that the Clinton Power Station will close next June and the Quad Cities Generating Station will close a year later. Despite their high scores, they have apparently lost $800 million over the past seven years according to Clean Technology. It is very possible that other plants will follow and that could raise demand even further in the coming years.
Futures and options trading involves substantial risk of loss and may not be suitable for everyone. The information presented by The PRICE Futures Group is from sources believed to be reliable and all information reported is subject to change without notice.
Phil Flynn is the Senior energy analyst at The PRICE Futures Group and a Fox Business Network contributor. He is one of the world’s leading market analysts, providing individual investors, professional traders, and institutions with up-to-the-minute investment and risk management insight into global petroleum, gasoline, and energy markets. His precise and timely forecasts have come to be in great demand by industry and media worldwide and his impressive career goes back almost three decades, gaining attention with his market calls and energetic personality as writer of The Energy Report.
Related: Martin Armstong’s latest on oil: Oil Bursts Through Resistance – Next Stop $69-$70
 Oil prices jumped to their highest level in eight months on Wednesday, rising for a third consecutive session on supply disruptions in Nigeria and strong Chinese demand data.
There was also a larger-than-expected drop in U.S. crude inventories on Tuesday, indicating an easing of the global supply glut. A weak dollar, which hit a five-week trough against a basket of currencies on Wednesday, also boosted prices.
Related: Martin Armstrong: Oil at a Critical Juncture – Martin notes that if Oil breaks above the $49 level look for a rally to the $69-$70 area.”
Technical analyst Jack Chan demonstrates the divergence between oil equity prices and the underlying commodity.
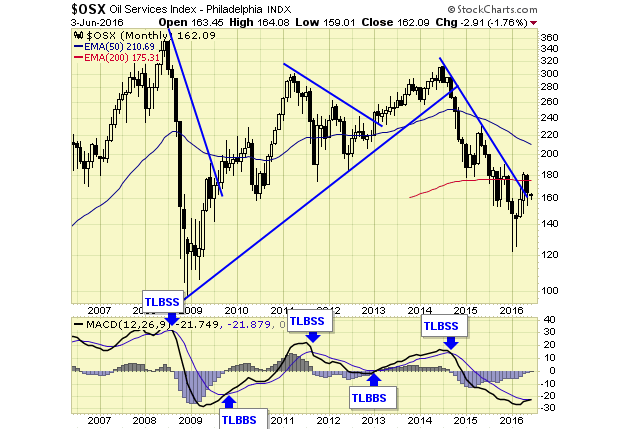
Oil stocks as represented by $OSX remains on a major sell signal, which is now two years old.
Crude oil remains on a short-term buy signal, but is due for a correction.
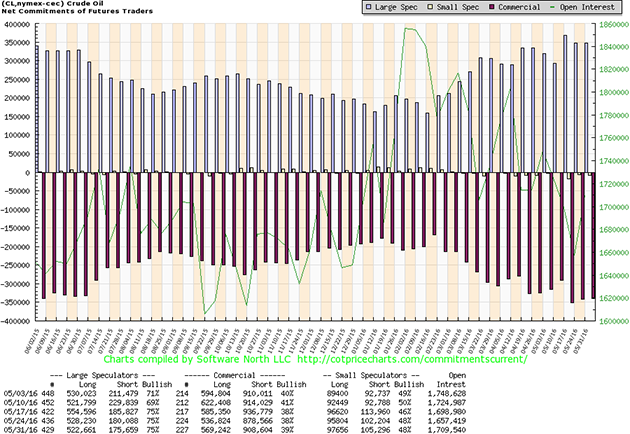
COT data indicates that speculation remains at levels of previous tops.
Summary
Oil and energy stocks have been correcting but oil prices remain firm, thus resulting in a divergence that has been in place for a few weeks now. According to current COT data, crude oil is due for a correction; caution is advised.
related: Martin Armstrong: Oil at a Critical Juncture
Jack Chan is the editor of Simply Profits at www.simplyprofits.org, established in 2006. Chan bought his first mining stock, Hoko Exploration, in 1979, and has been active in the markets for the past 37 years. Technical analysis has helped him filter out the noise and focus on the when, and leave the why to the fundamental analysts. His proprietary trading models have enabled him to identify the NASDAQ top in 2000, the new gold bull market in 2001, the stock market top in 2007, and the U.S. dollar bottom in 2011.

I know Mike is a very solid investor and respect his opinions very much. So if he says pay attention to this or that - I will.
~ Dale G.
I've started managing my own investments so view Michael's site as a one-stop shop from which to get information and perspectives.
~ Dave E.
Michael offers easy reading, honest, common sense information that anyone can use in a practical manner.
~ der_al.
A sane voice in a scrambled investment world.
~ Ed R.

Greg Weldon

Josef Schachter

Tyler Bollhorn

Ryan Irvine

Paul Beattie

Martin Straith

Patrick Ceresna

Mark Leibovit

James Thorne

Victor Adair