
Energy & Commodities
 Hangover of oil dependence has only just begun
Saudi Arabia’s oil-dependent economy is in a bit of a pickle. For its budget to break even, the country needs an oil price of $104 a barrel, claims the Institute of International Finance. The current price is around $45. According to the IMF, Saudi Arabia may run out of financial assets needed to support spending within five years. So severe is the problem that the House of Saud now has little choice but to do something it hasn’t had to do for decades: ration its spending.

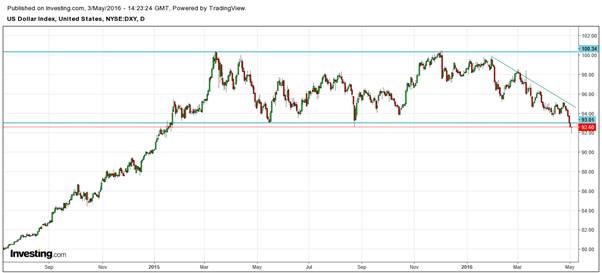
Traders who follow the price of gold and silver, should keep an eye out on the U.S. dollar index. The dollar has been within a trading range for more than a year. During December of 2015, the dollar rose to test the highs at 100, however, since February of 2016, the dollar has been in a downtrend, as shown in the chart below.
The FED has reduced the expectations of a rate hike in 2016 from one full percentage point, in the beginning of the year, to a half percent and perhaps to none at all. However, my expectation is that the FED may have to start rolling back this increase before the end of 2016.
The bullishness in the dollar was sparked by expectations of a change in the monetary policy of the FED. Market participants believed that the Zero Interest Rate Policy, NIRP, would end and that the rates were on an upward trajectory. However, world economic conditions have deteriorated since the beginning of 2016 and the ECB and BOJ both responded with Negative Interest Rates, NIRP and more QE. Consequently, the FED was forced to delay their rate hikes.
Last week’s shot term breakdown of the dollar, below the critical support of 93, was a bearish sign which can bring the dollar further down to the 86 levels. But the dollar posted a solid rally by the end of the week to regain that critical support level for the time being.
Although gold is a commodity, it is used as a hedge against ‘uncertainties’ and ‘crisis points’ which gives it a different edge. Gold, also behaves differently because of its’ usage as money, as ‘a store of value’, for many centuries for both individuals and countries.
Due to the ‘meaningless’ monetary policies of the various global Central Banks, gold will follow its’ unique behaviour. I have explained this earlier and my models have been very timely in forecasting the turning points.
Gold will have a one-way move higher with many corrective phases on its’ impulsive new uptrend, therefore, I always keep my subscribers immediately informed so as they know when to make the next profitable trades of both gold and silver. The next trade I feel is just around the corner.
Chris Vermeulen
related by Jack Crooks: Chart View: A look at some charts we follow which may be of interest…

In the previous week, crude oil moved higher once again and re-tested the strength of the key resistance zone. Despite this improvement, oil bulls didn’t manage to hold gained levels, which resulted in another invalidation of earlier breakouts. What happened at the same time with oil stocks? Will they follow crude oil’s moves in the coming weeks? Let’s jump right into charts (chart courtesy of http://stockcharts.com) and find out what can we infer from them.
Let’s start today’s article with the long-term chart of oil stocks.

Looking at the monthly chart, we see that oil bulls push the XOI higher in the previous month, which resulted in invalidation of the breakdown under the long-term black resistance line. This positive signal triggered further improvement and oil stocks increased slightly above the upper border of the blue declining trend channel. Despite this improvement, oil bulls didn’t manage to hold gained levels, which resulted in a decline under this important resistance line. Earlier this month, we saw similar price action, but the index dropped once again, invalidating earlier breakout. This is a bearish signal, which suggests further deterioration and (at least) a test of the previously-broken black long-term support/resistance line (currently around 1,070) in the coming weeks.
Finishing today’s commentary on the long-term picture, we would also like to draw your attention to the current position of the monthly indicators. As you see, we saw similar signals at the beginning of Feb 2015. Back then, they didn’t trigger significant upward move, which suggests that they are not reliable enough.
Are there any other factors that could encourage oil bears to act? Let’s examine the weekly chart and find out what can we infer from it.

From this perspective, we see that the recent upward move took oil stocks to the red resistance line based on the mid-Dec 2014 low (the bottom of the potential first wave). As you see the upward move since Jan was much bigger than correction between Dec 2014 and Apr 2015, which suggests that the index might create a wave 4 in a 5-waves downward trend (according to Elliot wave theory).
If this is the case, further declines in the coming weeks should not surprise us – especially when we factor in sell signals generated by the CCI and Stochastic Oscillator. Is it more reliable than monthly indicator? In our opinion, it is, because all sell signals generated since 2014 preceded sizable downward moves, which increases the probability that we’ll see similar price action later this month.
Will the very short-term picture confirm this scenario? Let’s check the daily chart.

On the very short-term chart, we see that oil stocks extended gains since our previous Oil Investment Update was posted and approached the resistance zone created by the late-Nov highs and the barrier of 1,200, which triggered a correction of the earlier upward move. With this decline, the XOI dropped under the medium-term green support line, which is a bearish signal that suggests further deterioration – especially if we see invalidation of the breakout above the 200-day moving average. Additionally, sell signals generated by the indicators are still in play, supporting oil bears and lower prices. If this is the case and oil stocks move lower once again, the initial downside target would be around 1,032-1,038, where the green support zone and the 50% Fibonacci retracement level (based on the Jan-Apr rally) are.
Summing up, the resistance zone created by the late-Nov highs and the barrier of 1,200 triggered a correction, which took oil stocks not only under the medium-term green support line (seen on the daily chart), but also below the upper border of the long-term declining trend channel marked on the long- and medium-term charts. In this way, the XOI invalidated earlier small breakouts, which is a bearish signal that suggests further deterioration in the coming weeks.
Ship tracking data from Bloomberg shows that 83 supertankers carrying around 166 million barrels of oil are headed to China, which has stockpiled an impressive 787,000 barrels a day in the first quarter of 2016 — the highest stockpiling rate since 2014.
While the world was speculating about oil prices plunging to $20 and $10 per barrel, China was busy stockpiling its reserves.
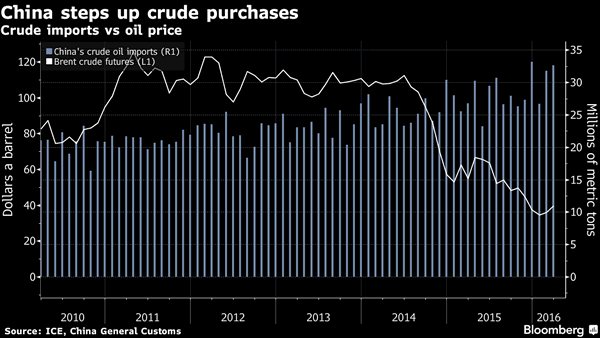
The chart below shows an increase in imports as crude prices collapsed. Since the beginning of this year, China has imported a record quantity of oil.
Back in January 2015, Reuters had reported that China planned to increase its strategic petroleum reserves (SPR) from 30 days to 90 days. In January 2016, it was revealed that China was building underground storage to complement its above-ground storage tanks.
The Chinese urgency points to two things. China believes that crude oil prices will not remain at the current levels for long, and that a disruption is possible due to geopolitical reasons, which can propel oil prices higher.
As a net importer of crude, it is protecting itself against a black swan event and using the current low prices to fill its tanks. The filled up tanks will ensure a steady supply of crude for at least three months in case of a disruption.
Does the record buying spree by the Chinese indicate a bottom in crude oil prices?
That is difficult to conclude, but it does put a floor beneath the current lows, because in all likelihood, China will resume its record buying and top up its SPR if prices tank.
The total Chinese imports in March via the very large crude carriers was 7.7 million barrels a day. Other than the supertankers, China also imports oil through pipelines and small tankers.
The Chinese demand doesn’t show a huge uptick corresponding to the rise in imports. JP Morganestimates that in March, the total demand for oil in China was 10.3 million b/d, down 2.5 percent over the previous year and down 2.3 percent month on month, whereas the chart shows that imports are higher compared to the same period last year.
Crude oil prices have been on an upswing this month. The import data coming out of China for April will give a clue as to whether the Chinese demand remains intact at higher crude prices or the imports drop when prices rise.
If the demand drops following a rise in prices, we can assume that China doesn’t believe that the price rally will be sustained. At lower levels, Chinese buying might become a factor in deciding the bottom, as their increased imports will reduce the glut.
Similar to Saudi Arabia, which is a swing producer, China is acting like a swing consumer. However, as China doesn’t report its storage data, it is difficult to estimate how long this trend will continue.
Though other factors were involved in encouraging the bulls to buy at lower levels, the increased demand from China also helped in lapping up the excess production. If their imports drop, the world will return to the supply glut and oil prices will retrace back to the lower $30 s/b.
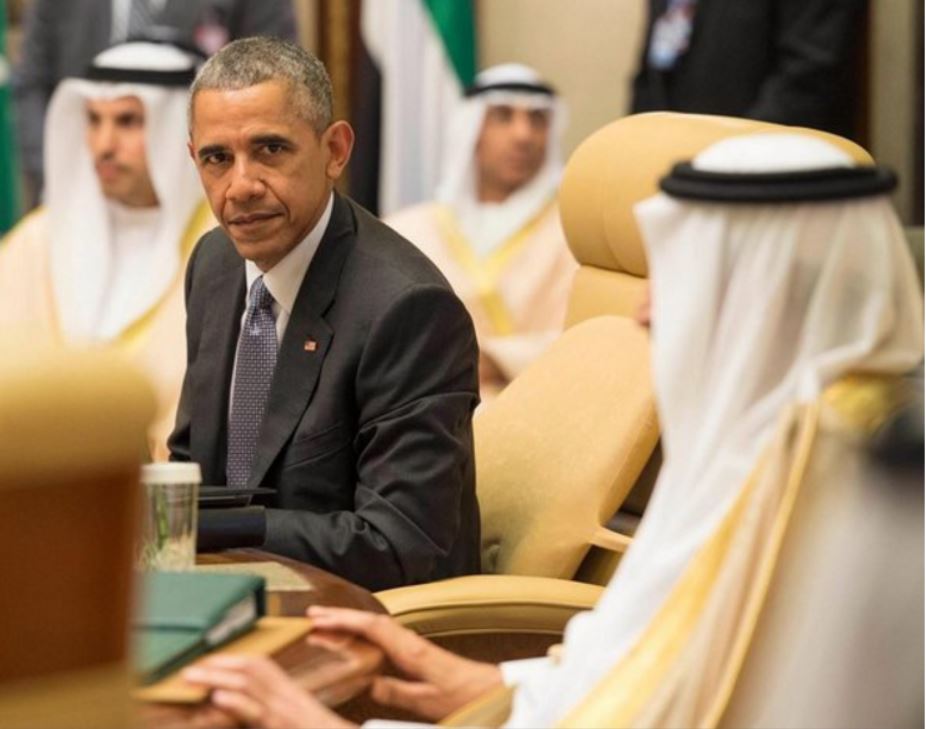
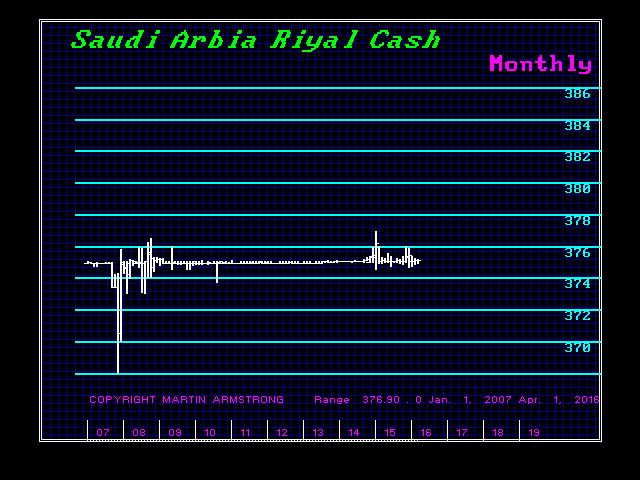
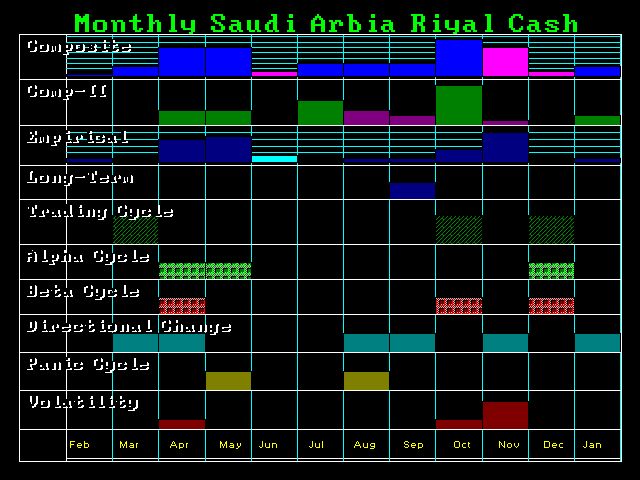
There is serious trouble brewing in Saudi Arabia. They have been dumping oil increasing their output by 3.5%. However, the cash is being kept offshore. Rumors have been flight that members of the Royal family may be creating a stash just in case there is major civil unrest which forces them to flee into exile. Obama on his recent trip told the Saudis they should adopt democratic reform. Make no mistake about it. There is trouble brewing in the Middle East. There is no way Obama would have made such a statement publicly if the situation were not grave.
May – August – October are being highlighted as key periods ahead.
related:
Joseph Schachter: Where Oil is Going Next

-
I know Mike is a very solid investor and respect his opinions very much. So if he says pay attention to this or that - I will.
~ Dale G.
-
I've started managing my own investments so view Michael's site as a one-stop shop from which to get information and perspectives.
~ Dave E.
-
Michael offers easy reading, honest, common sense information that anyone can use in a practical manner.
~ der_al.
-
A sane voice in a scrambled investment world.
~ Ed R.
Inside Edge Pro Contributors

Greg Weldon

Josef Schachter

Tyler Bollhorn

Ryan Irvine

Paul Beattie

Martin Straith

Patrick Ceresna

Mark Leibovit

James Thorne

Victor Adair