Energy & Commodities

Crude Oil Set For Big Rally

The oil price has had a nice rise in the past week so let’s see just what is going on using the weekly and daily charts.

Oil Weekly Chart

39411 a

We can see the 5 point broadening low in place. While we have nailed the last two lows I feel the longer term view may be a touch off. That revolves around price not trading below the 2009 low of $32.70. I am starting to have second thoughts about this. Why?

I was expecting a bigger rise to have already been witnessed by now. It hasn’t. I’m pretty finicky with how things look and this has caused me to review my longer term outlook.

While a new bull trend may well be already force, I am starting to lean towards this 5 point broadening low eventually morphing into an even more bullish 7 point broadening low.

The RSI shows a bullish divergence at the point 5 low and a point 7 low would likely set up a nice triple bullish divergence. That would indeed be a much more preferable picture to me eye.

There is another reason why I favour one final low after this rally but will leave that for the moment as it revolves around a pattern on the daily chart.

The MACD indicator is bullish indicating the likelihood of higher prices in the weeks ahead.

The PSAR indicator has a bullish bias with the dots underneath price.

The Bollinger Bands show price looks to be finding support at the middle band and I suspect a solid move higher is on the cards here.

I have drawn an Andrew’s Pitchfork which shows last week’s low right at support from the lower channel line. I am now looking for price to head up into the upper channel. From there the bull trend will gain momentum or a point 6 high will be put in place.

Now let’s zoom back in with the daily chart.

Oil Daily Chart

39411 b

The Stochastic and MACD indicators are both bullish.

The Bollinger Bands show price has bounced bullishly off the lower band and already has the upper band in its sights.

The recent low was right at support from the 61.8% Fibonacci retracement level and also the 50% Fibonacci Fan angle. Beautiful.

This low looks to be a point 4 low in a 5 point broadening top formation. This is the reason alluded to as to why I now think new lows below the 2009 low will eventually be seen. The expected point 5 high will also be the point 6 high of the 7 point broadening low formation. Patterns within patterns! Human behaviour repeats across all markets.

Also, this point 4 low is effectively a bullish double bottom with the point 2 low so some fireworks could be expected.

We can look at likely topping levels, if indeed that is what will play out, after this move has built up some steam.


About the The Voodo Analyst

Austin Galt is The Voodoo Analyst. I have studied charts for over 20 years and am currently a private trader. Several years ago I worked as a licensed advisor with a well known Australian stock broker. While there was an abundance of fundamental analysts, there seemed to be a dearth of technical analysts. My aim here is to provide my view of technical analysis that is both intriguing and misunderstood by many. I like to refer to it as the black magic of stock market analysis.

The One Essential to Transform Your Resources Portfolio

For investors willing to take a long-term view on their resource portfolios, this could be the best of times, says U.S. Global Investors CEO and Chief Investment Officer Frank Holmes. If you add patience to your portfolio management strategy, holding discounted oil and gas and metals mining stocks is one way to leverage the price equilibrium that will come when China’s growth hits the market. In this interview with The Energy Report, Fund Manager Brian Hicks shares the names of the juniors farther up the food chain that he is adding to the fund.

oil-rig-chart

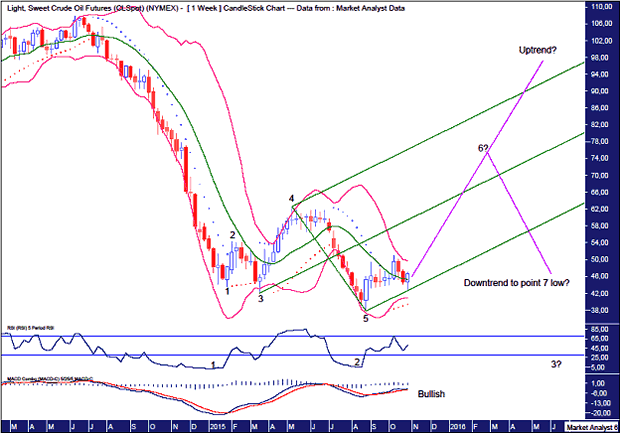
The Energy Report: Brian, in your last interview with The Energy Report in May, you were watching the price of West Texas Intermediate crude as compared to the average of the past six major bottoms. What is the chart telling you now? 

Brian Hicks: It appeared in April and May that we might see a recovery in crude oil prices. A lot of folks were excited about the rapid decline in the rig count. However, U.S. production remained quite resilient, trending north of 9 million barrels per day (9 MMbbl/d). That caught a lot of people by surprise—the fact that production had not rolled over—and led to a dip in crude oil prices over the summer; they dropped below $40 a barrel ($40/bbl) briefly.

“We feel like  BNK Petroleum Inc.is undervalued if you look at the reserves in the ground.”

Approaching the end of the year, we see some signs of production slowing. There is a lot of carnage in the energy patch

right now. A number of operators are going through their bank redeterminations, are seeing their credit lines cut and are no longer able to issue any high-yield debt, so that’s started to crimp drilling budgets. You are going to see even more of a drop-off in drilling activity, which could lay the groundwork for a strong rebound in 2016.


TER: What indicators do you watch to determine where the larger economy, and energy prices in particular, are going? 

Frank Holmes: I focus on the global Purchasing Managers Index (PMI), which is an alternative to gross domestic product and indicates commodity demand. And I am watching China. Second-tier city real estate is still going up, which bodes well for energy prices.

BH: We need emerging market currencies to stabilize. That would be supportive for crude oil demand. Encouragingly, we have seen some stabilization in the emerging market space recently. China is increasing stimulative economic packages that could help revive demand, both in China and around the world. 

TER: The last time we chatted, you were moving to mid- and larger-cap names, as you were seeing value in stocks that paid a dividend and offered low volatility. Is that still the direction you’re going?

BH: We have moved up the food chain. Given that companies are finding it very difficult to get access to capital and the cost of capital has gone up, we felt like it was better to invest in larger companies. We are gravitating toward companies with strong balance sheets that can continue to grow through the drill bit even in this low commodity price environment. That would imply that they have very high-quality, low-cost acreage. We feel like we’ve been able to identify some strong candidates in that regard. 

Royal Dutch Shell Plc has been able to grow the dividends, in some cases, at very high, double-digit rates over the last decade.

BNK Petroleum Inc. (BKX:TSX) is still a legacy holding. It’s obviously a long-term position with some of the projects it’s undertaken in Europe. Those will be slowed quite a bit given this price environment, but we like the acreage BNK has in Oklahoma, and the crude oil growth we’ve seen. We feel like the company is undervalued if you look at the reserves in the ground. At some point, that value will be realized.

TER: You also mentioned Royal Dutch Shell Plc’s (RDS.A:NYSE; RDS.B:NYSE) acquisition of BG Group Plc (BRGYY:OTCQX; BG:LSE) as one of the reasons you owned the stock. How has that worked out?

BH: Royal Dutch is moving into the execution phase on that deal. Shell will to have to bring the two companies together, optimize the organization, and look for synergies—areas where costs can be cut back. That will be a developing story. The high dividend yield is the biggest reason to own a company of Shell’s size. That is what makes them attractive. This company has been able to grow the dividends, in some cases, at very high, double-digit rates over the last decade. I think a lot of folks who require income look to those names.

TER: Let’s talk about some new names that are performing well in your portfolio. 

BH: In our exploration and production (E&P) portfolio, we’re focusing on companies that can continue to grow production and expand their reserve bases in this difficult environment. They have the balance sheets to withstand the downturn, and the acreage to continue to drill. Obviously, it’s not an optimal time to be ramping up. These companies are generally keeping drilling budgets within their cash flow. That is what we like to see.

The first company is Callon Petroleum (CPE:NYSE). It’s been around since the 1950s, but the company has shifted its focus over the last five or six years from the Gulf of Mexico back onshore and, specifically, to the Permian Basin in West Texas. 

“We are going to see even more of a drop-off in drilling activity, which could lay the groundwork for a strong rebound in 2016.”

The Permian has been a legacy oil producing basin for the U.S. for many decades. Horizontal drilling has completely revived the Permian Basin, enabling production to increase to 2 MMbbl/d in 2015, up from about 800 Mbbl/d in 2007. Some 180–200 rigs are still drilling; that’s down from about 550 rigs, but relative to the other shale plays, you’re seeing the most activity in the Permian right now because companies in the core of this area have been able to drill very prolific wells that offer high economic rates of return. 

Companies like Callon Petroleum can deliver positive returns at oil prices as low as $40–42/bbl. We estimate this company can generate internal rates of return of close to 28–30% at current strip prices. That’s very robust in this environment. You’re seeing a number of companies in the Permian continue to drill and maintain their activity levels, even though we’re in a depressed commodity environment. 

TER: Callon seems to have a lot of partnerships in place. How does that help investors manage risk? 

BH: The Permian Basin is such a vast area that joint ventures and farm-ins make sense given the large inventory of prospects to drill. Callon has a large acreage position—roughly 7,000 (7K) acres—in Midland County. It has another 10K or so in the southern portion of the play, in Upton and Reagan Counties. It has a tremendous amount of potential growth, a very long reserve life at the two rigs it’s using right now—approximately 17 years—and has already identified inventory of roughly 492 locations. For a company its size, Callon offers strong growth visibility. We see the company being able to increase production at well over double-digit rates over the next two to three years, and increasing its cash flow quite a bit. There is still a lot of potential on the drilling front, as the company continues to delineate its acreage position and optimize costs and drilling.

TER: What is another name in the Permian?

BH: We like Parsley Energy, Inc. (PE:NYSE), an emerging mid-cap E&P company based in Austin, Texas, just up the road from us in San Antonio. It is a focused pure play on the Permian Basin. Once again, Parsley fits within our overall theme of being able to grow the production base through the drill bit organically, and offer visible, debt-adjusted, per-share growth rates while maintaining a flexible balance sheet. 

Parsley has about 84K acres in the Midland Basin and another 30K acres in the Delaware Basin. The Midland has been drilled out the most and seems to offer higher economic rates of return, but the Delaware has been improving recently, and you’re starting to see some interesting zones being developed in that play that could offer significant upside for a company like Parsley. Drilling activities in some individual wells could offer a lot of upside from a net asset value (NAV) standpoint. This company has over 2K net locations—a very deep portfolio of drilling locations. The company also will be drilling within its cash flow. It has tremendous economics and can break even in some locations at around $37/bbl. 

Additionally, it’s the small- to mid-cap companies in the Permian Basin, like Parsley and Callon, that could be potential takeout candidates for a larger company because of this kind of inventory potential.

TER: How about one more?

BH: Moving away from the Permian, the next shale play in the U.S. that has garnered a lot of attention, and is starting to provide some very high rates of return and economics, is the Niobrara, located in Weld County in northeastern Colorado. A few companies there also look to be increasing production at double-digit rates. In addition, insider and employee ownership is approximately 10%, which is a big plus for us as it aligns management incentives with its shareholders. 

“We are watching China. Second-tier city real estate is still going up, which bodes well for energy prices.”

We like Synergy Resources Corp. (SYRG:NYSE.MKT), a small-cap pure play in the space. The company has been around since 2008 and has focused operations in that particular area. In around 2013, it began its horizontal drilling campaign. 

We feel like this is the best small-cap play for this particular shale development, again with the same themes—good balance sheet and strong visibility for production growth. There’s a lot of growth to be had given the company’s size. Some 40 MMbbl of reserves are booked at this moment, up 25% from last year. Production for Q4/15 is estimated to be around 11,000 barrels per day (11 Mbbl/d). That’s up 30% quarter-over-quarter and is a pretty big ramp-up in production for a company its size, representing a tremendous number of drilling locations. Synergy has well over 1K locations, many of which are in its core area, but it’s also developing other areas that look to have a lot of potential upside. The company currently has around 50K acres in the NE Wattenberg Extension that could really expand its drilling locations beyond the core Wattenberg area. The company is targeting the Greenhorn formation via the Conrad well test, in particular, which could be very accretive to its NAV if successful. Those results are not out yet, but we’re watching to see how that develops. 

TER: Synergy just purchased acreage in the Wattenberg Field, along with more acreage in the Niobrara, for about $78M. Could that make enough of a difference in production to move the share price?

BH: It is a nice tuck-in acquisition. I think it’s not so much about the production or the current reserves that the company is buying, but the potential of that resource base. Synergy bought the package from a private company and will apply its larger financial and operational resources to fully develop that play. 

We do feel like it is meaningful. That greater Wattenberg area offers a tremendous amount of potential going forward. It’s good that management is looking both at organic growth as well as M&A opportunities to build the portfolio. Synergy will be picking up an additional 4,300 net acres next to its current land position, and an incremental 1,200 barrels of oil equivalent per day production. The company has more cash than debt as of Q3/15, so the balance sheet is very strong. Roughly a third of its production is hedged this year at $70/bbl, so it’s very well insulated from these lower oil prices.

TER: You have also moved the portfolio into the base metal space. It looks like you have some copper and zinc. What is it about the fundamentals of these two metals that appeals to you?

BH: This is a long-term view. We still need to see some improvements in China’s overall economy, but in the long run, urbanization in that country will continue in order to balance the less urbanized west with the highly urbanized coastal or eastern regions. A lot of investment will go into fixed assets, and that bodes well for commodities, specifically for copper, zinc and iron ore to go into steel production. 

“We are gravitating toward companies with strong balance sheets that can continue to grow through the drill bit even in this low commodity price environment.”

Right now, those commodities are out of favor. However, when we looked at the equity values for those mining companies, we felt like we would be able to buy at bargain basement levels. These are patient, long-term companies bought at once-in-a-decade valuations. The supply and demand fundamentals for those commodities require prices to meet future demand. We feel very constructive right now about mining and energy shares and feel now is an attractive time to look at those names.

TER: What were the specifics of the two companies you added to the portfolio?

BH: Nevsun Resources Ltd. (NSU:TSX; NSU:NYSE.MKT) is a company with pristine financials, very high rates of return and a dividend yield north of 5%. It has done a good job transitioning from precious metals into copper, and in picking up production. It will be moving more into zinc over the next few years. 

Zinc should become quite attractive from a supply perspective. Upcoming mine closures should tighten up the fundamentals for that metal. We feel like Nevsun will be able to capitalize on that. It has begun exploration programs around its Bisha property. It looks like there are some encouraging signs that the company might be able to extend the reserve life of that project. That would help to increase Nevsun’s production visibility longer term. 

First Quantum Minerals Ltd. (FM:TSX; FQM:LSE) has some debt on the balance sheet and the market has punished the shares for its leverage during this downturn. The market has become very concerned about company debt levels and large capex projects, such as the Cobre Panama, which are going to require a large amount of money to develop. The new Franco-Nevada Corp. (FNV:TSX; FNV:NYSE) stream helped validate First Quantum and backstopped the recent share price decline. This coupled with the operational developments at Sentinel gave us confidence that there was enough financial stability to justify getting involved. Given our positive views on copper, we felt like it would be a good way to leverage the metal price.

TER: What words of wisdom do you have for investors looking to end 2015 with a strong resource portfolio?

BH: Patience is the key word. Equity values at current prices are not reflecting equilibrium economics for many of the commodities trading below marginal cost. You want to buy commodity stocks when they’re out of favor, because they are cyclical. If you look out 12, 18, 24 months from now, those equity values should reflect equilibrium commodity prices and move significantly higher from here. 

TER: Thank you for your time.

Brian Hicks joined U.S. Global Investors Inc. in 2004 as a co-manager of the company’s Global Resources Fund (PSPFX). He is responsible for portfolio allocation, stock selection and research coverage for the energy and basic materials sectors. Prior to joining U.S. Global Investors, Hicks was an associate oil and gas analyst for A.G. Edwards Inc. He also worked previously as an institutional equity/options trader and liaison to the foreign equity desk at Charles Schwab & Co., and at Invesco Funds Group, Inc. as an industry research and product development analyst. Hicks holds a master of science degree in finance and a bachelor’s degree in business administration from the University of Colorado.

Frank Holmes is CEO and chief investment officer at U.S. Global Investors Inc., which manages a diversified family of mutual funds and hedge funds specializing in natural resources, emerging markets and gold and precious metals. Holmes purchased a controlling interest in U.S. Global Investors in 1989 and became the firm’s chief investment officer in 1999. Under his guidance, the company’s funds have received numerous awards and honors including more than two dozen Lipper Fund Awards and certificates. In 2006, Holmes was selected mining fund manager of the year by the Mining Journal. He is also the co-author of “The Goldwatcher: Demystifying Gold Investing.” He is a member of the President’s Circle and on the investment committee of the International Crisis Group, which works to resolve global conflict, and is an adviser to the William J. Clinton Foundation on sustainable development in nations with resource-based economies. Holmes is a much sought-after keynote speaker at national and international investment conferences. He is also a regular commentator on the financial television networks CNBC, Bloomberg and Fox Business, and has been profiled by Fortune, Barron’s, The Financial Times and other publications.

DISCLOSURE: 

1) JT Long conducted this interview for Streetwise Reports LLC, publisher of The Gold Report, The Energy Report, The Life Sciences Report and The Mining Report, and provides services to Streetwise Reports as an employee. She owns, or her family owns, shares of the following companies mentioned in this interview: None.
2) The following companies mentioned in the interview are sponsors of Streetwise Reports: BNK Petroleum Inc., Royal Dutch Shell Plc. The companies mentioned in this interview were not involved in any aspect of the interview preparation or post-interview editing so the expert could speak independently about the sector. Streetwise Reports does not accept stock in exchange for its services.
3) Brian Hicks: I own, or my family owns, shares of the following companies mentioned in this interview: None outside the portfolio. I personally am, or my family is, paid by the following companies mentioned in this interview: None. My company has a financial relationship with the following companies mentioned in this interview: None. I was not paid by Streetwise Reports for participating in this interview. As of the date of the interview, U.S. Global Investors holds the following companies mentioned in the interview: BNK Petroleum Inc., Callon Petroleum, First Quantum Minerals Ltd., Franco-Nevada Corp., Parsley Energy Inc. and Synergy Resources Corp. Comments and opinions expressed are my own comments and opinions. I determined and had final say over which companies would be included in the interview based on my research, understanding of the sector and interview theme. I had the opportunity to review the interview for accuracy as of the date of the interview and am responsible for the content of the interview. 
4) Interviews are edited for clarity. Streetwise Reports does not make editorial comments or change experts’ statements without their consent. 
5) The interview does not constitute investment advice. Each reader is encouraged to consult with his or her individual financial professional and any action a reader takes as a result of information presented here is his or her own responsibility. By opening this page, each reader accepts and agrees to Streetwise Reports’ terms of use and full legal disclaimer.
6) From time to time, Streetwise Reports LLC and its directors, officers, employees or members of their families, as well as persons interviewed for articles and interviews on the site, may have a long or short position in securities mentioned. Directors, officers, employees or members of their families are prohibited from making purchases and/or sales of those securities in the open market or otherwise during the up-to-four-week interval from the time of the interview until after it publishes.


Copper Wired For Higher Prices

As a general rule, the most successful man in life is the man who has the best information

My article titled ‘Give It A Doubt‘ was about population growth, urbanization in developing countries and the one billion people predicted to join the consuming classes by 2025.

“One billion people will enter the global consuming class by 2025. They will have incomes high enough to classify them as significant consumers of goods and services…”McKinsey Global Institute, Urban world: Cities and the rise of the consuming class

Some of these new consumers are going to be Americans but the majority are in developing countries, they might not want to be Americans but they do want at least a modest piece of what we’ll call the American lifestyle, the cell phones, flat screen TV’s, a nicer apartment, a car or maybe a motorcycle, washer/dryer, a fridge, AC – the amenities of a modern society and all the necessary infrastructure that goes with a well functioning competitive modern economy.

But what if all these new one billion consumers were to start consuming, over the next 12 years, just like an American? What’s going to happen to the world’s mineral resources if one billion more ‘Americans’ are added to the consuming class?

Let’s look at copper – here’s how much copper each of them would need to consume, per year, to live the American lifestyle…

Per capita consumption of copper in the United States was 10 kilograms per person 1965, the same in 1995. In Japan per capita consumption increased from 6 kilograms per person to 11 kilograms per person over the same time period. Copper consumption in Korea in 1965 was less than 1000 tons. By 1995, Korea’s consumption of copper had reached 637,000 tons, or more than 14 kilograms per person.

39369 aIn China, even after years of economic growth, per capita copper usage is about 5.4 kg. As China’s populace urbanizes, builds up its infrastructure and becomes more of a consuming society, there’s no reason to suspect Chinese copper consumption won’t approach or even surpass U.S., Japanese and South Korean levels. There’s 1.3 billion people in China, several billion more in developing countries – India, with its 1.2 billion people, is presently using 0.5 kg of copper per person. Africa, the fastest growing continent, has virtually no copper consumption per capita.

One billion new consumers by 2025. Can everyone who wants to live an American lifestyle? Can everyone everywhere have everything we in the developed parts of our world have?

“Concern about the extent of mineral resources arises when the stock of metal needed to provide the services enjoyed by the highly developed nations is compared with that needed to provide comparable services with existing technology to a large part of the world’s population. Our stock data demonstrate that current technologies would require the entire copper and zinc ore resource in the lithosphere and perhaps that of platinum as well. Even a lower level of services could not be sustained worldwide because a continuing supply of

new metal is needed to make up for inevitable losses in the recycling of the metal stock-in-use.

Substitution has the potential to ameliorate this situation, but one should not automatically assume that technology will produce a satisfactory substitute for every service at an affordable price and precisely when needed.

…anthropogenic and lithospheric stocks of at least some metals are becoming equivalent in magnitude, that world-wide demand continues to increase, and that the virgin stocks of several metals appear inadequate to sustain the modern ”developed world” quality of life for all Earth’s peoples under contemporary technology…Do we really envision a developed world quality of life for all of the people of the planet…?” R. B. Gordon, M. Bertram, and T. E. Graedel, Metal Stocks and Sustainability

According to the International Monetary Fund (IMF) the consumption of metals typically grows together with income until real GDP per capita reaches about $15,000-$20,000 per capita (2005 international $) as countries go through a period of industrialization and infrastructure construction.

39369 b

Countries by 2012 GDP (PPP) per capita, based on World Bank figures and current Int$

A few countries stand out as well below the IMF’s $15,000.00: 

  • China – $9,233
  • Indonesia – $4,956
  • Philippines – $4,410
  • India – $3,876
  • Pakistan – $2,891

Since they are still a considerable distance from the point where further increases in GDP per capita no longer increase copper consumption per person, China, Indonesia, the Philippines, India and Pakistan (and the other 113 out of 180 countries listed below the IMF’s 15,000 Int$ cutoff) are likely to continue to add significantly to global demand for copper for some time to come.

Capex/opex costs escalating

Mining is getting more difficult. The low hanging fruit has been found and put into production long ago. And these deposits are showing their age, here’s an example…

BHP Billiton just announced (Oct. 20th 2015) copper output dropped 3% yoy and 13% compared to last quarter because of declining grades at Escondida, the world’s largest copper mine. The company also said that despite plans to spend billions of dollars on operational improvements, including a $3.4 billion water project, the anticipated 27% decline in grade would be only partially offset.

Mining is an extremely capital intensive business for two reasons. Firstly mining has a large, up front layout of construction capital called Capex – the costs associated with the development and construction of open-pit and underground mines. There are often other company built infrastructure assets like roads, railways, bridges, power generating stations and seaports to facilitate extraction and shipping of ore and concentrate.

Capex costs are escalating because:

  • Declining ore grades means a much larger relative scale of required mining and milling operations. As a rule grades are higher at current mining operations than at development stage projects – so costs are going to be higher to remove/process the same amount of ore.

  • A growing proportion of mining projects are in remote areas of developing economies where there’s little to no existing infrastructure. 

There is also continuously rising Opex, or operational expenditures, to consider. These are the day to day costs of operation; rubber tires, wages, fuel, camp costs for employees etc.

“A typical mining contract no longer specifies just rents and royalties, payable to the state. It specifies exactly what the mining firm will build — a power plant, a water-supply system, a communications network — and how these things will be shared with the public.” The New Bronze Age, Tim Heffernan

The bottom line? It is becoming increasingly expensive to bring new mines on line and run them.

Disruption allowance

Copper mining is notorious for disruptions and analysts use a “disruption allowance” – 800,000 to 1,000,000 tonnes per annum.

According to ICBC Standard Bank, 2015 has seen a record 1.33m tonnes of mine disruptions and that does not include the latest power shortages (forcing production cutbacks) in Zambia.

Reasons for disruption in mining are numerous:

  • Weather/Natural Disasters – Rain caused flooding or the opposite, drought causing water shortages, hurricanes, earthquakes (recent 8.3 magnitude earthquake in Chile).

  • Technical problems – Commissioning delays, slower ramp-ups, 45% of supply growth is coming from greenfields projects.

  • Power shortages – Chile, Zambia.

  • Labor activity – Contract revisions, mine, rail and port strikes, environmental protests. Over 15% of production had labor contracts up for renewal in 2015. Workers at some of the world’s largest mines – Freeport McMoRan’s Grasberg in Indonesia and BHP Billiton/Glencore’s Antamina in Peru – were to renegotiate contracts in 2015. Bloomberg, in April, reported almost a 10th of global copper output was at risk of being lost due to labor disruptions in 2015 affecting 1.5 million metric tonnes or 8.2% of annual production.

  • Older mines reaching end of mine-life – Falling grades, dirty concentrates (laced with arsenic).

  • Declining price environment – Project deferrals, mothballing and downsizing of mine plans.

  • Resource Nationalism – Resource nationalism is the tendency of people and governments to assert control, for strategic and economic reasons, over natural resources located on their territory ie. Indonesian ban on unrefined ore exports. 

All these reasons are combining to tighten metal supply, push many markets into future deficits and are laying the groundwork for price gains.

Supply-side disruptions

There have been supply-side disruptions, including periods of drought followed by incessant rains and floods in Chile the world’s largest copper miner. The Chilean copper association has reduced its production targets for 2015 as a result of weather disruptions.

Grades are expected to fall at Escondida (the world’s largest copper mine) as well as the Collahuasi JV between Anglo and Glencore.

Chilean state copper company Codelco is running into serious problems in maintaining production, let alone increasing it. Aging mines, high capex requirements and a $21 billion funding shortfall by the Chilean government to fund Codelco’s production plans is leaving Codelco wondering how to keep production flowing.

There have also been mining operation disruptions in Indonesia. The country imposed a ban on exports of unprocessed ores negatively impacting copper exports. Workers also blockaded PT Freeport’s Grasberg Mine in Indonesia.

Clashes between police and protesters left four people dead at MMG’s Las Bambas mine in Peru. Opposition from rural communities to mining in Peru (world’s third largest copper producer) is very strong.

In Zambia, Canadian miner First Quantum said power restrictions are likely to hit copper supplies. In September 2015, Glencore announced its idling mines in Zambia and the Democratic Republic of Congo (DRC).In a bid to cut costs, Glencore will reduce output by 400,000t at its African copper mines over the next 18 months removing 1-2% of copper supply from the market.

A copper mine in Papua New Guinea is stopping production due to dry weather.

Freeport-McMoRan announced announced in August it is cutting output at its El Abra mine in Chile in half and idling two US mines. Freeport also has predicted lower output at its massive Grasberg mine in Indonesia related to El Nin?o weather patterns.

Anglo American’s Los Bronces mine in central Chile, the world’s sixth-largest copper producer, is being affected by water scarcity. Anglo warned in February that the drought Chile was suffering could drop production by 4% off the company’s total production for the year.

Cochilco, Chile’s copper commission, states water scarcity is “a latent risk for mining in Chile”.

“Lower rainfall and river flow has led the levels of aquifers and reservoirs to drop or dry up completely, giving miners fewer options. In Chile, the situation is complicated by the fact that many of its copper mines are located in the Atacama, the world’s driest desert.

Output at BHP Billiton’s Escondida, the world’s largest copper mine, in the bone-dry Atacama, fell 2 percent in the second half of 2014, weighing on a strong operating performance.” Drought in Chile curbs copper production, to trim global surplus, Reuters

Chile produces a third of the world’s copper and has seen a seven fold increase in energy costs over the last ten years, also because of a severe water shortage in the high desert, where most of the country’s major copper mines are located, water must be pumped from the ocean to almost 800 meters above sea level and then pumped hundreds of kilometers to the mines, of course the seawater must also be desalinated.

Capital Economics’ senior commodities economist Caroline Bain has numerous concerns regarding the copper market;

“Persistent strike action at Latin American copper mines as well as planned closures…El Niño’s potential impact on supply…the weather phenomenon may lead to another bout of floods at mines in Latin America – heavy rains and flash floods in Chile forced several copper mines to suspend operations in March this year – and unusually dry weather in Indonesia.”

Capital Economics also says:

  • Exports from Indonesia’s Grasberg copper mine will be affected by a “lack of water in rivers to transport the metal to the port”.
  • Electricity shortages in Zambia are also expected to weigh on supply. As water levels at its hydropower dams dried up after a drought last month, the country’s power providers announced a 30% reduction in supply to mines.

A long term structural trend in the copper mining business started to become evident two decades ago. Shortfalls in targeted production are now characterized by a fall in grades and recoveries as well as unexpected disruptions.

39369 c

Brook Hunt

“Since 2000, average head grades for copper, without adjusting for production weightings, declined from 1.3% to 1.1% in 2012. Furthermore, the weighted average head grade for mined copper is likely less than 1% as several of the world’s largest copper mines have been in production for many decades and are now mining extremely low grade ore (less than or equal to 0.5% Cu). As head grades decline, costs rise for a given tonnage.” ~ Kitco.com, Multi-Year Global Copper Market Outlook

A Yale University study said new discoveries of copper have raised global reserves by just 0.63 percent per year since 1925 but usage has risen at 3.3 percent per year.

“Copper does not often appear in a pure form in nature, the way gold forms nuggets. Instead, it combines with other elements to form stony minerals, of which the copper makes up only a small part. Fifty years ago, ore from the average pit mine was 1.5 percent copper. Most of that rich ore is gone: The average today is 0.6 percent. For every ton of copper extracted, nearly 167 tons of ore is processed and nearly 167 tons of tailings produced.” The New Bronze Age, Tim Heffernan

Country Risk

Resource extraction companies, because the number of discoveries was falling and existing deposits were being quickly depleted, have had to diversify away from the traditional geo-politically safe producing countries.

“For many developed nations within the Organization for Economic Co-operation and Development (OECD), developing significant new (Greenfield) copper mining projects has become a serious challenge as stricter regulations, environmental concerns, and an inability to accurately predict capital expenditures (Capex) prohibitively increase project costs without removing the risk of significant political opposition…” Kitco

39369 d

“National governments are no longer the only, or even in many cases the primary, source of political risk in mining projects. Political risk can stem from local governments, international and local NGOs, community groups, local competitors or any other group advancing political objectives. Similarly, the types of issues that mining companies have to deal with are quite varied. These range from having to deal with things like corruption, NGO scrutiny, maintaining a social license to operate, a lack of clarity over the implementation of mining legislation through to poor infrastructure and HIV/AIDS.”~ Ben Cattaneo, Managing political risk in mining

The move out of “safe haven” countries has exposed investors to a lot of additional risk.

Demand and supply growth

39369 e

Global copper demand and supply growth rates from 2007 to 2015 ststista.com

39369 f

Global copper consumption from 2010 to 2016 (in 1,000 metric tons) statista.com

39369 g

39369 h

Escondida produced over 1.1 million tonnes of copper in 2014. Yet the above chart, from Melbourne-based and Hong Kong-listed MMG, shows an expected production drop from Escondida to 800,000 tonnes in 2017. The expected production shortfall from Grasberg, in Indonesia, is equaling frightening.

“Peru has been the favoured destination for copper investment in recent years.

New mines coming on stream in the country in the following months and 2016 will double production to 2.8 million tonnes, placing the country in second place globally behind Chile.

According to data from the Peruvian Institute of Economics, however, social conflicts and red tape are making that goal difficult, as they have already caused the delay of $21.5 billion worth of mining projects in recent years.

Meanwhile the Apurimac region, near the Las Bambas Project, continues to be under martial law following last months unrest (four dead and 16 seriously injured – Rick). During such period, civil liberties including freedom of association and movement are restricted, while police are allowed to enter houses without search warrants.” MMG’s gigantic Las Bambas mine in Peru to open next year despite protests, Mining.com

Of the largest 28 copper mines in the world, 21 are not expandable.

Going Solar

“China’s installed solar energy capacity is set to soar to 200 gigawatts (GW) by 2020 from around 36 GW in 2015, according to projections from China’s Renewable Energy Industry Association. Minerals consultancy CRU estimates 6,000 tonnes of copper is used per GW of capacity.

Wind power is projected to reach 250 GW by 2020, according to industry estimates. About 3,850 tonnes of copper is used per GW of wind capacity, according to an average of industry estimates compiled by Reuters.

These, alongside a steady increase in demand from China’s electric vehicle sector of around 200,000 tonnes over the next five years, account for more than 2 million tonnes of copper, compared with current forecasts on total copper consumption over the period of about 105 million tonnes.” China push into solar, wind power to heat up global copper markets, Melanie Burton Reuters

The U.S. Energy Information Administration (EIA) says; “Future demand for solar photovoltaics will be affected by major countries’ goals for installed solar capacity. More than 50 countries have established national solar targets, amounting to more than 350GW by the year 2020. The current top six countries in terms of total installed solar capacity – Germany, Italy, Japan, Spain, France, and China – represented 76 per cent of installed capacity in 2012, but only 61 per cent of the global target total for 2020. Reaching 350GW by 2020 would require average annual installments of 40GW from 2013 through 2020, which is equivalent to manufacturing production in 2013 and well within current PV manufacturing capability of 60GW per year.”

Minerals consultancy CRU estimates 6,000 tonnes of copper is used per GW of installed solar energy capacity. 350 GW by 2020 use is – just for solar, not wind, not electric cars – 2.1 mil lbs of copper. That’s the entire annual 2014 production of two Escondida’s.

A study by Wood Mackenzie found that there will be a 10 million tonne supply deficit by 2028. That’s equal to the annual production of the world’s biggest copper mine multiplied by 12.50 at MMG’s forecast 2017 production figures for Escondida.

The world’s copper miners are cutting back production and massively curtailing exploration/development…

Houston we have a problem…

39369 i

Visualcapitalist.com

39369 j

Visualcapitalist.com

“In terms of copper the current weak copper price is largely because there has been something of a hiatus in Chinese copper purchases in line with something of a downturn in the Chinese economic growth. Note this is not a recession in the economy, but a downturn in the levels of growth seen in the recent past. The Chinese economy still seems to be growing, but at a slower rate (6.9% economic growth as of Oct 1st 2015 versus historic 9% – Rick). The analyst bandwagon has seized on the slowdown as showing that the supercycle, primarily generated by Chinese demand for industrial metals of all kinds, has thus ended. The copper article stems from analysis by senior Bernstein analyst, Paul Gait, that in fact the Chinese generated supercycle is only around one-third into its course and the Asian dragon still has a huge amount of ground to make up on all other industrialised nations in terms of per capita metal consumption (and then comes India and Africa – Rick).

In turn the recent slowdown in Chinese economic growth has seen metal prices fall to production costs only now being just about covered by income from sales, whereas traditionally the copper mining sector operates on the basis of a 50% premium of sales to costs. As a consequence the big copper miners are cutting back heavily on costs, leading to a drastic fall in exploration expenditures, curtailment and cancellation of big new capital projects and expansions and some closures of now uneconomic existing mining operations to satisfy shareholder and institutional demands for profit maintenance, or at least recovery.

But, at the same time many of the major producing mines are seeing mill head grades running substantially above reserve grades which can only lead to declining output, without major plant expansions to counterbalance the trend. And finance for such major expansions is becoming more and more difficult to come by. With exploration curtailed, and nowadays huge lead times in taking a major new mine from discovery to production (figures of 30 years are being quoted) the world is facing a major copper shortage in the years ahead.” Copper and gold – parallels in massive supply deficit scenarios, Lawrie Williams, lawrieongold.com

Consider the following facts: 

  • The low-hanging mineral fruit has been picked
  • Metallurgy is becoming more complicated
  • We are using more and more energy to achieve the same amount of production. When does one unit of cost in, not give you the two out you need?
  • There is no substitute for many metals except other metals – plastic piping is one exception
  • There hasn’t been a new technology shift in mining for decades – heap leach and open pit mining come to mind but they are both decades old innovations
  • Increasingly we will see falling average grades being mined, mines becoming deeper, more remote and come with increased political risk
  • Labor shortages loom, baby boomers are starting to retire en masse, and the resource-orientated talent pool is thinning out
  • We’re rushing headlong into shortages of resources and the conflicts generated from a lack of security of supply 

Mine production of many metals shows us a number of similarities: 

  • Slowing production and dwindling reserves at many of the world’s largest mines
  • The pace of new elephant-sized discoveries has decreased in the mining industry
  • All the oz’s or pounds are never recovered from a mine – they simply becomes too expensive to recover

Conclusion

The world’s urban population is expected to nearly double in the next 30 years. Globally infrastructure is in need of major rebuilds measured in the trillions of dollars worth of capital investment. Consider electrification of the global transportation system, the growing move to solar and wind, that’s millions of tonnes of additional copper use. Throw in aging mines, resource nationalism and exploration cutbacks.

The market is not factoring in basic supply and demand elements. Copper has been oversold, the market is already very tight and we are entering into an era of copper supply deficits meaning there is no long term justification for low prices.

In a report published in early October 2015, the International Copper Study Group (ICSG) changed their April 2015 mindset. They are now saying that there will be a 130,000 mt copper supply deficit in 2016 instead of the previously forecast 230,000 mt surplus.

The ICSG also reduced its 2015 estimated 360,000 mt surplus to just 41,000 mt.

Let’s leave the last word to Commerzbank, who, in a note to their clients said; “The appraisal of the ICSG would justify significantly higher copper prices.” Indeed.

Is the supply, and price, of copper and a couple of copper focused junior resource companies, on your radar screen?

If not, they all should be.

http://www.aheadoftheherd.com

Reshuffling the Deck in the Mideast

The U.S. presence in the Middle East, which for years provided some control over one of the world’s most volatile regions, appears to have dissolved into chaos. By removing Saddam Hussein from power, the U.S. removed his tyrannical but stabilizing hand from the powder keg that always existed in the poorly designed nation state of Iraq. Rather than attempting to repair the damage, President Obama appears intent on leaving what he terms “a quagmire.” Predictably, chaos has emerged, not just in Iraq, but in Syria as well. The rapidly changing political landscape is pushing major regional players like Turkey, Egypt and Saudi Arabia to drastically reshuffle their assumptions and allegiances.
 
sdfsd
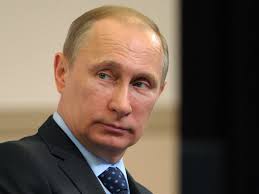
It is said that nature abhors a vacuum and that history is broadly the history of leaders. The vacuum that is the Middle East is now drawing in Vladimir Putin, one of the boldest characters on the world stage. By drastically raising its military presence in the region, Russia is taking advantage of political confusion and paralysis in the West to create a Middle East that may be more supportive of her interests. While the focus now is on Syria, highlighted by the surprise visit of Bashir al Assad to Moscow, the real target of Russia’s gambit may be Saudi Arabia, which is now incurring massive military expenditures as a result of fighting in Yemen and by proxy in Syria. Like Russia, Saudi Arabia is being hurt by low oil prices. Given both country’s dependency on the price of crude oil, they may have more in common than many may expect.
Russia’s finances have recently been devastated by the drop in crude prices and by the U.S.-led NATO sanctions imposed for the Ukraine incursion.. To maintain its viability, Russia must seek to push up the price of oil by any means at her disposal. Coordinated production agreements between Russia and Saudi Arabia could offer Russia that possibility. However, this would not be in America’s interest. Rising oil prices would add to inflation pressures and put more pressure on the Fed to raise rates. This is an outcome which should be raising eyebrows around the world, but sadly no one seems to be considering the possibility.
 
As a high cost producer, Russia can’t survive in a long term low price environment. Traditionally, Saudi Arabia has agreed to align its own oil production policies to the broad strategic interests of the United States in exchange for U.S. protection against its regional rivals, in particular the Shiite state of Iran. But the Obama administration’s recent courtship of Iran (through its nuclear treaty), its failure to support allies in Egypt, and its hesitancy to follow through with threats against Syria, might be encouraging the Kingdom to seek newer, more reliable allies.
 
Still a military superpower, Russia appears set, under President Putin, to challenge the U.S. as part of a strategy to restore its position as a major global player. Given America’s vastly superior financial muscle, the contest is only possible given Putin’s greater mastery of power politics and the realities of global statecraft. Obama’s foreign policies reveal a strong leftist leaning, a stunning lack of military understanding, and a naïve belief in the benign power of organized democracy.
 
Putin could scarcely be more different. Rather than organizing community activists in Chicago, Putin cut his teeth as head of the KGB in former East Germany. Subsequently, his political rise was fast, illustrating a clear ability to work within power politics. As opposed to Obama’s discomfort with America’s military history, Putin is a patriotic Russian who was mortified to witness the fall of the Soviet Union. He has proven to be a very calculating opportunist bent on restoring Russia’s sphere of influence in the Crimea, the Ukraine and now the Middle East. Putin has shown that he is not afraid to stand up to the United States and its allies. This has increased his domestic support and international standing.
 
To support its ally in Syria, Russia is now deploying ground troops, including tanks and heavy artillery. Clearly, Putin is thinking in regional terms. With an airbase in Syria, his fighter-bombers can project power into and throughout the region, an opportunity that it has not enjoyed for decades. Thus far Russian forces have not been used to destroy ISIS, as the U.S. would have hoped, but to directly support the Assad regime. Sometimes this means the Russians are going after factions directly supported by the U.S., setting up a dangerous proxy war between the superpowers.
 
As part of his efforts to move closer to Iran, Obama appears to have put aside old, well-established relationships with Israel and Saudi Arabia. This has caused resentment and a feeling that the U.S. can no longer be trusted as a reliable ally.
 
According to an article in Brookings, Saudi Crown Prince and Defense Minister, Prince Mohammed bin Salman visited President Putin in St. Petersburg in June 2015. The most trusted son of the Saudi King, Prince Mohammed was accompanied by the Saudi Foreign Minister, Adel Al Jubeir. Perhaps most interestingly, the delegation included the Saudi Minister of Petroleum, Ali Al Naimi, together with some senior military and intelligence officials. Apparently the meetings went well, with reciprocal State Visit invitations offered by both parties. Reuters reported that, on October 3, 2015, Russian Energy Minister Alexander Novak said in referring to the possibility of Russia’s preparedness to meet with OPEC and non-OPEC oil producers that, “If such consultations are to happen we are ready to take part.”
 
Low oil prices have kept inflation down, allowing the Fed to continue stalling on a normalization of U.S. interest rates. A rise in oil prices likely would result in increased inflation. This would remove a crucial public excuse, enabling the Fed to justify zero interest rates.
 
In this column we have argued for many months, even years, that the Fed will not normalize interest rates, other than a possible token 0.25 or even 0.125 percent, until forced to do so by market forces. A higher oil price leading to inflation may provide such pressure if not to the Fed directly, then to international bond markets. A market-triggered interest rate increase likely would do damage to the credibility of the Fed, the international monetary system and to the current prices of financial assets standing at inflated prices, including bonds, equities and, over the short-term, real estate.
 
As a result, the chess match now unfolding in the Middle East, may not be as insulated from the American economy as Wall Street would like the investing public to believe. If Saudi Arabia drifts out of America’s orbit, our ability to avoid financial collapse will be that much more difficult.

Jim Rogers: The Best Opportunities are in Agriculture

UnknownCommodity Prices to go Higher if a War Breaks out in The Middle East – I own more Gold than I do Dollars

“I will tell you, the whole Middle East situation is unbelievable. I cannot think of many times in history where you have so much just pure, pure chaos by so many people. I mean, it’s not as though there are one or two people making mistakes in the Middle East, there must be a dozen people making mistakes in the Middle East, and unfortunately, they are coming together more and more.

I’ve got to sit down and figure out how this is going to end, because it looks like it could end in a very, very bad way for all of us. Wars start when bureaucrats make mistakes and then other bureaucrats react to those mistakes and then next thing you know, you have eight or ten bureaucrats sending 18 year old kids to kill each other, and it’s very worrisome what’s happening”

“War is not good for anything, anything at all, except commodities. I’m not going to say buy commodities because you don’t want to start a war, but if there’s going to be a war, it usually means commodity prices go higher” 

“I’m not buying rice and sugar at the moment but some of these things are down a lot from their all-time highs. There’s potential opportunities out there.”

Transcribed from interviews on Jim Rogers Talks Markets

Jim Rogers: I own more Gold than I do Dollars

“Well, I own gold, I own some gold. I don’t think that’s what’s going to be the safe haven at the moment; it could be, I mean, if war breaks out, of course, a lot of people are going to flee into gold, and I’ll be buying more gold at 1,500 or you pick the number, and happy to get it. No, if the world reverts to the US dollar, the US dollar goes higher, often, not always, but often, gold goes down when the dollar goes up. People be fleeing to the dollar, they think it’s the better safe haven. So I would prefer – I own more gold than I do dollars, at the moment, I’m not sure I own more dollars than I do gold, at the moment, expecting the dollar to go higher, which will put more pressure on gold. But I’m not selling my gold; I am hedged with my gold. I’m doing nothing at the moment.” – via www.midasletter.com