
Energy & Commodities
 “What is most ironic is that the power used by Greenpeace in Europe to fight the “tar sand’s” theoretical destruction of boreal forests is provided by the cutting down and grinding up of actual Canadian boreal forests.’
The sad part is that in almost every case biofuels start out sounding like a good idea. The argument goes that biofuels made from waste biomass can give power without incurring an environmental cost and would be carbon neutral. The problem is that there is only so much waste biomass out there and power plants need a steady source of fuel. So in almost every case power producers need to rely not only on waste biomass but on virgin materials. As described in the linked Economist article, in Poland and Finland, wood meets more than 80% of renewable-energy demand and in Germany, wood makes up 38% of non-fossil fuel power consumption.So where is this wood coming from? As described in the web posting at FSC-Watch in the southern US, NGOs have shown that the biggest US pellet producer, Enviva, is sourcing a high proportion of wood from the clear cutting of bottomland hardwood forests – some of the most biodiverse temperate forests and freshwater ecosystems worldwide.
As for Canada we export about 1.3 million tons of wood pellets, most of it from boreal forests, to Europe every year. As for being “carbon neutral”, boreal forests grow slowly and model simulations reported in the journal Climate Change indicate that harvest of a boreal forest will create a “biofuel carbon debt” that takes 190–340 years to repay. So boreal forest wood is carbon neutral as long as you wait 3 centuries or so. To put it in perspective, in order to provide power for the factories and electric cars in Europe, Canadian and US forests are being cut down, often at an unsustainable rate, resulting in the destruction of valuable habitat and loss of ecosystem diversity. What is most ironic is that the power used by Greenpeace in Europe to fight the “tar sand’s” theoretical destruction of boreal forests is provided by the cutting down and grinding up of actual Canadian boreal forests.
….to read the entire article go to “On renewables and the need for compromise Part IV: biofuels – just bad or really bad?“
…related: Biomass: The Chain of Destruction

Another week – another CFTC report – more of the same, namely the large speculative category, hedge funds and other reportable traders, continue their love affair with crude oil. This, in spite of the fact that the black goo has lost 50% of its price since June of this year.
I have said now for the last few weeks and will say it once more, I am completely mystified and baffled as to how the supposedly smartest and most informed traders on the planet could have gotten this market so wrong. Not only that, but that they continue to stay wrong!
Maybe they all know something that the rest of us smaller traders do not. Speaking of smaller traders, the general public, dumped a considerable amount of their existing long positions this past week ( FINALLY – for a change!). That being said, they also covered some of the smaller position they have on the short side. The result was a 6700 reduction in the total net long position. They remain net long but they are finally moving out it would seem.
The hedge funds did actually finally manage to convince themselves to part with some of their dearly beloved long positions ( almost 14,000) but they still are large net longs in this market by a more than 5:1 ratio! Astonishing!
The other large reportables decided that they would rather cover some short positions than add to that side while only getting rid of a mere 2200 longs. The result is that they actually increased their NET LONG position by over 11,500 contracts! Again, I have no explanation whatsoever for this.

In looking at the COT chart, you can see that the speculative world has been incorrectly positioned in crude oil since June of this year with the majority in all three camps missing the entirety of one of the most powerful and abrupt downtrends that this market has experienced since 2008. One gets the distinct impression that they were caught flatfooted and still cannot believe what happened to them. This is quite peculiar especially when one considers that as a general rule, hedge fund computerized trading programs are designed specifically to work with TRENDING MARKETS. it is sideways markets that tear this group to shreds.
So here we have a powerful bear trend in place and they are wrong by a 5:1 margin!

Larger Image
It is difficult for me to therefore see this market bottoming out anytime soon – not as long as you have so many “hangers on” hanging on the long side.
What makes this move even more strange is that normally, when markets are experiencing sharp moves lower and speculative forces are on the long side and are liquidating, one sees commercial interests covering shorts and thus reducing a net short position that they put in place as the market rallied prior to the liquidation break.
We are getting exact opposite in this WTI market – we see the market falling but commercials are selling- not buying – while speculators remain net long. As I said – I am trying to recall seeing this sort of setup and having difficult doing so. Even in this market, back at its height before the credit crisis of 2008 undid it, Commercials had built a massive net short position against a massive net long position among the speculators. As the market broke – along with everything else back then – commercials were busy buying back existing short positions into the selling of the speculators who were long and getting obliterated.
This time around the market is falling but the specs have been buying while the commercials have been selling. Maybe that is going to change soon but for now, it does not seem to be the general case.
In other words, we have seen nothing that would even slightly resemble any sort of capitulation at all in the crude oil market amongst the speculative class. Could be some of them are buying against what they think will be a floor near or just above the $50 level but that is based on just hunches and nothing concrete that I can see for now.
Maybe they are simply ignoring their systems and doing some sort of discretionary trading and actually going against the trend with that sort of price floor in mind. I honestly do not know – but the fact that this stubborn bullishness remains in place after a market has lost 50% of its value is certainly an extremely rare occurrence.
Tomorrow we have the EIA numbers for Crude and its products. It seems that the majority of analysts are looking for a drawdown in crude stocks ( 600,000). The thinking is that gasoline demand is high during the week of Christmas as people journey around to see family. Same goes for jet fuel use, etc.
The thing is, that was also expected to be the case with this afternoon’s API (American Petroleum Institute) number. It too was expected to reveal a draw in crude oil stocks. Guess what? It DID NOT! Instead of an expected barrel drawdown, API gave us a BUILD (Increase) of 760,000 barrels. WHOOPS! What is even more troubling is that the stocks at Cushing – the delivery point for the Nymex crude oil contract – rose by a whopping 1.8 MILLION Barrels.
We are getting some reports of rigs being idled, which is a positive for the overall industry as we look forward but there is still a massive amount of oil supply coming into this market. OPEC has still shown no signs of cutting production whatsoever. According to reports from Bloomberg, the oil cartel pumped 30.56 million barrels per day in November. That exceeded their own collective target of 30 million per day for the SIXTH MONTH IN A ROW! Venezuela is screaming bloody murder but the rest of their cartel members could care less!
I still feel that it is going to be at least Q2 2015 before we are going to see any serious denting of the supply overhang in this market. We’ll see what kind of year-end idiocy we get in the price action tomorrow but keep in mind that many traders are already gone for the holiday this afternoon – they packed up and left today… that means pit populations and screen readers are going to be even fewer than there were today – and today was a case of how thin trading conditions can result in some very bizarre price swings.
I for one am going to be very glad to see the full contingent of pit denizens returning for business next Monday.

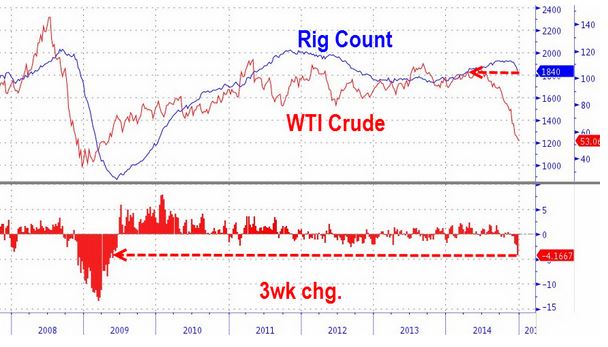
Just as T. Boone Pickens warned “watch the rig counts” last week, so the Baker Hughes rig count just collapsed for the 3rd week in a row to 8-month lows. This is the fastest 3-week drop since mid-2009. Crude prices were already weak but the news has flushed WTI to a $52 handle (not seen in the front-month contract since May 2009)
Rig count is tumbling… CLICK to see all the charts
 If you only paid attention to the mainstream media, you’d be forgiven for thinking that the U.S. is going to get away from the collapse in oil prices scot free. According to popular belief, America is even going to be a net winner from cheaper oil prices, because they will act like a tax cut for U.S. consumers. Or so we are told.
In reality, though, many of the jobs the U.S. energy boom has created in the last few years are now at risk, and their loss could drag the economy into a recession.
The view that cheaper oil automatically boosts U.S. GDP is overly simplistic. It assumes that U.S. consumers will spend the money they save at the pump on U.S.-made goods rather than imports. And it assumes consumers won’t save some of this windfall rather than spending it.
Those are shaky enough. But the story that cheap fuel for our cars is good for us is also based on an even more dangerous assumption: that the price of oil won’t fall far enough to wipe out…..
Trading position (short-term; our opinion): No positions are justified from the risk/reward perspective.
The price of crude oil declined yesterday once again – was the bottom reached yet?
In our opinion – not yet, but it could be the case that we’ll see some kind of pause shortly. The big picture provides us with the same implications as it did yesterday (charts courtesy of http://stockcharts.com):

Our previous comments remain up-to-date:
The first thing that catches the eye on the above charts is a breakdown below the long-term blue support line (based on the 2002 and 2009 lows and marked on the monthly chart) and the 70.7% Fibonacci retracement based on the entire 2009-2014 rally (marked with green on the weekly chart), which suggests further deterioration in the coming day (or days). If this is the case, the commodity could drop to around $51-$52.73, where the 76.4% and 78.6% Fibonacci retracement levels are.
If the long-term outlook is that bearish, then why can we expect a pause here? Because on a short-term basis we saw a daily reversal (doji candlestick) on significant volume.

Since doji on high volume is a reversal sign, we could see one, but since the momentum is so strong in case of the crude oil market, it could be the case that the correction that we’ll see will be very limited – perhaps similarly to what we’ve seen at the beginning of the month.
Summing up, while we may see a corrective upswing shortly, it doesn’t seem that the decline in crude oil is completely over. The space for declines seems limited, and consequently we think that opening short positions at these levels is not justified from the risk/reward perspective.
Very short-term outlook: bearish
Short-term outlook: mixed with bearish bias
MT outlook: mixed
LT outlook: bullish
Trading position (short-term; our opinion): No positions are justified from the risk/reward perspective at the moment, but we will keep you informed should anything change.

-
I know Mike is a very solid investor and respect his opinions very much. So if he says pay attention to this or that - I will.
~ Dale G.
-
I've started managing my own investments so view Michael's site as a one-stop shop from which to get information and perspectives.
~ Dave E.
-
Michael offers easy reading, honest, common sense information that anyone can use in a practical manner.
~ der_al.
-
A sane voice in a scrambled investment world.
~ Ed R.
Inside Edge Pro Contributors

Greg Weldon

Josef Schachter

Tyler Bollhorn

Ryan Irvine

Paul Beattie

Martin Straith

Patrick Ceresna

Mark Leibovit

James Thorne

Victor Adair