

 Angelos Damaskos, principal adviser of the Junior Oils Trust, admits that he finds the recent collapse in oil price a mystery. Nonetheless, he has no doubt that demand will compel higher prices in the medium and long term. In this interview with
 The Energy Report: The price of crude oil has fallen 30% over the last four months. Are you surprised?
Angelos Damaskos: It’s astonishing, considering that the price had been stable for over three years, trading between $100 per barrel ($100/bbl) and $120/bbl for Brent crude.
TER: Why has this happened?
AD: It’s unlikely that demand has collapsed so dramatically over the last four months. All indicators point to a fairly stable global economy, and the American economy in particular is enjoying healthier growth than previously.
TER: So has the price drop been orchestrated?
AD: Nothing can be substantiated, given the opacity of the oil market, but there are three theories. The first is that Saudi Arabia is overproducing to hurt the American shale oil industry. Many shale oil deposits are probably marginal at around $75–80/bbl.
The second theory is that Saudi Arabia may be overproducing to starve ISIS of funds. This is a more credible theory than the first, because this result would please the United States, as the oil price fall also hurts Russia, Iran and Venezuela.
The third theory is that China, which has significant control over marginal oil demand, has deliberately curtailed its imports of foreign commodities over the last four to six months, as industrial users are drawing down their inventories. The Chinese are trying desperately to control domestic debt and protect their banks. Chinese institutions have used commodities as collateral to leverage operations, leading to, among other problems, a dangerously overheated property market. This third theory would also explain the dramatic fall in the prices of base metals such as copper, aluminum, zinc and especially iron ore, which is now near an all-time low.
TER: Wouldn’t Saudi Arabia cutting the price of oil be a case of cutting off its nose to spite its face? Saudi billionaire Prince Al-Waleed bin Talal pointed out, in an open letter to Saudi Arabia’s oil minister, that 90% of that country’s revenue comes from oil sales, so that to underestimate the consequences of a drastically lower oil price would be a “disaster which cannot pass unnoticed.”
AD: The Prince certainly has a point. However, if we accept the theory that Saudi Arabia has a politically motivated interest to oversupply to harm America’s shale oil industry, a significant reduction in new American supply would likely lead to more stable long-term oil prices, and this might actually benefit Saudi Arabia.
 TER: Vladimir Putin has said that the global economy will suffer if the price of oil stays at $80/bbl. Putin obviously has a vested interested in higher oil prices, but is there anything to his argument?
AD: His argument simply doesn’t make sense. Cheaper oil helps economic growth.
TER: How long will low oil prices last?
AD: Our belief is that the super cycle for oil is still intact. China now accounts for 11% of global oil consumption, versus 21% for the U.S. However, China has 1.3 billion people versus 360 million (360M) for the U.S. Furthermore, China represents 19% of global population. China’s GDP per capita has risen by 350% from 2000 to 2013, versus a U.S. rise of only 7.5%. It is evident that China’s energy consumption has risen significantly more than any other country’s. This is the primary reason for the rising oil and energy prices in the last decade.
As China develops a middle class demanding a higher standard of living, this will require more energy consumption. Energy demand from China is likely to continue to grow at very rapid rates. Shale oil has added 2–2.5 million barrels (2–2.5 MMbbl) per day incremental supply to the U.S. over the last five years. However, conventional oil-source production from the U.S., the North Sea, Mexico, North Africa and the Middle East has fallen, so overall global supply has been more or less stable. The oil price drop is clearly temporary.
TER: When I spoke to you earlier this year, you noted the risky economics of the Alberta oil sands and fracking. Now that oil prices have fallen 30%, and the price of natural gas has fallen from above $4.20/million BTU in September to $3.87 at the end of October, are these industries in peril?
AD: There are certainly question marks about the viability of shale oil developments. Oil shale wells decline 50–70% in their first year of production. Companies need to keep on drilling to maintain production. Oil prices at current levels mean that shale companies will find it much more difficult to finance their capital programs. Management teams will lack the confidence to embark on ambitious, high capital expenditure (capex) programs.
The same considerations apply to Alberta’s tar sands, which have marginal costs of $70–80/bbl, and to the deep sea fields in offshore Brazil that have not yet come into production, but are probably even more expensive.
TER: Do you stand by your May prediction that in 10–20 years oil should be well above the 2008 high of $147/bbl?
AD: Yes, based on our assumptions regarding Chinese growth and development stated above.
TER: When will we see a recovery in oil and gas prices?
AD: Oil will likely stay in a very tight trading range for the next three to six months, but oil prices of $70–80/bbl are not sustainable. In the medium term, prices should hit $100/bbl.
TER: You are the principal adviser of the Junior Oils Trust (JOT). Its value rose 18.3% from Jan. 1 to Sept. 30, making it the top-performing fund among the 20 energy funds monitored by Morningstar. Which factors explain the trust’s success?
AD: We have three fundamental investment criteria. The first is to invest at relatively low prices in companies controlling large Proven and Probable reserves. This requires expertise in assessing the geology and nature of the deposits and their likely economic value.
The second criterion is avoiding pure exploration risk, meaning that there should be strong evidence of growing production in our investment holdings from well-understood geological settings. We invest in exceptional circumstances in early movers: companies that have secured licensed areas in new prospective territories. These companies are frequently funded by larger players that follow in their steps. Such juniors obtain exposure to high-impact exploration with limited monetary risk.
The third criterion is the consistent avoidance of political risk in operations in areas where the rule of law cannot protect title of ownership.
TER: How has the oil price fall affected how you evaluate the merits of particular junior oil companies?
AD: The price of oil is extremely important in our evaluation of current and future holdings. The lower oil price is extremely damaging to heavy oil companies and unconventional operators, such as the North American shales. Such companies with fixed obligations can get into trouble very quickly.
TER: What are your favorite junior oil companies in Asia?
AD: I would suggest two of our larger holdings, which are relatively insulated from the current price environment. The first is Carnarvon Petroleum Ltd. (ASX:CVN). It has benefited recently from a major discovery by its partner Apache Corp. (APA:NYSE) on the Phoenix project in Australia’s North West Shelf. Apache has exercised its option to drill further wells and appraise what it has found, which means that Carnarvon’s capex is fairly limited.
“Relatively smaller companies not widely covered by the investment community can often provide exceptional value.”
This is a very long-term program. Positive cash flow is 10–15 years away, and it is most likely that Carnarvon will be out of this development by then. It is typical for small early-stage developers to divest once their projects have reached the field development program state. If they don’t sell to Apache, it is very likely that they will find another large oil company to sell to. Carnarvon is a hedged bet against current weak oil prices.
TER: What can you tell us about Carnarvon’s production in Thailand?
AD: Thailand has been a significant factor in Carnarvon’s valuation. It provides cash flow and stability and makes its operations viable and sustainable. Since the Phoenix discovery, however, Thailand has become a rather small part of the company’s valuation. I understand that Carnarvon is trying to divest part or all of its operation there.
TER: What’s your second Asian junior favorite?
AD: Salamander Energy Plc (SMDR:LSE). It has very solid production from Indonesia and an existing deal with another company to sell part of its assets for a significant consideration. Recently, Salamander has received an indication of a potential takeover by Ophir Energy Plc (OPHR:LSE). Even though Ophir hasn’t tabled its offer and hasn’t revealed a specific price or valuation, we believe that it is likely to be significantly higher than the current share price. Salamander trades at about £1 on the London market. Our assessment of its net asset value suggests a true value of 140–150 pence, 40% to 50% higher.
To the investor, Salamander represents an arbitrage situation. Better still, Salamander had previously rejected an approach by another consortium, so we could end up with a bidding war.
TER: Does the Ebola epidemic give West Africa a significantly higher jurisdictional risk?
AD: Yes, to the countries that have been most severely affected: Liberia, Guinea, Sierra Leone and perhaps Nigeria. We have long avoided investments in onshore Africa and focused instead on offshore developments that are mostly insulated from epidemic risks because their platforms are far out to sea. Offshore platforms are much easier to control for health purposes. In addition, they have traditionally been immune from political problems.
African governments are very dependent on oil revenues and thus dependent on the international oil companies that operate in their territories. So they have been unwilling to expropriate or otherwise interfere with offshore developments.
TER: What’s your favorite junior oil company in West Africa?
AD: FAR Ltd. (FAR:ASX), which is an example of the “early mover” I mentioned above. It has secured properties in the jurisdictions of Kenya, Guinea Bissau and Senegal that have been farmed out to larger operators. In August, FAR announced that one of these farm-outs had made an enormous discovery off the coast of Senegal and then followed on with a second discovery on Oct. 7. These discoveries demonstrate the merits of FAR’s business model: acquiring licenses, learning the geology through seismic surveys and then inviting bigger companies to examine what it has found. FAR owns 15% of the Senegal block, with Cairn Energy Plc (LON:LSE) owning 40%, ConocoPhillips (COP:NYSE) 35% and Petrosen, Senegal’s national oil company 10%. The initial drilling budget was $80M, and this has risen to $180M, but the money has been mostly spent by Cairn and ConocoPhillips.
Some would say that the Senegal discoveries have already been factored into the share price, which has risen over three times in the last year or so. So, what now? The consortium is appraising the drilling results, and it is very likely we shall see further good news about the size of the deposits and their economic viability as they get derisked. Furthermore, FAR has some very attractive licensed areas offshore and onshore Kenya. If FAR is successful in farming out these potentially high-impact targets, we could see further discoveries. This is another example of a far-forward discounted investment that is largely insulated from today’s oil prices.
TER: Cairn’s initial estimate of the first Senegal discovery is 250 million barrels (250 MMbbl) to 2.5 billion barrels, with a “most likely” total of 950 MMbbl. If the proven amount is significantly higher than the most likely estimate, how would this affect FAR’s valuation?
AD: It could be hugely transformational. It is just impossible, at this stage, to try to evaluate the impact of such a finding. The initial estimate is probably conservative, because engineers like to err on the side of caution. In any event, we think FAR is a fairly attractive investment opportunity, given the risk/reward ratio.
TER: What’s your favorite oil junior in Africa north of the Sahara?
AD: We don’t have many holdings in North Africa because this region has been fairly unstable and risky since the Arab Spring, but we have held Circle Oil Plc (COP:AIM) for a long time, from before the turmoil began. Circle’s primary operations are in Egypt, but it has suffered no disruptions. The company had no problems sourcing supplies or equipment, and none of its employees fled or left the company. Its only difficulty has been that because it sells oil to the Egyptian General Petroleum Corp. (EGPC), Egypt’s national oil company, its receivables increased dramatically. EGPC wasn’t paying its bills on time, but this has changed dramatically in the last year.
Circle also has growing production in Morocco and an almost 100% drilling success rate, with a large number of low-risk prospects there. Most recently, it has had an attractive discovery off the shore of Tunisia. It’s early days, but the company has estimated an initial find of up to 100 MMbbl. This could be the most significant discovery from offshore Tunisia in recent years. For a junior, it is a phenomenal result.
TER: Is Circle undervalued?
AD: Its current market cap is $152M, and it produces about 6,700 bbl per day. This equates to approximately 6 pence per share of cash flow per annum, but its share price is only 17 pence. Circle trades barely above 2x cash flow from its Egyptian and Moroccan production alone. This is a viable, growing company with significant cash flow and profits that account for most of the share price with a potentially huge bonus from Tunisia, which is currently ignored by the market. Should the Tunisian discovery require a large investment to take it to production, Circle could easily farm it out to another company or do a joint venture with a larger company.
TER: What is your favorite junior in North America?
AD: Caza Oil & Gas Inc. (CAZ:TSX; CAZA:LSE) is our favorite play there. This is a company that goes from strength to strength. It has a very successful drilling record and has continually added to its production rate over the last two years. It is now almost at 2,000 bbl per day, which could potentially change its valuation and make it a very attractive takeover target by a larger oil company. Plus, it has a very large inventory of potential targets in its territories with substantial seismic data that point to a very large number of drillable prospects.
Major expansion would require a significant capex, so Caza is mobilizing at a slow rate. If a major were to take it over, however, it could employ a significant capex plan in a low-risk exploration and development strategy. We think that this company is a potentially attractive prospect for another company to either joint venture or take it over outright.
TER: Caza announced results from the initial well at its Broadcaster property in New Mexico Sept. 18. How accretive is this to the company’s value?
AD: It’s extremely attractive because Broadcaster is in the Bone Spring formation. This has become one of the fastest growing oil regions in North America based on improved technology. Horizontal drilling has enabled local operators to multiply production rates several times. Bone Spring underpins Caza’s future production growth. Broadcaster is a low-risk operation with the potential to greatly increase production.
TER: You mentioned earlier your bias against pure exploration plays. Doesn’t the recent fall in oil prices improve the viability for those companies that are already in the game?
AD: The problem we face is that we cannot readily assess the impact the oil price fall will have on the profitability of mature producers. Juniors with longer-term prospects, such as the five we’ve discussed, do not have this problem. Obviously, companies with more mature production have better balance sheets, but until we fully understand the implications of recent price changes on profitability, we cannot estimate how their guidance will change in the next quarter.
At this stage, one must be extremely careful in buying mature producers. I would prefer to focus on light oil producers with high netback margins where the impact of the fall in the oil price is proportionally smaller than heavier oil or shale oil producers, which have a much higher marginal cost and much lower netback margins. Such companies face the risk that the oil price fall could potentially destroy their profitability.
TER: The share prices of all the juniors we’ve discussed are quite cheap. The most expensive is £1. So the potential returns to those who invest in these companies would be much greater than potential returns from mature companies, correct?
AD: Absolutely correct. That is the essence of our investment thesis and the fundamental reason for the superior performance of the Junior Oils Trust. Relatively smaller companies not widely covered by the investment community can often provide exceptional value.
TER: Thank you for your time, Angelos.
Angelos Damaskos is the founder and CEO of Sector Investment Managers Ltd. of London, a regulated investment advisory company. He is the Principal Adviser of the Junior Oils Trust and the Junior Gold Fund. The Junior Oils Trust focuses its investments in smaller oil and gas exploration and production companies. An investment banker, Damaskos worked a decade for the European Bank for Reconstruction and Development. He holds a Bachelor of Science in mechanical engineering from the University of Glasgow and a Master of Business Administration from the University of Sheffield.
Read what other experts are saying about:
Want to read more Energy Report interviews like this? Sign up for our free e-newsletter, and you’ll learn when new articles have been published. To see a list of recent interviews with industry analysts and commentators, visit our Streetwise Interviews page.
Related Articles
- Angelos Damaskos: The Best Way to Profit from Peak Oil
- Bob Moriarty: $80 Oil Is the New Normal Minimum
- America’s First Oil Sands Producer and Other Natural Resources Surprises: Peter Epstein
DISCLOSURE:
1) Kevin Michael Grace conducted this interview for Streetwise Reports LLC, publisher of The Gold Report, The Energy Report, The Life Sciences Report and The Mining Report, and provides services to Streetwise Reports as an independent contractor. He owns, or his family owns, shares of the following companies mentioned in this interview: None.
2) The following companies mentioned in the interview are sponsors of Streetwise Reports: Caza Oil & Gas Inc. The companies mentioned in this interview were not involved in any aspect of the interview preparation or post-interview editing so the expert could speak independently about the sector. Streetwise Reports does not accept stock in exchange for its services.
3) Angelos Damaskos: I own, or my family owns, shares of the following companies mentioned in this interview: None. I personally am, or my family is, paid by the following companies mentioned in this interview: None. My company has a financial relationship with the following companies mentioned in this interview: Carnarvon Petroleum Ltd., Caza Oil & Gas Inc., FAR Ltd., Circle Oil Plc and Salamander Energy Plc. I was not paid by Streetwise Reports for participating in this interview. Comments and opinions expressed are my own comments and opinions. I determined and had final say over which companies would be included in the interview based on my research, understanding of the sector and interview theme. I had the opportunity to review the interview for accuracy as of the date of the interview and am responsible for the content of the interview.
4) Interviews are edited for clarity. Streetwise Reports does not make editorial comments or change experts’ statements without their consent.
5) The interview does not constitute investment advice. Each reader is encouraged to consult with his or her individual financial professional and any action a reader takes as a result of information presented here is his or her own responsibility. By opening this page, each reader accepts and agrees to Streetwise Reports’ terms of use and full legal disclaimer.
6) From time to time, Streetwise Reports LLC and its directors, officers, employees or members of their families, as well as persons interviewed for articles and interviews on the site, may have a long or short position in securities mentioned. Directors, officers, employees or members of their families are prohibited from making purchases and/or sales of those securities in the open market or otherwise during the up-to-four-week interval from the time of the interview until after it publishes.


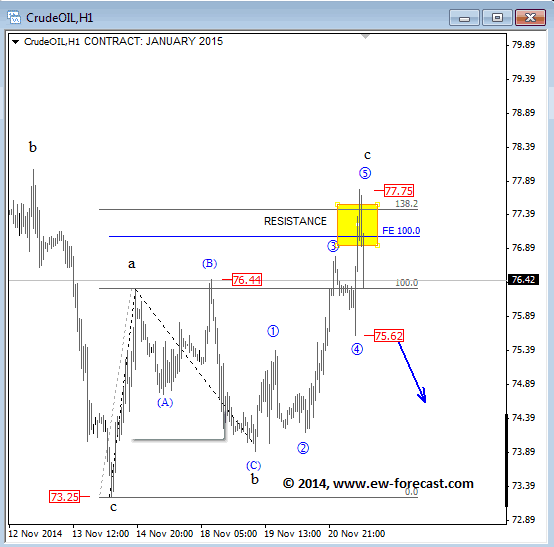
 Last month I briefly discussed how low crude prices
 To answer this question, Strategic International Securities Research (SISR) ran a correlation coefficient between the retail price of gas and 72 global industry classification standard (GICS) sectors, focusing on the years 2000 through 2014. Below are the top three sectors that ended up benefiting the most from falling gas prices. They all have a negative correlation coefficient, meaning that their performance has historically gone in the opposite direction as the price of gas, similar to a seesaw.
 It makes sense that airlines would perform better, since fuel is typically their largest single expenditure. In 2012, when the average price of a barrel of oil was $110, fuel accounted for 30 percent of airlines’ annual operating costs. Low fuel costs are cited as the main reason why Virgin America, which went public last week, reported third-quarter profits of $41.6 million, an increase of 24 percent year-over-year. The NYSE Arca Airline Index has flown up 110 percent since the beginning of 2013, hitting 13-year highs, and Morgan Stanley recently took a bullish position toward airline stocks, showing that company balance sheets are “structurally sound enough to make ‘events’ in the next five years unlikely” and that the industry as a whole is now growth-oriented.


 Members of the Organization of the Petroleum Exporting Countries (OPEC) will be meeting on the 27th, and no doubt the discussion will center on whether to curb production to help oil prices recover. However, a new poll shows that commodity and energy investors do not believe such a cut will occur. According to BMO Capital Markets, 87 percent of those polled believed that no cut would be agreed on. Even those who said a cut would happen believed it would be no more than a million barrels a day, an insignificant amount.


