Energy & Commodities

COMMODITY PRICE TARGETS: OPEC Production Too High – Oil Glut Should Push Oil Prices Down

Screen shot 2013-06-13 at 2.07.06 PMWhat’s Inside:  

Energy   Correction   Underway   -­‐   Remain   Defensive  

Maison   Universe   High   Impact   Drilling   Watch   List  

Research  Updates:  

Delphi  Energy  Corp.  (DEE-­‐T)

Gran  Tierra  Energy  Inc.  (GTE-­‐T)  

Long  Run  Exploration  Ltd.  (LRE-­‐V)  

Tamarack  Valley  Energy  Ltd.  (TVE-­‐V)  

Top  Picks:    No  Top  Picks  This  Month     

Recommended  Buy  List     

Coverage  List

Some Like It Hot:The Outlook for Industrial Metals

Commodities may have broken out of a commodity supercycle and could be hitting a cyclical trough. Lisa Morrison, the principal consultant of CRU Group in Philadelphia, analyzes the price outlook for 26 commodities over the next four years and gives them a temperature rating from hot to freezing. In this interview with The Metals Report, Morrison, using this rating methodology, details which commodities she expects to offer the best upside for investors and which to avoid.

The Metals Report: Lisa, CRU recently published a report, “CRU Commodity Heat,” which measures the near- and medium-term outlook for 26 different commodities, most of which are mined. How does CRU measure the market heat of these commodities?

Lisa Morrison: We start with the average for each commodity price in the first quarter of 2013 and then we compile CRU’s view of the change in price between the first quarter and the annual average for 2013 and then each year through 2017. We do this analysis every quarter.

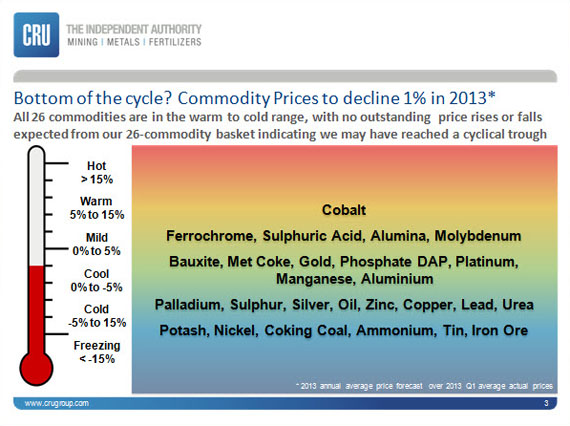
We categorize commodities according to their anticipated price movements. A hot commodity has an anticipated price increase of 15% or greater, warm is 5% to 15%; mild is 0% to 5%, cool is 0% to -5%, cold is -5% to -15% and freezing is greater than -15%.

TMR: Are there any hot commodities right now?

LM: Looking at the 2013 annual average, we don’t see any hot commodities. That’s because most commodities have come off of some very high points. The end of last year saw a bit of a crash. The strongest increase that we see between Q1/13 and the 2013 annual average is cobalt.

Morrison 2013

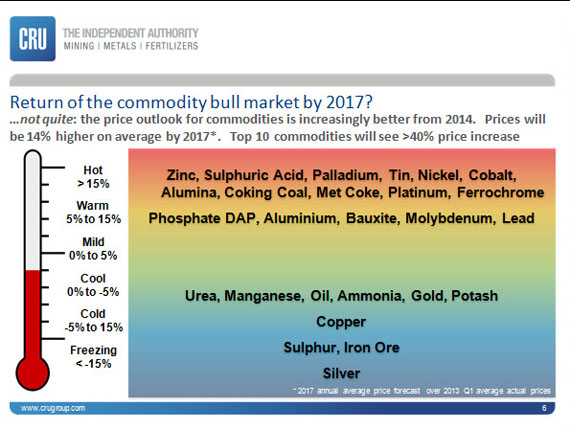
But looking further out into the forecast to 2017, we see some commodities that could move into the very hot region.

Morrison 2017 chart

TMR: With so many commodities in the mild, cool, cold and freezing zones currently and in the future, does that mean we could see mines being shut down?

LM: A steep drop in the commodity price certainly could indicate that we have a period coming where strong oversupply means that producers may need to shut down, especially the higher cost ones. If a commodity has been very expensive in the past, meaning its price has been much higher than its cost of production, a steep drop in price doesn’t necessarily mean output would be curtailed. It just means that the market is returning to some sense of normalcy. Copper is a good example of that.

Gold is a case where prices have come down quite a bit too, but because of lack of investor interest rather than needing to shut down gold mines. Aluminum is a case where the market is much oversupplied and the commodity is under some cost pressure. We’ve seen prices come off quite a bit in aluminum, but our heat chart doesn’t show prices are going to decrease much further, simply because prices can’t fall much more. They’ve gotten to the point where producers have to start shutting down because of overcapacity.

TMR: Has the lack of heat in your forecast led you to conclude that the market for these metals has hit a cyclical trough?

LM: That is our view on 2013, but by 2017, we’re looking at markets that are sending a signal to producers to cut back or maybe not ramp up capacity quite so quickly.

The macroeconomic environment is uncertain. Is China going to pick up? Is the U.S. going to pick up? Is Europe ever going to come out of recession? With so many questions on the demand side, producers are being very, very cautious.

We’re probably in the cyclical trough now and I would point to October 2012 as an inflection point. At least in exchange-traded commodities, investors were selling off because they realized that Chinese economic growth was not going to be 9% anymore. It was going to be something more like 7% or 7.5%. There also was a recognition that the U.S. wasn’t going to be picking up and that Europe wasn’t going to do very well in the coming year. Then, of course, we had another selloff in the spring, in March–April, because, again, the economic growth prospects weren’t very good. We’re probably in the low period right now. It’s hard to say how long cyclical troughs last because they vary by commodity.

Depending on the commodity it takes a longer time or a shorter time to shut a mine or shut an operation. A lot of commodities are sold on contract basis, on a one-year contract or six-month, nine-month, etc. Production happens and continues to happen because an agreed-upon arrangement exists. It takes more than six months for commodities to really respond to lower prices. As for the 2017 outlook, today’s lower prices are causing producers to ramp up much more slowly or even cancel new projects. But by the time we get through 2014 and into 2015, we may be back in the situation where we really need more capacity in these commodities.

Screen shot 2013-06-11 at 10.09.56 PMTMR: What’s CRU’s outlook on China?

LM: It’s easy to feel depressed about China because we’ve been accustomed to such a fast growing economy, with double-digit industrial production growth. You can’t sustain that kind of growth for long. The economy now is going through a transition. If you think about Korea in 2000 versus where it was in 1980, it’s a similar situation, but China is a much, much bigger economy. Our view is that China will still achieve strong GDP growth in the 7–8% range over the next couple of years. Industrial production growth won’t probably be double-digits except in a very good month or a quarter here and there, but something in the 7–9% range. China still has a lot of infrastructure to build. People will get wealthier and will need and want more and better food. They are going to need more oil and more cars; they are going to want homes and washing machines. Even though the super fast growing commodity story in China may be over, it isn’t as if we’re getting to a point where China is not going to need commodities anymore.

TMR: Does your view of China lead you to conclude that the commodity supercyle is over?

LM: The commodity supercycle is probably over, but I don’t think it’s the death of commodities. The supercycle was after all driven by the unexpected strong growth in China and expected weakness of the U.S. dollar. At the same time, the metals and mining industries had gone through a period cost cutting, so there had been no investment in capacity or exploration. As a result, the mining industry was completely unprepared for the large surge in demand from China starting in 1995 and picking up again after the Asian financial crisis, in 1997, 1998, 1999 and the end of 2000, which was a peak period for commodities in general. That was very attractive for investors and that is what promoted the supercycle. Now we are going to see that back off. China’s commodity growth isn’t going to be 10% year-on-year; it’s going to be much smaller. But don’t forget that economies with large populations in Asia and in Africa are eventually going to be transitioning as well.

TMR: Do precious metals prices tend to be a leading indicator of a cyclical trough or are they more likely to be some of the last commodities to fall?

LM: Precious metals often function as a safe haven in times of high uncertainty. After the financial crash we didn’t know if the economy was going to survive or how we were going to get economic growth. We saw investors very interested in gold and silver at those times. Of course, prices remain very elevated compared to prior to the crash. Precious metals prices certainly seem to be countercyclical and have high demand, both financial and physical, during periods of high uncertainty.
Screen shot 2013-06-11 at 10.09.21 PMWe have witnessed a certain amount of selling in gold and silver since the middle of last year. That’s because the worst-case scenarios, such as a Eurozone breakup or China sliding into recession, didn’t come about. Even President Obama and Congress managed to get past the fiscal cliff. Investors began telling themselves that because the worst didn’t happen, they didn’t need to be invested in safe havens anymore. That caused a selloff in gold and silver that turned out to be a precursor to selloffs in the rest of the metals space. In that respect they were a lead indicator that the worst of the uncertainty had passed. I don’t think you could look at precious metals demand as necessarily a lead indicator for an economic cycle per se. I think they definitely have a role to play during a cycle and may play a leading role again with consumers when things are looking better.

The U.S. economy is on a much stronger footing than it has been since 2006. The U.S. economy has been a nonentity in the story for the last seven years. Our view is that this year we’re likely to get 2.5–3% GDP growth, moving to the 3–3.5% range for the next two years. That is even slightly above trend compared to what demographics would give you. The U.S. economy is really looking in much, much better shape than it has been for quite some time.

Don’t forget that Japan is going to emerge as well. It’s also been an absent actor on the global economic stage. It’s a big economy and it’s going to emerge from this sleepwalking stage in the next year or so. I think that’s very exciting. It’s hard for me to be very negative about what I see over the next two years. Maybe the next six months aren’t that great for commodities, but over the medium to longer term the outlook is very positive.

TMR: What is your outlook for gold, silver, platinum and palladium?

LM: Our forecast is that the gold price peaked in 2012 and that the good times for gold are pretty much over. We expect prices to come down through 2017. In silver that is also the case. If the interest in gold has peaked, the interest in silver is gone and that price is going to come down a lot faster. I certainly would not want to be holding either one of those for any length of time.

Platinum and palladium are a bit different because they are much more industrial type metals. They are produced in very small quantities in markets with supply constraints. Particularly in palladium, we also have had inventories that were coming out of the former Soviet Union and those Russian stockpiles and shipments are ending. There’s no more left there, so we are coming back to the actual private market.

This means producers of palladium now have to increase capacity to meet demand. We’re looking for pretty strong price increases—extremely strong in palladium. That’s one of the super hot commodities. Going out through 2017, platinum would also fall into that super hot period because it’s expected to increase well over 15% over the next five years. We’ve got lower prices now, but new capacity is going to be needed, so prices will pick-up after 2015.

TMR: What other commodities do you expect will move from neutral into the hot category over the next few years?

LM: We’re looking at cobalt, which has had the strongest price increase this year. The best of the price increases are going to be in the very near term and things will slide off after about 2015–2016. Tin also has had some supply constraint problems, so that’s going to move into the hot category next year.

Zinc, which is much oversupplied at the moment, is quite likely to move into the hottest commodity category five years from now because the new mines that we are going to need can’t be financed at today’s prices. With financing as tight as it is, those zinc mines are not going to be started for the next couple of years. It takes quite a few years to bring a zinc mine into production, so we could be looking at a late decade squeeze in zinc.

TMR: What about copper?

LM: Copper prices have been well over $7,000/tonne and have found it quite difficult to break below $6,800/tonne. Copper is likely to be better supplied than it has been for 10 years, so a major shortage going forward is unlikely. Of course, that assumes that the mine supply comes on the way it is supposed to. The mines are coming on in places that traditionally have had some difficulties such as Peru and Africa.

We will probably still see relatively high copper prices, meaning something in the $6,500–7,500/tonne range, to bring on these new mines needed in the next five to seven years to meet demand. Everything in copper hinges on whether or not mine supply comes on as expected.

TMR: Nickel prices have been very weak over the past four or five years; why are you predicting a 41% increase between now and 2017?

LM: Nickel has been punished because it’s in oversupply. Supply came on at the wrong time, just when demand was coming off. Demand hasn’t really picked up terribly well. In China nickel pig iron is used as a cheaper alternative to pure nickel. This was how China dealt with its shortage of nickel resources and its need for more nickel for stainless steel. Stainless steel is a higher-end commodity. China is shifting from heavy industrial or heavy infrastructure to something that’s more consumer oriented and more high-value added. Although the demand for steel and iron ore may go down and those prices may fall, that shift to something consumer oriented is going to support nickel prices going forward. It’s really a China story in nickel again.

TMR: How are gold and silver likely to react to the unwinding of quantitative easing in the U.S., Japan and Europe?

LM: If we get a lot of inflation because of the unwinding of quantitative easing, we may not see the drop off in prices that we’ve forecasted. Our view is that quantitative easing in the U.S. isn’t going to start to get unwound probably until the end of next year to any significant extent. It will be done in a relatively gradual way. Unwinding in Japan probably won’t happen until well after that because its central bank has institutionalized yet another round of it. It’s going to be a gradual process. The winding down will be difficult to time because we can’t even get that information out of the Federal Reserve Board at the moment.

As those uncertainties are reduced and things become clearer, then what we do at CRU is look at sentiment in the next year or two and try to figure out how that affects the price forecast. Then, as we move away from year two, we really should revert to the fundamentals of supply and demand in those markets.

We can’t really see how the current price of silver is justified given that the lack of massive investor influx to support the price. That’s why we expect the price to come down. Gold is a little a bit different, but similar. We look at supply and demand. We look at what investors are doing. Investors have really sold off. The question that you need to ask with gold is what’s going to make investors buy again? Or will they keep unwinding at opportunistic times?

TMR: Do you have an answer to your own question?

LM: The only thing I think that would cause people to buy more gold again and to go through another cycle of this massive investor buying would be if it became a commonly held perception that quantitative easing was going to be unwound in a way that was going to cause very high levels of inflation. In that case, all commodity prices would go up, but certainly with gold and silver as safe havens, the demand for them would be even stronger.

TMR: Where should investors be long with mined commodities?

LM: The best prospects for being long over the next year in exchange-traded type commodities are probably tin and palladium. Looking at 2017, economic growth picks up after 2015. We hope that market conditions are more normalized. We should be getting finished with quantitative easing. We should have better market signals. In those cases probably the really good prospects there for exchange-traded commodities are zinc and nickel.

TMR: Thanks, Lisa, for your insights.

Lisa Morrison was a speaker at the Society for Mining, Metallurgy and Exploration “Current Trends in Mining Finance—An Executive’s Guide” conference.

Lisa Morrison is an industry analyst in the copper and aluminum markets with the CRU Group, a business intelligence company. She specializes in assessing risks to the short-term outlook and is currently building a research platform to help CRU better predict and model investor behavior in the metals market. She has worked at CRU since 1995 and spent 12 years in the firm’s management consulting division working on projects in aluminum, steel and base metals. Prior to CRU, she spent five years at Haver Analytics and before that more than one year at the Korea Trade Promotion Center. Morrison holds a masters degree in economics from New York University and a bachelors in economics from Drew University.

Want to read more Metals Report interviews like this? Sign up for our free e-newsletter, and you’ll learn when new articles have been published. To see a list of recent interviews with industry analysts and commentators, visit our Streetwise Interviews page. 


DISCLOSURE:
1) Brian Sylvester conducted this interview for The Metals Report and provides services to The Metals Report as an independent contractor. 
2) Streetwise Reports does not accept stock in exchange for services.
3) Lisa Morrison: I was not paid by Streetwise Reports for participating in this interview. Comments and opinions expressed are my own comments and opinions. I had the opportunity to review the interview for accuracy as of the date of the interview and am responsible for the content of the interview.
4) Interviews are edited for clarity. Streetwise Reports does not make editorial comments or change experts statements without their consent.
5) The interview does not constitute investment advice. Each reader is encouraged to consult with his or her individual financial professional and any action a reader takes as a result of information presented here is his or her own responsibility. By opening this page, each reader accepts and agrees to Streetwise Reports’ terms of use and full legal disclaimer. 
6) From time to time, Streetwise Reports LLC and its directors, officers, employees or members of their families, as well as persons interviewed for articles and interviews on the site, may have a long or short position in securities mentioned and may make purchases and/or sales of those securities in the open market or otherwise.


Golden Economics & Silver Surprise

June 11. 2013

1. The saying, “Close, but no cigar!” could probably be used now, to describe gold & silver investors trying to call a turn in the market.

2. Bank analysts are more bearish. UBS technical strategist Richard Adcock says,“The next leg of the bear trend is to be seen down to the long-term 50 percent retracement point at $1,303, which we would set as our objective.” 

3. The action of my gold market stokeillator (14,7,7 Stochastics series on the daily chart) suggests that Adcock could be correct. Please click here now . Double-click to enlarge. In the short term, gold has broken down from a small but bearish rising wedge pattern.

4. The $1300 – $1320 area seems like a reasonable short term possibility, and it’s important to note that banks are rumoured to be aggressive gold buyers now.

5. Only gamblers (anyone using leverage is a gambler) should hedge now, to avoid further price declines. Everyone else should be engaged in very light buying. 

6. In a super-crisis, severe account drawdowns are just part of the “great gold game”. You can’t avoid them anymore than you can avoid breathing air. What matters is being able to carry your head high, regardless of where gold is priced.

7. The action of bond prices has a lot to do with how the gold market moves. In the late 1970s, inflation began to spike, and the Fed started aggressively raising rates. 

8. Banks then shorted gold aggressively, and bought bonds.

9. From 1980 – 2000, gold collapsed and stayed down, while bond prices moved steadily higher. 

10. Are there parallels between that period and today? Well, bond prices stalled out in September of 2011, and so did gold. 

11. There is now a large head and shoulders top pattern on the weekly T-bond chart. Please click here now . The technical target of that top pattern is roughly 126. 

12. If interest rates are starting to rise now, shouldn’t the banks be shorting gold now, like they did in 1979 – 1980?

13. In fact, the opposite appears to be happening; the COT reports show the banks are buying gold aggressively, and here’s why they would do that: By 1980, interest rates on long term bonds were near 20%. 

14. Today, those interest rates are only about 3%.

15. A decline in bond prices to the 126 area, or even to par (100), would hurt bond market investors who bought in 2008 and 2009, but it wouldn’t drive interest rates to anywhere near the levels that existed in 1979 – 1980.

16. What the current decline in bond prices suggests is that global quantitative easing policy, combined with the lightly strengthening economy, is creating inflation.

17. At this point, that inflation is very moderate. Everyone in the gold community knows that prices of what people really need are rising, while governments issue reports that seem to be “massaged”. 

18. It would appear that banks are buying gold, rather than shorting it, because they believe the deflation cycle is ending, and a cycle of rising inflation is beginning.The action of the T-bond suggests they are correct.

19. The Fed believes the business cycle is approximately 8 years long. This would suggest the global economy that peaked in 2007 will peak again, in 2015. In the meantime, if the economy continues to strengthen and interest rates continue to rise, there will be more price inflation, but it should still be quite moderate. 

20. After 2015, as the Fed’s business cycle transitions from “up” to “down”, substantial stagflation is likely to begin, because central banks may feel compelled to print vast amounts of fiat currency, to counter the downturn. 

21. This could cause institutions to panic, and buy gold. At the same time, new Asian gold ETFs should be well-established, enabling hundreds of millions of Chindian (China & India) citizens to buy gold easily, “likely without” affecting the current account deficit of their country.

22. In contrast to almost every other gold analyst, I do not believe that physical gold markets will overwhelm paper gold marketsThe price-setting mechanism will remain with paper gold markets, but it will be overwhelmingly bigger Asian paper gold markets that set the price. Not the comex! The comex is akin to a rotary phone, in a world of iPhones. The comex won’t blow up, but it will become irrelevant.

23. Silver doesn’t do very well in a deflationary super-crisis, as most of the silver community found out, the hard way. It couldn’t even rise above the 1980 highs, while gold soared. In a “stagflationary” crisis, which is likely to happen in the post-2015 period, silver could really shine. Please click here now or view below. That’s the monthly silver chart. I like to keep things simple (the KIS principle). Silver touched the lower Keltner demand line at the 2008 lows, and then staged a huge rally.  It recently touched that same Keltner line again.

2013jun11si1

 
24. Silver offers a lot of value at current prices, to investors who believe in my stagflation and cost-push inflation scenarios in the post 2015 timeframe. Having said that, this is not the same type of market situation that existed during the 2008 lows, and “parabola hunters” should look elsewhere. If you understand silver as an “ultimate asset”, and you can accept that Asian paper gold markets are set for massive growth, then perhaps today is the day that you press the buy button for silver, and hold your head high into 2015!


Jun 11, 2013

Stewart Thomson
Graceland Updates
website: www.gracelandupdates.com
email for questions: stewart@gracelandupdates.com 
email to request the free reports: freereports@gracelandupdates.com

Jim Rogers: Fire in the Field

When I was a child in the 1950s, my family would drive from Alabama, where we lived, to Oklahoma to visit my grandparents. 
 
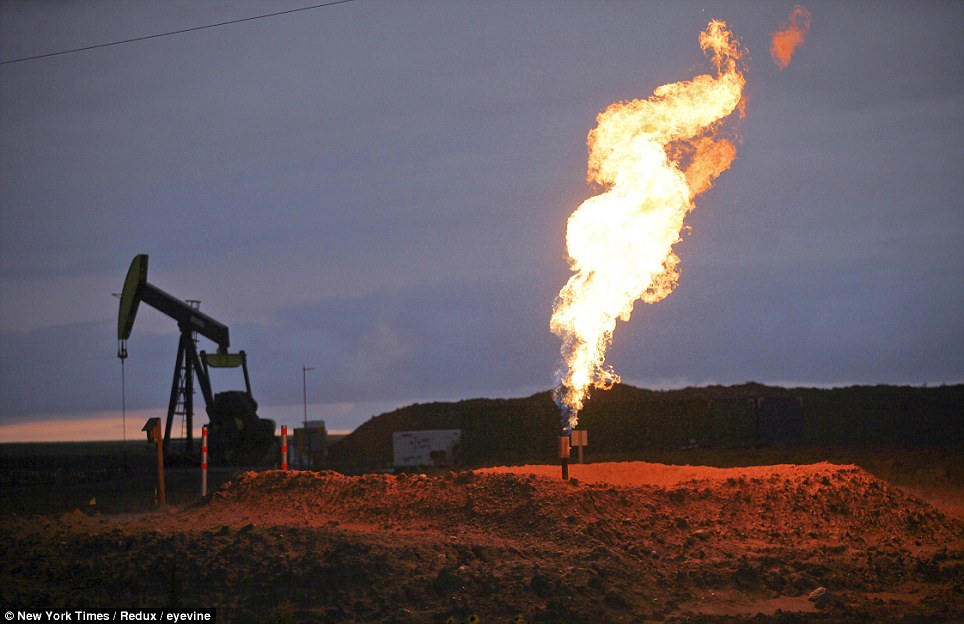
bakken-flaringI can still remember being amazed to see fires in the fields along the road. No one seemed to care. It was only decades later, as a young man on Wall Street looking around for some investment opportunities, that I learned the reason for those fires along the Oklahoma roads of my childhood.
 
There were oil fields out there, and in 1956 the Supreme Court had ruled that the government had the right to regulate the price of natural gas. Washington kept natural gas so cheap that it was more economical for those Oklahoma producers to “flare” it—burn it off—than to produce it while pumping oil. (Ed Note:this article is a fabulous lesson in market behavior)


And there was certainly no financial incentive for anyone to look for new sources of gas or oil, for that matter, which was plentiful (and thus inexpensive) in the 1950s and 1960s. Drilling companies went out of business, and exploration dropped off. The same was true for most other commodities—lots of supply, low prices.
 
By the early 1970s, those prices had begun to rise. Why? Time turns even excess inventories into empty warehouses.
 
No matter how much of a given commodity there is, if supplies are not maintained on a regular basis they will become depleted, leading to price increases. More and more Americans were driving bigger cars; cold winters still required heating oil; and air-conditioning made it possible for more people to thrive in areas of the nation where the heat and the humidity had once discouraged enterprise.
 
And then all those stockpiles of natural gas and oil began to disappear—with nothing to replace them, because no one had been able to make a buck in the hydrocarbon business for years. Soon investors were falling over one another in an effort to capitalize on escalating prices.
 
Between 1966 and 1982, the stock market went nowhere and with double-digit interest rates the bond market collapsed.
 
Meanwhile, commodities boomed. But high prices soon did their normal work of encouraging new supply while cutting demand. Companies began drilling for oil, opening up new mines, and planting corn and soybeans. Gold plunged from $850 in 1980 to $300 in 1982, sugar went all the way back down to 2.5 cents in 1985 from the 66 cent price reached in 1974, while oil collapsed to less than $10 a barrel in 1986.
 
And then the cycle began to repeat itself. With supplies of commodities high and prices low, investors looking for value opportunities eventually returned to the stock market in the mid-1980s.
 
That, too, was predictable: Investors never chase bears. By the 1990s, U.S. investors, mesmerized by the Internet bubble, were funneling every cent they had into company shares of “growth stocks” selling for more than 50 times earnings. In 1999 alone, venture capitalists invested $42 billion—more than the three previous years combined; IPOs raised $68 billion, 40 percent more than any year on record. Not one IPO was for a new sugar plantation, lead mine, or offshore drilling rig, I can assure you.
 
In the meantime, metals mines and oil and gas fields were becoming depleted.
 
To me, it was déjà vu. The oversupply of two decades had created low prices that eventually spawned a bull market in commodities—just what happened in the late sixties.
 
Once again, commodities had been plentiful and cheap. The Asian and Russian crises of 1997 and 1998 led to the final liquidation of those regions’ commodity inventories at fire-sale prices—and worldwide prices hit bottom. During these decades of depleting supply, demand for commodities continued to grow.
 
Asia boomed; the economies of the West and the rest of the world also grew. And, once again, Americans began consuming commodities at an expansive and carefree rate. Years of cheap oil had given drivers a taste for gas-guzzlers again. Everyone seemed to be driving SUVs that only movie stars used to own, driving fuel-economy averages to the lowest levels in 20 years.
 
Those new McMansions rising around the nation, thanks to record-low mortgage rates, required lots of heating and cooling. Big cars and houses also eat up huge supplies of lumber, steel, aluminum, platinum, palladium, and lead for vehicle batteries. Europeans, too, were experiencing a housing boom and driving more and bigger cars than ever, including SUVs.
 
Natural gas, cleaner and more efficient than oil or coal, had become the fuel of choice for North American power plants. Demand in the energy and industrial metals sectors increased further with the widespread economic recovery in Asia. South Korea has become one of the world’s leading importers of commodities. Short of scrap, Japan is racking up record imports of refined copper.
 
And then there was China, gobbling up commodities like the giant economic dragon it was destined to be.
 
All this demand has come at a time when China is short of virtually every raw material it needs. Nor are its neighbors in any position to chip in. With few homegrown commodities of their own, South Korea and Japan are now competing with China for raw materials.
 
In fact, most of Asia has grown dramatically over the past 25 years, pushing up demand further. India’s economy, too, has been growing at its most rapid rate in 15 years, supposedly expanding more than 8 percent between March 2003 and March 2004—which would make it the second-fastest-growing economy in the world after China—and thus increasing its demand for goods. And while Russia may have vast deposits of oil and minerals, the country is falling apart economically as privateers and mafia capitalists strip their nation’s assets, undercutting world supply and further hiking prices.
 
Ironically, U.S. investors were too distracted by their own booming economy and stock market in the 1990s to invest any money in increasing productive capacity of raw materials, agricultural products, and other hard assets.
 
And thus the seeds of the current commodities bull market were sown throughout the world: exploding demand for commodities at the very time that supplies were becoming depleted and investment in the natural resources infrastructure was virtually nonexistent.
 
With that kind of supply-and-demand imbalance, prices can go in only one direction, and that’s up.
 
Good investing, 
 
Jim Rogers  
From Hot Commodities 
 
Editor’s Note: Jim Rogers became famous for founding one of the greatest performing hedge funds in history with George Soros, a hedge fund that made 4200% in a mere 10 years. He has been described as “the Indiana Jones of finance.”
 
He’s taught finance at Columbia University’s business school and he’s written three classic books on investing. The essay you just read was taken from Jim’s recently released book, Hot Commodities: How Anyone Can Invest Profitably in the World’s Best Market. 
 
You can order a copy of Hot Commodities HERE.


Jim lives in New York City with his wife, Paige Parker, and their daughter, who is learning Chinese and owns commodities but doesn’t own stocks or bonds. 


Ghost Empire

Screen shot 2013-06-07 at 3.29.17 PMDrought is a normal recurring feature of the climate in most parts of the world. It doesn’t get the attention of a tornado, hurricane or flood. Instead, it’s a slower and less obvious, a much quieter disaster creeping up on us unawares.

Climate change is currently warming many regions, overall warmer temperatures increase the frequency and intensity of heat waves and droughts. 

We can prepare for some climate change consequences with public education, water conservation programs, limiting pumping from our freshwater aquifers to recharge rates and putting in place early warning systems for extreme heat events.

Unfortunately some things cannot be prepared for…like the pervasiveness and persistence of a hundred year drought. 

The collapse of the world’s earliest known empire was because of drought.

The Akkadians of Mesopotamia forged the world’s first empire more than 4,300 years ago. The Akkad’s seized control of cities along the Euphrates River and swept up onto the plains to the north –

 in a short period of time their empire stretched 800 miles, all the way from the Persian Gulf to the headwaters of the Euphrates, through what is now Iraq, Syria and parts of southern Turkey. 

Tell Leilan was a small village founded by some of the world’s first farmers. It’s located in present day Syria and has existed for over 8,000 years. The Akkad’s conquered Tell Leilan around 2300 B.C. and the area became the breadbasket for the Akkadian empire.

After only a hundred years the Akkadian empire started to collapse. 

In 1978, Harvey Weiss, a Yale archaeologist, began excavating the city of Tell Leilan. Everywhere Weiss dug he encountered a layer of dirt that contained no signs of human habitation. This dirt layer corresponded to the years 2200 to 1900 B.C. – the time of Akkad’s fall. 

The Curse of Akkad

For the first time since cities were built and founded,

The great agricultural tracts produced no grain,

The inundated tracts produced no fish,

The irrigated orchards produced neither wine nor syrup,

The gathered clouds did not rain, the masgurum did not grow.

At that time, one shekel’s worth of oil was only one-half quart,

One shekel’s worth of grain was only one-half quart. . . .

These sold at such prices in the markets of all the cities!

He who slept on the roof, died on the roof,

He who slept in the house, had no burial,

People were flailing at themselves from hunger.

The events described in “The Curse of Akkad” were always thought to be fictional. But the evidence Weiss uncovered at Tell Leilan (along with elevated dust deposits in sea-cores collected off Oman) suggest that localized climate change – in Tell Leilan’s case a three hundred year drought,  desertification, was the major cause.  

“Since this is probably the first abrupt climate change in recorded history that caused major social upheaval. It raises some interesting questions about how volatile climate conditions can be and how well civilizations can adapt to abrupt crop failures.” Dr. Harvey Weiss, Yale University archeologist

Ghost Empire 

Perhaps the most notable empire decline due to drought, or altered precipitation patterns, was the Maya empire. At the peak of their glory the Maya ranged from Mexico’s Yucatán peninsula to Honduras. Some 60 Maya cities – each home to upwards of 70,000 people – sprang up across much of modern day Guatemala, Belize, and Mexico’s Yucatán Peninsula.

“The early Classic Maya period was unusually wet, wetter than the previous thousand years… Mayan systems were founded on those [high] rainfall patterns. They could not support themselves when patterns changed.” Douglas Kennett, an environmental anthropologist at Pennsylvania State University.

During the wettest centuries, from 440 to 660, Maya civilization flourished.

The ‘Big Dry’

Then precipitation patterns changed, the following centuries, to roughly 1000 A.D., did not treat the Mayas so kindly, they suffered repeatedly from drought, oftentimes extreme drought lasting a decade and more.

Between 1020 and 1100 the region suffered the longest dry spell in many millennia. The Maya’s suffered crop failure after failure, famine, death and eventually mass migration. 

“Yucatecan lake sediment cores … provide unambiguous evidence for a severe 200-year drought from AD 800 to 1000 … the most severe in the last 7,000 years … precisely at the time of the Maya Collapse.” Richardson Gill, The Great Maya Droughts

After 200 years, in just an eye-blink of time, famine and drought held sway… and most people walked away leaving behind a ghost empire. 

Drought Today

Currently the percentage of Earth’s land area stricken by serious drought is intensifying. Widespread drying has occurred over much of Europe, Asia, North and South America, Africa, and Australia.

“Desertification, along with climate change and the loss of biodiversity, were singled out as the greatest challenges to sustainable development at the 1992 Rio Earth Summit. Unfortunately, desertification, land degradation and drought (DLDD) have accelerated during the 20th and 21st centuries to date, posing fundamental problems and challenges for drylands populations, nations and regions in particular.

Severe land degradation is estimated to be affecting 168 countries around the world, according to a first-of-its-kind cost-benefit analysis (CBA) of the global effects of desertification released during the UNCCD Conference and Committee Meeting held this past April (April, 2013 – editor) in Bonn, Germany. That’s up sharply from 110 as of a previous analysis of data submitted by UNCCD parties in the mid-1990s.” Andrew Burger, ‘Global Warming is Real’

Screen shot 2013-06-07 at 3.21.07 PM

“In April 2013, short-term global drought conditions intensified on all continents except Antarctica with little relief worldwide. In North America, the intensification was seen in the Central and Southern Plains of the U.S. and down into central Mexico. In South America, drought conditions changed little with severe drought conditions remaining in eastern Brazil and along the leeward side of the Southern Andes. In Africa, drought intensified along the equator, especially in the eastern part of the continent and across Madagascar. In Europe, drought intensified across most of the central part of the continent. In Asia, drought continued to intensify in southern China and across Southeast Asia, as well as across southern Russia and northern Kazakhstan and Mongolia. In Australia, drought intensification occurred in many inland areas.” drought.gov

“Namibia, already the driest country in sub-Saharan Africa, is experiencing a severe drought, with some regions receiving the lowest seasonal rainfall in three decades.” June 3rd 2013, Newsday

“Australians are some of the world’s greatest energy consumers, and people in Perth use more water than any other city in Australia. Yet theirs is also the driest climate in the world, and Perth sits right on the edge of a vast desert. Perth sits above a vast ancient aquifer of 40,000-year-old water that has traditionally been the main source of drinking water. But in the mid 1970s there was a dramatic shift in climate that resulted in a decline of between 15% and 20% in winter rainfall. The combination of rising temperatures and a lack of wet winters has meant a steady decline in water levels in the aquifer and they are not being recharged. By the mid 1990s, scientists realized they were facing more than a prolonged drought, that this was in fact climate change.” News.bbc.co.uk

Conclusion

As the earth warms some regions will get wetter, many much drier.

Climate change, global warming, drought and desertification. What’s happening in your particular region should be on your radar screen. Is it?

If not, it should be.

Richard (Rick) Mills

rick@aheadoftheherd.com

www.aheadoftheherd.com

Richard is the owner of Aheadoftheherd.com and invests in the junior resource/bio-tech sectors. His articles have been published on over 400 websites, including: 

WallStreetJournal, USAToday, NationalPost, Lewrockwell, MontrealGazette, VancouverSun, CBSnews, HuffingtonPost, Londonthenews, Wealthwire, CalgaryHerald, Forbes, Dallasnews, SGTreport, Vantagewire, Indiatimes, ninemsn, ibtimes, businessweek.com and the Association of Mining Analysts.

If you’re interested in learning more about the junior resource and bio-med sectors, and quality individual company’s within these sectors, please come and visit us at www.aheadoftheherd.com

***


Legal Notice / Disclaimer

This document is not and should not be construed as an offer to sell or the solicitation of an offer to purchase or subscribe for any investment.

Richard Mills has based this document on information obtained from sources he believes to be reliable but which has not been independently verified. 

Richard Mills makes no guarantee, representation or warranty and accepts no responsibility or liability as to its accuracy or completeness. Expressions of opinion are those of Richard Mills only and are subject to change without notice. Richard Mills assumes no warranty, liability or guarantee for the current relevance, correctness or completeness of any information provided within this Report and will not be held liable for the consequence of reliance upon any opinion or statement contained herein or any omission. 

Furthermore, I, Richard Mills, assume no liability for any direct or indirect loss or damage or, in particular, for lost profit, which you may incur as a result of the use and existence of the information provided within this Report.