
Energy & Commodities
Jim Rogers has been bullish on agriculture for years now. He stated during an interview with the Economic Times in 2009:
Ten years from now, it may be farmers who will drive the Lamborghinis and the stock brokers will drive tractors or taxis at best.
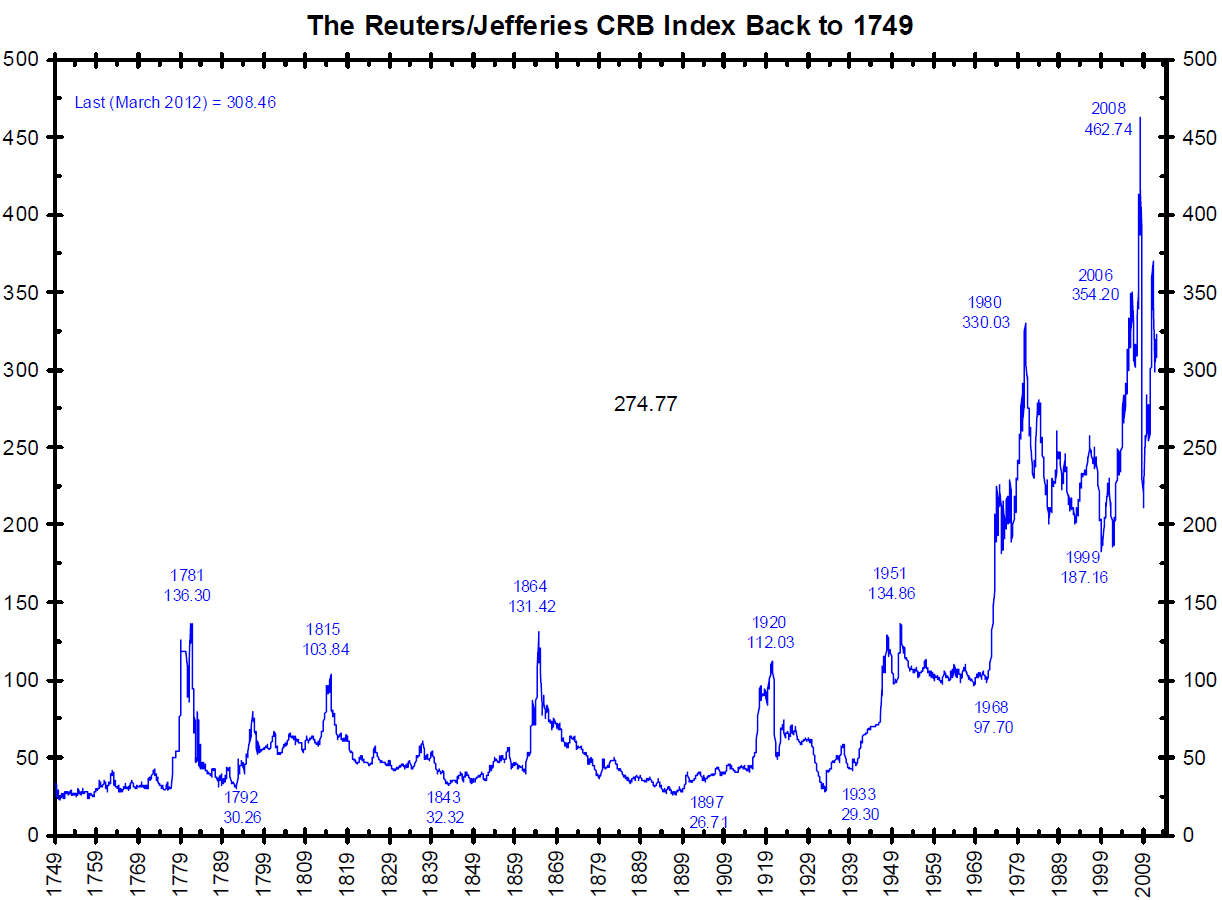
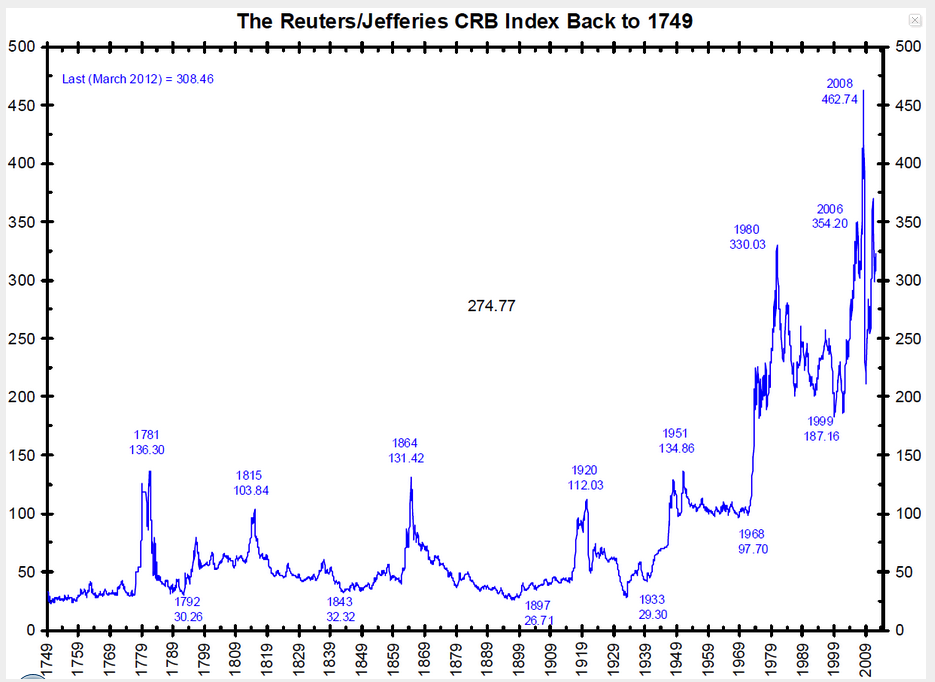
In order to get into his mind, one first needs to understand the mechanisms driving the commodities market, which is really the “real assets” market that includes agriculture, a very long term chart is in order. Here s one of the CRB interpolated from 1749 to the present.
….click HERE to enlarge this chart and read the rest of this detailed Historical article.
What’s happening here needs a bit of explanation. It would seem, from 1749 until 1968, the general nature of real asset prices is that they skirt along their floor with periodic spikes. We have long periods of stable prices from 1749-1779, 1789-1812, 1816-1861, and 1870-1914. After 1914 until 1952 things start going a little haywire, and the final stable period is between 1955 or so until 1968. After that, there is no longer such a thing is commodity price stability. Forget it.
If we look at the spikes and remember what was going on during those times, things start to make some sense. 1781 was the peak of the Revolutionary War Continental Dollar printing. 1815 marked the end of the War of 1812, marred by periodic national suspensions of specie payments for paper dollars, allowing banks to inflate the paper money supply during that time to finance the war. 1864 was, obviously, the Civil War, again financed by paper money called Greenbacks, America’s first relatively long experiment in fiat money. 1914-1920 is the World War I money printing, but more importantly, the founding of the Federal Reserve System which centralizes the money printing business and perhaps causes the Great Depression, among other things. In 1933, with commodities bottoming out, FDR confiscates all gold in the country and devalues it, enabling the Fed to print even more and inflate asset prices. World War II and the Korean War push up prices further, but the international link of the dollar to gold is still alive.
In 1968, it breaks down. With the Nixon administration printing dollars to finance the Vietnam War, foreigners begin cashing them in for gold. To stop a gold run, Nixon tries to create a fake gold market between central banks and ignore the free gold market everywhere else. This was called the “two tier gold market” that lasted from 1968 until 1971. After that, it was over. The dollar lost all definition, and real asset prices haven’t even had a short period of stability since then.
So we see, during periods of massive money printing, real asset prices always go up. The reason they go back down afterwards is that periods of money printing have historically been followed by periods of deflation, but this was only because, throughout the centuries, the dollar-gold anchor was always eventually restored. This time it doesn’t exist. This time, real asset prices will just keep going up in dollar terms.
Be that as it may, the reason Jim Rogers likes to focus on agriculture is that the statistics with agriculture are surprisingly shocking. According to the National Crime Records Bureau [NCRB], there were 17,368 Indian farmer suicides in 2009 alone. While farming may not have been the sole cause that attributes to such a sad statistic, the fact is that agriculture has been a horrible business for decades. It is not my intention to sound gloomy about this, but when one considers the cost of seeds and the labor involved, many farmers are literally working themselves to financial death because they simply can’t make a living. Additionally, with the average age of a farmer at 55, the supply of farmers is going down. They are getting older with few young replacements. And if this trend continues, we may not have enough food to go around and prices are going to have to rise higher than they are already.
Rogers, to my knowledge, is not long agricultural or commodity stocks, but rather commodities themselves. He’s said this before about gold miners, which he does not invest in. It stands to reason he would not be long agricultural stocks either. It’s Wall Street Trends 101 that says that stocks and commodities bull markets run inversely. However, this is true mainly for consumer goods industries rather than capital goods industries. For example, when wheat is expensive, so goes the theory, General Mills’ (GIS) profit margins on its cereals will tend to contract, and the company will lose revenue. For capital goods stocks however, it stands to reason that companies supplying the agriculture industry, rather than retailing off of it, will boom along with agricultural prices. So, for example, Deere and Company (DE) will sell more farm equipment to farmers who will make more money when agricultural commodities start getting more expensive.
Despite the logic of this theory, one needs to have quite a strong stomach to be long capital goods industries at this time. If you thought being long the general market was tough in 2008, take a look at a comparison graph between DE and SPY.

…click HERE to enlarge this chart and read the rest of this detailed Historical article.
This extreme volatility can be correlated to the liquid money supply [MZM] fluctuations. Take a look at the long term chart of DE compared to the MZM, or liquid money supply in the economy along the same time period.
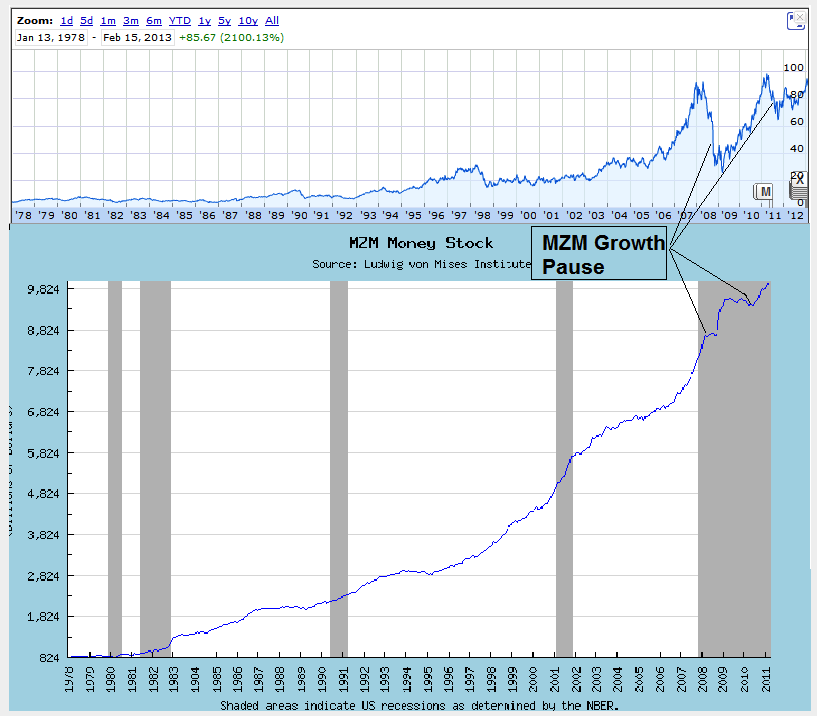
…click HERE to enlarge this chart and read the rest of this detailed Historical article.
Since Deere is at the very top of the structure of production, meaning capital goods as opposed to consumer goods which are at the bottom, liquid money supply moves to the top first, as interest rates are pushed down and long term investment projects are taken up, which require capital goods first and foremost. The problem is, once the Fed stops printing even for a few months after a long stretch of MZM increases, the boom cannot be sustained, and capital goods stocks fall rapidly. At the beginning of 2008, MZM growth clearly flat-lined for close to a year after a huge burst of growth starting in 1995 from $2.8T to nearly $8.8T, an increase of 214% in 13 years. With all the money from capital goods industries being supplied by the Fed suddenly drying up in 2008, the bubble deflated fast. Then the printing presses were fired up once again, and it resumed. As long as the Fed continues, holders of Deere and companies at the forefront of the structure of production will keep being first in line to receive the new Fed money. The minute he stops, DE shareholders will suffer.
But this is not investing. This is just playing a game of chicken with the Fed. If you want to do it, go ahead. I’m not touching it with a ten foot pole. Instead of stocks like Deere, the safest way to play the agriculture game besides investing in farmland straight-up is agriculture futures ETF’s like DBA or, in honor of Rogers, RJA, an ETN that replicates the performance of the Rogers International Commodities Index. These are not for trading. Just look at the tail end of the 1749-present graph of the CRB. Don’t even try. They are for buying and waiting while shielding oneself from price inflation. We have seen that from 1749 until today, every time the government prints money, commodities skyrocket. It used to only be during war time. Now it’s just constant. It is heads you win, tails you win. Either the global economy will pick up, in which case there will be shortages and commodities will rise, or they will print money, in which case commodities will rise. This is already reaching epidemic proportions, as reports are multiplying now about the G20 “denying currency wars” meaning, money printing competitions. When all governments deny it, that’s when we know it’s definitely happening.
There may be one more way to play this, but only with leftover cash, nothing big. During my search, I came across a microcap that may have the business idea to benefit from real asset gains in agriculture while avoiding the gyrations of printing press manipulation at the capital goods level. Terra Tech Corp.,(TRTC.OB) is attacking a new niche, urban farmers, basically connecting capital goods directly with end consumers and “sowing together” the beginning and end phases of the structure of production. These are horticulturists who live in the city or suburbs and want to grow their own food and gain independence from Big Ag. Terra Tech has been expanding recently, thinning its already thin balance sheet and hammering its stock price, which already comes with fairly large speculative dangers. But when agriculture prices do start to climb, this market will inevitably expand as people may try to save money by growing food at home, which will save massively on transportation costs and increase supply.
In New York City for example, a new trend is slowly spreading where tenants grow food on their roofs and balconies, and Terra Tech sells the hardware for this. When farmers get richer and demand for MBA’s dwindles, people in urban areas are going to start flocking to farms. Urban areas are pretty crowded, but they are seriously lacking in food, which is almost all imported.
Only time will tell if Terra has the right idea. The next few quarters will be crucial, and will show if it can grow its revenues, which only started flowing in at the beginning of last year.
About Tal Ben-Ami
Holds an MBA in economics from TAU – Doctoral student.

Which one is right?
On Friday China reported its trade numbers. They were good. And they seemed to do nothing but instill confidence in China’s economy recovery.
So you would expect a certain reaction from assets most closely ties to China’s economy. I immediately think copper.
Indeed, copper imports into China did grow notably in January.
If we consider Friday’s copper price action only, right after the news was released, the response was good. But the rally was more than erased yesterday. I didn’t see any new catalyst that would have driven copper lower, so I can only think it should fall into the category “adverse price action relative to the news.”

The uptrend in copper is intact for now, but the momentum is waning a bit and in the long- term one could make the case for a deep decline should this adverse price action continue and its uptrend channel be violated. The weekly consolidation is currently bullish, but just barely – a breakdown could happen quickly if this five-wave consolidation pattern resolves itself to the downside as it suggests:

It’s also worth noting that China’s imports of crude oil were strong. Unlike copper, crude oil did well yesterday:

And I imagine that move really hit a lot of new crude oil bears hard. But should this be reassuring for the crude oil bulls out there?
Among the growing population expecting the recent US stock market strength to hit a temporary stopping point, crude oil is also expected to take a breather. I’ll agree. But crude isn’t going to break when so many are expecting it to; it’ll shake out a whole lot of bears before it turns lower.
But I do think that turn is coming soon, both for crude oil and stocks. In my Commodities Essential newsletter last week I talked about why. Here is a short summary with updated charts …
A look at the NYSE Bullish Percent Index suggests stocks are overbought and near a substantial turning point. The index peaked out at or above 70 twice last year. Those peaks coincided with substantial corrections:

And there’s another item I find useful, particularly to help identify turning points: the CFTC’s weekly Commitment of Traders (COT) report.
The COT report shows the open interest and the net long/short positioning broken down by three investor categories – small speculators, large speculators, and commercials – in a particular futures contract.
I look specifically for relative extremes in positioning among the small and large speculators. When speculative positioning reaches extremes, the speculators tend to be wrong about the future direction of prices. Thus, these extremes suggest greater potential for a turnaround … for a playable correction.
Here is a chart showing the weekly COT data for the S&P 500 futures going back one year:

This chart suggests speculative positioning has reached an extreme that will induce a steep, playable correction at least.
Of course, timing is critical as these are weekly figures that can persist even after reaching lopsided levels. The latest data shows large speculators already beginning to dump long positions. Will this create a feedback loop of selling? Or will this rally reach higher before a real correction materializes?
Either way, I think we are very close to a substantial pullback in risk appetite.
I think crude oil will be the commodity most tied to a risk asset sell-off. Copper may be dragged down as well, but I don’t expect copper to perform as poorly as crude oil unless some key support levels are first taken out. In fact, the Commitment of Traders data on crude oil suggests a turning point is not far (just as the S&P 500 COT data does):

It seems there are two ways a trader/investor could be leaning right now:
Way #1: Risk On. There will be a continued melt-up in risk assets on the premise of continued money printing and recovery in key global economies
Way #2: Risk Off. At least a substantial correction is due, but poor price action could quickly morph into something uglier than a correction as the merit of money printing, unmanageable debt and economic recovery are undermined by renewed deflation expectations.
I suppose there is some middle ground. But I think there are too many leaning towards way #1. As such, I am beginning to lean towards way #2.
There may be a few more weeks of upside. We may need to see a real blow-off in risk appetite before any correction materializes.
But the higher we go from here, the harder we fall. (At least that’s what they say!) I say watch crude.
- JR Crooks
- Black Swan Capital
- www.blackswantrading.com
Condensate is making uneconomic gas wells profitable for producers in the shale basins of northern BC and Alberta, and creating some great investment opportunities for informed investors.
The Shale Revolution has transformed America’s energy scene. After decades of decline, US oil production is again on the rise. The turnaround has been even more dramatic on the natural gas front: shale wealth has transformed the country from an importer to an exporter and pushed prices to historic lows.
Eagle Ford producers drilled their wells looking for oil or gas. Condensate was an unexpected bonus – but it now makes up as much as 40% of the hydrocarbons produced from the formation.
Since it is produced alongside oil and since it is in fact oil, producers lump condensate with oil when reporting production volumes. As a result, it seems like US oil production is shooting through the roof. But while domestic output is certainly rising, lumping condensate in with crude is misleading because not every hydrocarbon molecule is created equal – especially through the eyes of a refinery.
What Is This “Freak of Nature” Gas Play?
And in this new briefing, I take you through, point by point, why I think this one natural gas stock, a pure play on gas, could be the single best trade in the sector – junior, intermediate or senior.
Keep reading here to learn more…
The refineries can handle shale oil. They cannot, however, handle much condensate.

From Houston, the condensate from Kinder’s line moves through the company’s Explorer pipeline to Hammond, Illinois.
Condensate capacity from the US to Canada should increase dramatically—but it is over a year away. Oil and gas marketers in Alberta tell me oilsands production is rising fast enough to use a lot more condensate—but only time will tell if the market stays in balance, over-supplied, or under-supplied.
– Keith
Before there were refrigerators folks kept drinks cool by putting them into clay jars that had been soaked in water. The evaporation of the water from the clay cooled the container and its contents, which today includes wine bottles. On the other hand, for many years artisans have taken clay in a slightly different form, shaped it and baked it and provided the teacups which keep the liquid inside until we drink it.
Two different forms of the same basic geological material, with two different behaviors and uses. Why bring this up? Well there is a growing series of articles which continue to laud the volumes of oil and natural gas that the world can expect from the artificial fracturing of the layers of shale in which these hydrocarbons have been trapped for the past few million years. It has been suggested that there is no difference between this “unconventional” oil and the “conventional” oil that has been produced over the past century to power the global economy. And yet, despite the scientific detail which some of these critics discuss other issues, they seem unable to grasp the relatively simple geologic and temporal facts that make the reserves in such locations as the Marcellus Shale of Pennsylvania and the Bakken of North Dakota both unconventional and temporally transient. Let me therefore try again to explain why, despite the fact that the oil itself may be relatively similar, the recovery and economics of that oil are quite different from those involved in extracting conventional deposits.
But, before getting to that, let’s first look at the current situation in North Dakota, using the information from the Department of Mineral Resources (DMR). According to theJanuary Director’s Cut the rig count in the state has varied from 188 in October, through 186 in November, and 184 in December, to 181 at the time of the report. Why is this number important? Well, as I will explain in more detail later, the decline rate of an individual well in the region is very high, and thus the industry has to continue to drill wells at a rapid rate, just to replace the decline. (This is the “Red Queen” scenario that Rune Likvern has explained so well.) The DMR recognize this by showing the effect of several different scenarios as the number of rigs changes.
For example they project that 170 rigs will be able to drill around 2,000 wells a year. At that level, and with some assumptions about the productivity of individual wells that I am not going to address here, but which Rune discussed. I would, however, suggest that it is irrational to expect that new wells will continue to sustain existing first year levels as the wells move away from formation sweet spots. Yet, accepting their assumptions for now, DMR project that the 170 rigs will generate the following production from the state:

……read more HERE
The major oil fields are in decline and there haven’t been many new mines opened.In agriculture, the average age of a farmer in the U.S. is 58, and 66 in Japan. “We’re running out of farmers,”I want to own real assets. I want to invest in companies that produce real goods. Shortages are getting worse, not better.”
On the Dollar – The Dollar is not a safe haven but People will flock to it
All of Jim Rogers comments HERE


-
I know Mike is a very solid investor and respect his opinions very much. So if he says pay attention to this or that - I will.
~ Dale G.
-
I've started managing my own investments so view Michael's site as a one-stop shop from which to get information and perspectives.
~ Dave E.
-
Michael offers easy reading, honest, common sense information that anyone can use in a practical manner.
~ der_al.
-
A sane voice in a scrambled investment world.
~ Ed R.
Inside Edge Pro Contributors

Greg Weldon

Josef Schachter

Tyler Bollhorn

Ryan Irvine

Paul Beattie

Martin Straith

Patrick Ceresna

Mark Leibovit

James Thorne

Victor Adair