
Energy & Commodities

The State of New York is moving to evict its largest internet and cable provider for failing to deliver on fast connection promises that had won it approval two years ago for a merger with Time Warner Cable.
The deal was that rural areas would get high-speed internet access as a result of the merger, but the company—Spectrum (of Charter Communications)—didn’t make it happen on time…. CLICK for the complete article

 Big oil is back, and we have earnings today but so is big LNG. OK, maybe the market for Liquefied Natural gas isn’t big yet but it is going to be. President Donald Trump boasted that “Europe will be a massive buyer of U.S. LNG as they will be able to diversify their energy supply.” Some dismissed the comments as not likely, but those who did are thinking small or not looking at the big picture. In coming generations, the United States will be the LNG supplier to the world.
On Mornings with Maria on the Fox Business Network, Energy Secretary Rick Perry spoke from the opening of the Dominion Energy Cove Point (DECP) LNG Liquefaction project. He pointed out that this was the opening of just the second LNG facility and that there will be four more on the way.
He pointed to phenomenal growth in the industry and pointed out that Europe needs U.S. natural gas as a strategic alternative to Russia. He also set a veiled shot to Europe by saying that Carbon Emissions in the United States fell by 14% because of U.S. natural gas usage even as Trump pulled out of the Paris Climate Accord. He also pointed out that we havephenomenal growth in production. Rick Perry with Maria from Dominion Energy Cove Point (DECP) LNG Liquefaction project points out that the United States will be a reliable supplier. Russia halted Natural gas exports as a political weapon in the past, so Europe is making a smart move getting ready to be a big buyer of U.S. LNG.
The EIA reported that working gas in storage was 2,273 Bcf as of Friday, July 20, 2018, according to EIA estimates. This represents a net increase of 24 Bcf from the previous week. Stocks were 705 Bcf less than last year at this time and 557 Bcf below the five-year average of 2,830 Bcf. At 2,273 Bcf, total working gas is within the five-year historical range. Tight range and needs more heat to keep the rally going. Use strength to buy long-term puts.
Look to RBOB for oil support. There seems to be a squeeze on RBOB as we head into expiration with near record demand and supplies are getting too close to the 10 year average.

About the Author

Senior energy analyst at The PRICE Futures Group and a Fox Business Network contributor Phil Flynn is one of the world’s leading market analysts, providing individual investors, professional traders, and institutions with up-to-the-minute investment and risk management insight into global petroleum, gasoline, and energy markets. His precise and timely forecasts have come to be in great demand by industry and media worldwide and his impressive career goes back almost three decades, gaining attention with his market calls and energetic personality as writer of The Energy Report. You can contact Phil by phone at (888) 264-5665 or by email at pflynn@pricegroup.com. Learn even more on our website at www.pricegroup.com.

Recent days were good for oil bulls. Thanks to their action, the price of the commodity came back to around $70 and one of the daily indicators even generated a buy signal. Did the outlook turn to bullish? In our opinion, it didn’t. Furthermore, it seems that a fresh July low is still ahead of us. Why? The answer is quite simple – an analogy to the past.
Let’s take a closer look at the charts below (charts courtesy of http://stockcharts.com).
Technical Picture of Crude Oil
Click Chart For Larger Image
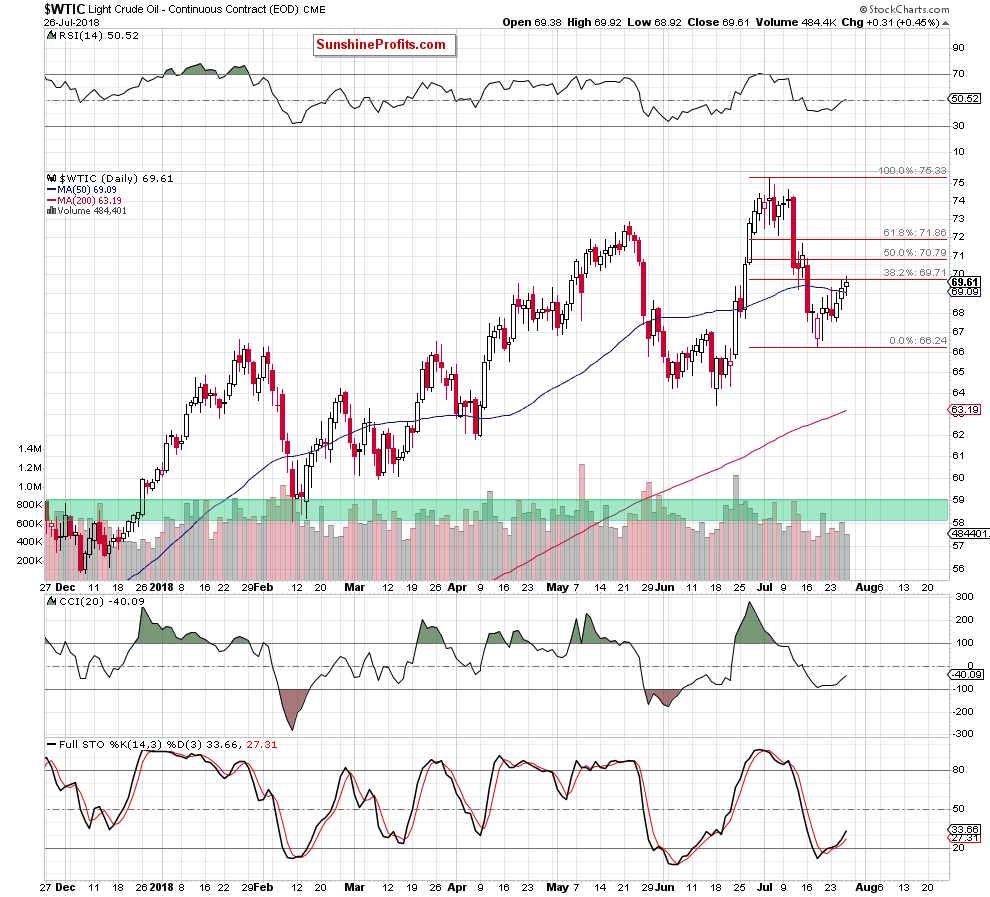
Looking at the above chart, we could summarize it with only three words: nothing has changed. Why? Because although crude oil increased a bit, it is still trading under the 38.2% Fibonacci retracement.
Nevertheless, if we draw a few additional lines on this chart, mark technical formations invisible at first glance with their ranges and compare the current situation to something that we have already seen in the past, our chart will become much more interesting. See for yourself.
Click Chart For Larger Image
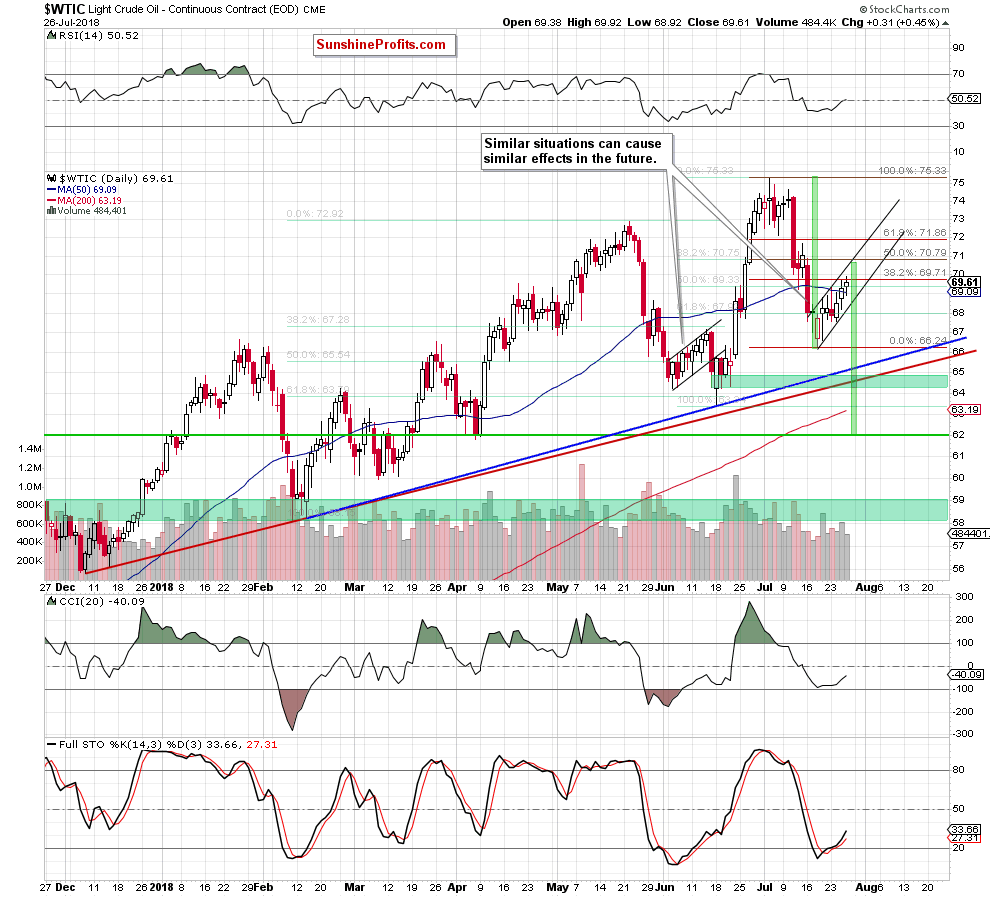
Were we right? We hope that the answer is yes. So, what can we read from the above chart about the future of black gold?
From this perspective, we clearly see that crude oil is trading inside a very short-term black rising trend channel, which reached the mentioned 38.2% Fibonacci retracement during yesterday’s session for the second time in a row.
What does it mean for the price of light crude?
Let’s start with a quote from yesterday’s alert:
(…) Despite this climb, this first resistance triggered a pullback, which suggests that as long as it remains in the cards higher prices of black gold are not likely to be seen and one more move to the downside should not surprise us in the coming days.
Is this quote still valid? Definitely yes.
Additionally, yesterday’s upswing materialized on the smallest volume since July 18 (the beginning of the current rebound), which raises some concerns about the strength and condition of oil bulls – especially when we factor in another unsuccessful attempt to go above the 38.2% retracement.
Since we have already mentioned the very short-term black rising trend channel, let’s analyze it more closely. As you see on the daily chart, although crude oil extended its rebound in recent days, it is still trading inside this formation, which means that as long as there is no breakout above the upper line of the channel, further improvement is questionable.
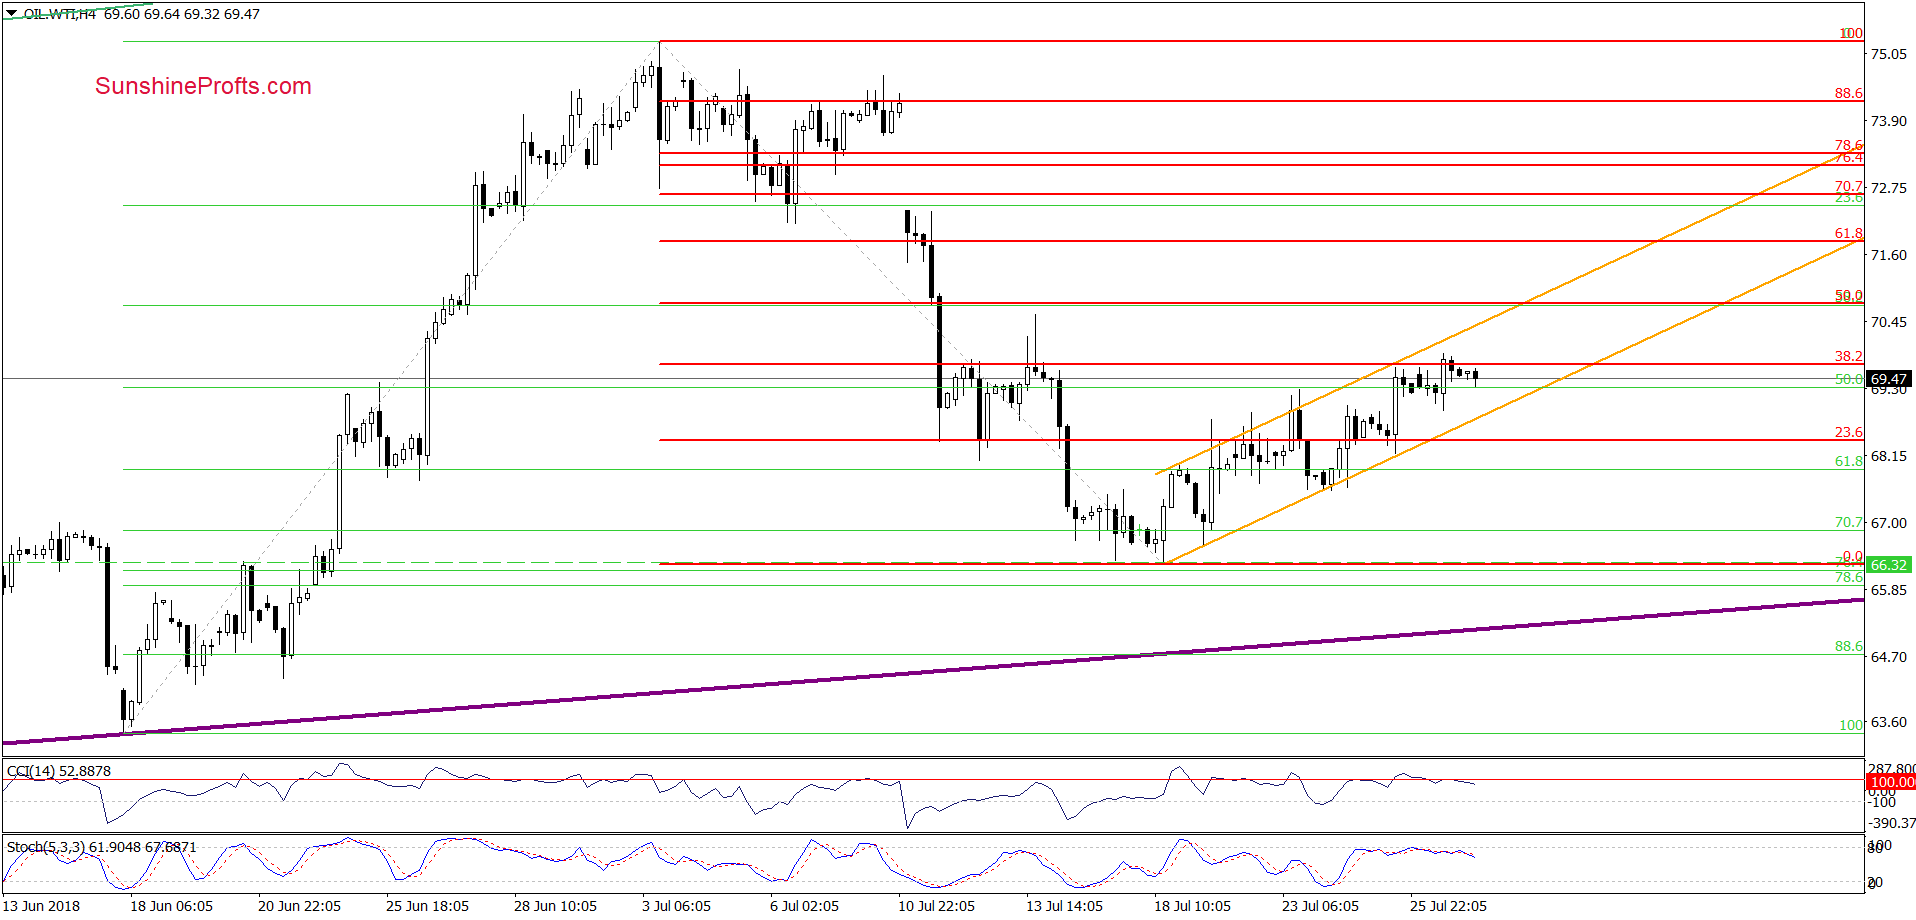
At this point it is worth noting that we saw several unsuccessful breakouts in the narrower perspective. Let’s take a look at the 4-hour chart below.
Click Chart For Larger Image
As you see, although oil bulls pushed the price above the upper border of the channel in previous days, all these improvements were very temporary, which means that their opponents kept an eye on this important line.
Additionally, earlier today, the CCI and the Stochastic Oscillator generated the sell signals, increasing the likelihood of lower prices later in the day.
However, before we start talking about the downside targets, let’s go back to our technical formation and its implications.
Potential Flag Formation Underway
On the daily chart, we see that entire July price action looks like a potential flag formation. The pattern started with a short-lived consolidation, then accelerated sharply on July 11 (that day the buyers had to cover their long-positions to avoid losses as more sellers came in off the fence) and rebounded slightly only to fall even lower in the following days.
In this way, oil bears formed the flagpole (marked with the first green rectangle), which is currently followed by an orderly rebound (the mentioned very short-term black rising trend channel), which forms the flag.
That sounds interesting, but what does this mean for oil?
For those who do not know yet, we explain that flags are continuation patterns. This means that if oil bears show their claws once again and manage to break below the lower border of the very short-term black trend channel, the next leg of the downside trend will begin, and we’ll see lower prices of crude oil.
What will be the initial downside target of the mentioned flag pattern?
Those of you who are interested in commodity/financial markets probably heard the idea that “the flag flutters in the middle of the flagpole”, which means to us that it occurs in the middle of the entire downward move. Therefore, to predict the forecast price level we should measure the size of the flag pole (we marked it with the first green rectangle) and then subtract it from the top of the flag.
Thanks to this method we see that crude oil could decline as far as to around $62 (the second green rectangle) to complete the whole formation. In this area, there is also the support zone created by April lows, which could attract oil bears like a magnet.
Nevertheless, to see black gold at this level, the sellers will have to break under the blue and red rising support lines (lower borders of the rising trend channels seen on the daily chart attached in yesterday’s alert) and the green support zone based not only on these lines, but also on June’s lows, which may not be a very easy challenge.
Why? At this point, the time has finally come to go back to the past.
Looking at the daily chart, we see that a similar price action to the one we are currently observing took place in the first half of June. Back then, the price of crude oil also bounced north (moving in a similar growth channel) after quite strong declines, and then fell to a fresh low. Despite that price action, oil bears didn’t manage to trigger further deterioration as the proximity to the red support line and the 61.8% retracement encouraged their opponents to act.
Taking the above into account, we believe that even if the sellers do not manage to push the commodity to around $62, we’ll see (at least) a fresh July low and a test of the nearest support zone (marked with green) in the coming week.
Long-term Factors
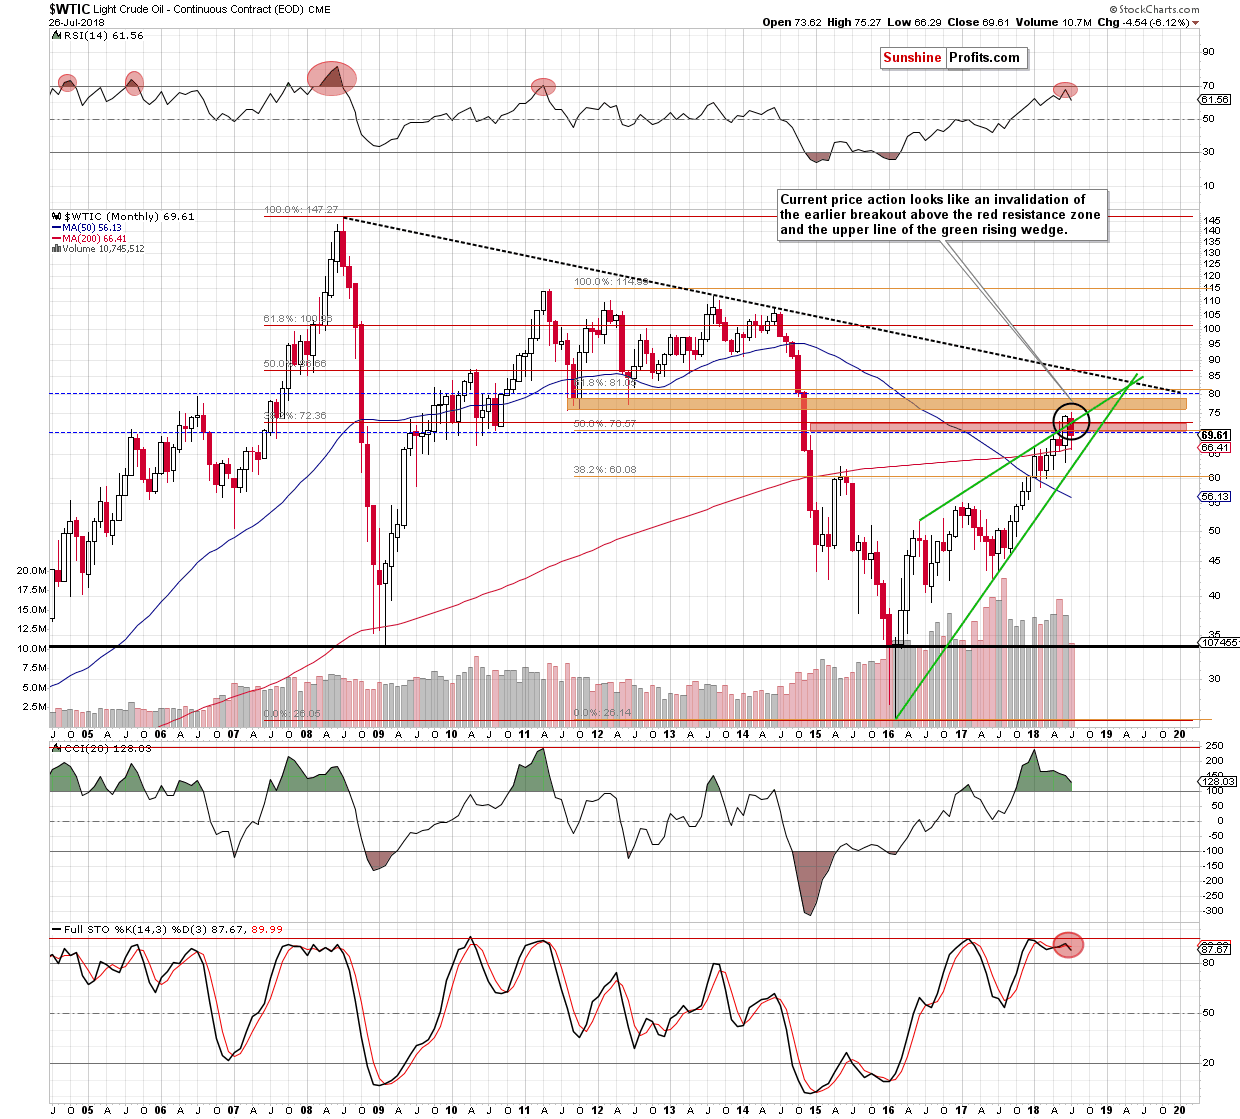
The pro-bearish scenario is also reinforced by two important negative developments seen more clearly from the broader perspective. Let’s examine the monthly chart below to find out what we mean by that.
Click Chart For Larger Image
Looking at the above chart, we see that although crude oil bounced off the 200-month moving average earlier this month, the commodity remains under the previously-broken red resistance zone (created by the two important Fibonacci retracements) and the upper border of the green rising wedge.
This means that an invalidation of the earlier breakouts and its negative impact on the price of light crude are still in effect, suggesting that if we see a monthly close below the mentioned resistances oil bears will get one more important reason to push black gold lower in the coming month(s).
In our Wednesday Oil Trading Alert, we also focused on the relationship between crude oil and the general stock market. Has anything changed since then?
Crude Oil – General Stock Market Link
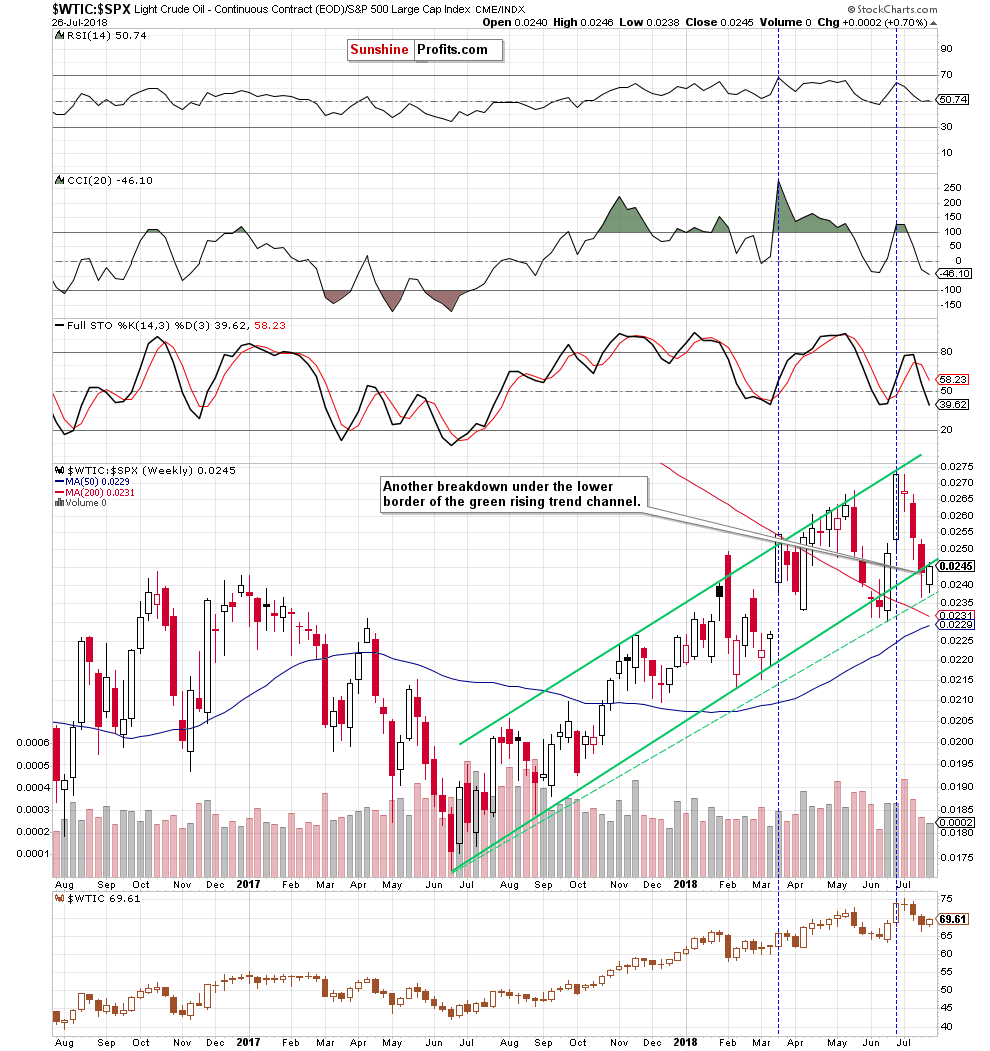
Click Chart For Larger Image
Not really, because although the oil-to-stocks ratio rebounded, it still remains under the previously-broken lower border of the green rising trend channel, which looks like a verification of the earlier breakdown.
Therefore, if the situation develops in tune with our assumptions and the ratio declines once again, we’ll likely also see lower prices of crude oil in the following days as a strong positive correlation between the commodity and the ratio is still in the cards. The pro-bearish scenario is also reinforced by the position of the indicators as the sell signals generated by the CCI and the Stochastic Oscillator continue to support the sellers.
Summing up, profitable short positions continue to be justified from the risk/reward perspective as the short-term outlook remains bearish (two unsuccessful attempts to break above the 38.2% Fibonacci retracement, a potential flag formation, similarity to the past, a potential invalidation of the breakouts seen from the long-term perspective, current situation in the oil-to-stocks ratio), favoring oil bears and lower prices of crude oil in the coming week(s).
If you enjoyed the above analysis and would like to receive daily premium follow-ups, we encourage you to sign up for our Oil Trading Alerts. Sign me up.
Thank you.
Nadia Simmons
Forex & Oil Trading Strategist
Przemyslaw Radomski, CFA
Founder, Editor-in-chief, Gold & Silver Fund Manager
Oil markets have shown tremendous weakness in recent days, losing nearly seven dollars before rallying back a bit on Thursday.

What’s causing it? Market analysts have been struggling to find a single reason for it, preferring to cite a cocktail of negative news and rumor to explain the downdraft.
There have been reports of increased Saudi production to Asian customers, which many cite as a breaking of the dam of OPEC production guidelines – a break that would have many in the oil world in full panic mode.
But I don’t see these promises as a collapse inside the cartel. The Asian contracts are merely adding stability to the oil markets in front of the threats of renewed U.S. sanctions on Iran. It’s been made clear that the Iranians won’t stand for any production increases that are over and above the agreed upon increases at their Vienna meeting last month – and equally clear that the Saudis don’t want to put that production agreement in jeopardy either.
Many analysts are pointing to the reopening of Libyan oil ports to explain the quick drop in oil prices.
But I also don’t find this explanation very compelling either: Even with these newly cleared impasses, Libyan exports are only marginally increasing, and most experts believe that Libyan production will continue to slide downwards through the rest of 2018. Others have cited the threat of slowing oil demand from China, but these predictions of slowing Chinese growth are as frequent, and usually as wrong, as dandelions growing in an open field.
I am a student of the financial players and their influence into oil prices, and generally look at the movement of speculative money in and out of the futures markets. But even here there hasn’t been a discernible reason for oil’s latest drop. According to the COT reports, long positions have actually held fairly steadily through this latest 7 dollar downdraft in oil.
So – WHAT IS IT? Despite the varied answers that are appearing in the media for oil’s recent drop, I can find only one convincing reason that oil is recently acting poorly despite being one of the most fundamentally bullish oil markets I have seen in my 35 years trading it…
Trump’s trade war.
Commodities are different than stocks. They are time-sensitive instruments that regenerate and self-destruct every month. Current September commodity futures contracts don’t care where the markets will be in 6 months. They only care about their price prospects on the day they expire – the 28th of August. Because of this, they are far more sensitive to current threats than stocks and have been responding to the disastrous economic threat of a continuing trade war between the US and China (and our allies).
Corn is down. Soybeans are getting pummeled. Doctor Copper is giving us a nasty prognosis; Industrial metals like Zinc, Tin and Platinum are down anywhere from 15-35 percent.
Oil, for most of the run-up to US tariffs starting in late May, has strongly bucked this general commodity collapse – proving again just how fundamentally strong it is – but even that fundamental strength is no match for the destructive economic force of a global trade war.
It’s difficult to know what to say or do about this, if you’re an investor in commodity-reliant stocks. Heck, it’s tough if you’re an investor in anything, as the economic ill-effects of an expanding trade war will reach far beyond the commodity sector at some point.
Recently, there have been signs that Congress, and specifically the Republican party, are willing to break with the President on this self-destructive path towards ratcheting tariffs and reciprocal penalties. They’ve called on Treasury Secretary Mnuchin to answer questions about the legality and exit strategy of tariffs, and various Congressional leaders have been suggesting legislation to put a stop to it.
There has been a general belief that the Trump trade war will have to be abandoned at some point, as markets outside the commodity sphere begin to respond. When consumer prices begin to sharply increase, and jobs begin to be lost, most believe the President’s political needs will intersect with his self-destructive tariffs.But until that happens, it’s difficult to continue to recommend oil or other commodity stocks. It’s even more difficult to predict when the green light to buy them will return. Nothing has been as tough to forecast as the plans of President Trump’s administration.

Tesla might have set the rules of the road when it comes to electric car manufacturing, but this monarchy isn’t going to last forever. There are plenty of challengers to the EV throne, and by 2021, according to new research from PA Consulting, Tesla will only be in 7th place…. CLICK for the complete article

-
I know Mike is a very solid investor and respect his opinions very much. So if he says pay attention to this or that - I will.
~ Dale G.
-
I've started managing my own investments so view Michael's site as a one-stop shop from which to get information and perspectives.
~ Dave E.
-
Michael offers easy reading, honest, common sense information that anyone can use in a practical manner.
~ der_al.
-
A sane voice in a scrambled investment world.
~ Ed R.
Inside Edge Pro Contributors

Greg Weldon

Josef Schachter

Tyler Bollhorn

Ryan Irvine

Paul Beattie

Martin Straith

Patrick Ceresna

Mark Leibovit

James Thorne

Victor Adair