Energy & Commodities

Oil Investors Look To Utah For Long-Term Riches

a5759d218e9ca8bc6f68afb0c6ffde8cThe rise in oil prices has resulted in relentless drilling and booming production in the U.S. shale plays, and the Permian in West Texas is attracting the most drillers, analysts, and media attention.

But some bold wildcatters—encouraged by the higher oil prices—have set their sights on projects to squeeze oil out of the rocks in Utah, where lead times are much longer and costs are higher. But oil production can be sustained for decades, bringing in potential vast profits to those who manage to start and keep up production from the sands in Utah—the state holding the largest oil sands resources in the United States.

According to the Utah Geological Survey, the state’s oil sand deposits contain 14 to 15 billion barrels of measured oil in place, and bitumen can be seen “bleeding” in some places like the Navajo Sandstone in the Whiterocks deposit in the Uinta Basin.

.…continue reading HERE

The Silver & Platinum Express

Bob Moriarty of 321 Gold discusses the relative prices of gold, silver and platinum and highlights two exploration companies, one with platinum and one with silver.

platinumbarsstacked630

I’ve written about both Group Ten Metals (PGE-V) and Metallic Minerals (MMG-V) before. I’m going to group the two companies in one piece today for a number of reasons. The companies share management. One, Group Ten Metals Inc. (PGE:TSX.V; PGEZF:OTC), is a platinum/palladium company. The other, Metallic Minerals Corp. (MMG:TSX.V), is oriented toward silver in the Keno Hill silver district.

Inflation is directly responsible for the price increase of everything. That doesn’t mean that all commodities or financial instruments go up in unison, they don’t. But soybeans or silver are not inherently more valuable today than they were a hundred years ago. What has changed is the value of the dollar, not the commodity. Markets search constantly for the correct price. That is why prices go up and prices go down. The market never quite knows what is the right price for anything so it searches until buyers and sellers are satisfied with price and make a transaction.

Human behavior causes distortions in price between commodities. It’s like dancing. Sometimes you lead. Sometimes you follow. An astute investor can profit when the price of one commodity in comparison to another deviates from the mean. We can be assured that eventually price will regress to the mean. Understanding how deviation from the mean and the ultimate regression to the mean allows savvy punters to speculate on the price difference between two commodities without the need to place a bet on the direction of price for either. I explain all of this at length in Nobody Knows Anything.

Over the past one hundred years the ratio of silver to gold has varied from about 17-1 to just over 100-1. That means it took seventeen ounces of silver to equal one ounce of gold at the extreme. The average ratio has been about 53-1. Therefore without guessing what price will do, we know from factual history that when silver is below 53-1 gold is relatively cheap and above 53-1 silver is relatively cheap. As I write the ratio is about 80-1 which means silver is a lot cheaper than gold. So either silver goes up, or gold goes down or both at the same time and eventually we will regress to the mean of history.

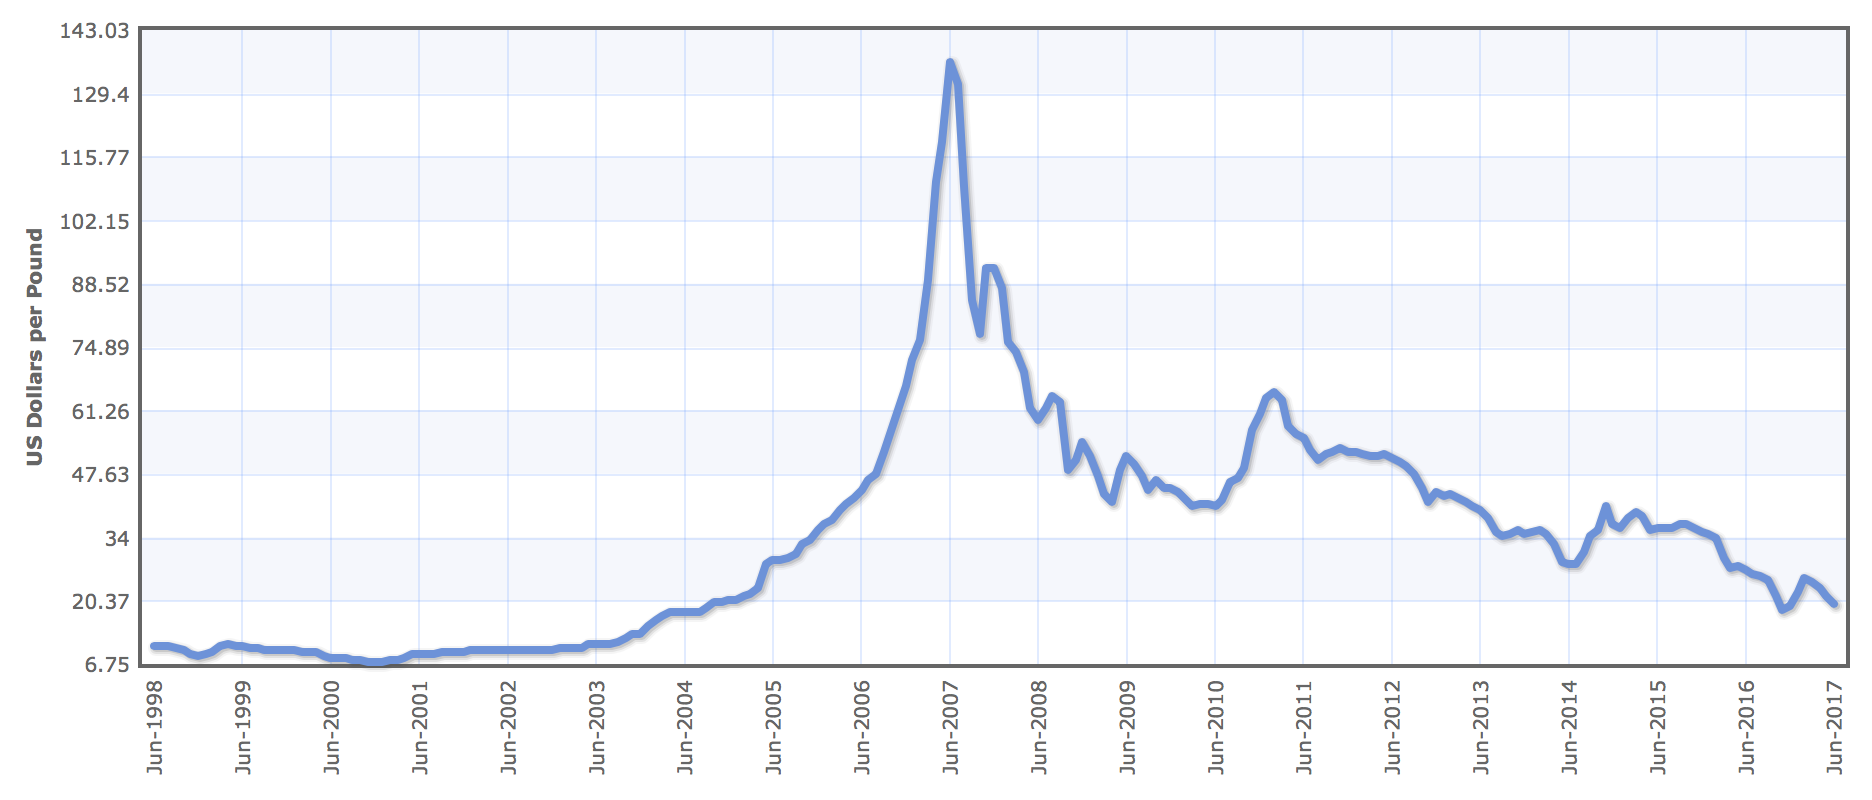
Likewise, for 95% of the time since the discovery of platinum in 1748 the metal has had a premium to the price of gold due to it being a lot more rare than gold. Lately the prices of the two commodities have inverted and platinum sells at about a $420 discount to gold. That’s a record by the way. 

Buying or selling anything when it is an extreme of emotion is the best way to profit. We can only guess from one day to the next what the correct price is for anything. But a study of the history of prices will immediately reflect when you are somewhere never gone before. In short at least compared to gold, both platinum and silver are cheap. If the level of debt in the world makes you think that maybe spending is not a surefire way to profit and debt is the same as slavery, it might be nice to own something that you can hold in your hand that has always had some value. Gold, silver and platinum make great insurance policies in times of financial chaos. Right now both silver and platinum are relatively better value than gold and those companies who are going to produce them should increase in value more than those of gold.

Group Ten Metals has put together a large land position in the Stillwater Complex in Montana adjacent to the 80 million ounce Pt/Pd resource belonging to the Sibanye-Stillwater Mine. The exploration on the Group Ten package is brownfields with management having a solid background and experience with PGMs and Ni projects including Stillwater, Wellgreen and Goldfields.

The 54 square km land package the company refers to as the Stillwater West project shows an 18 km long PGM soil anomaly also containing cobalt and gold. Just like the Stillwater Mine next door.

Stillwater West

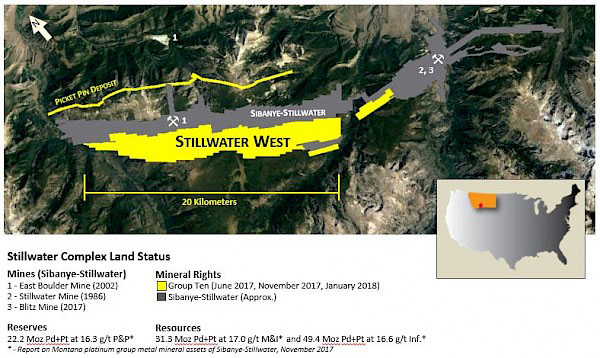
Within the Stillwater West property are found 12 major geophysical anomalies from 3 to 6 km in length to overlie the soil anomalies. Group Ten has drill data from 215 holes with over 28,000 meters of drilling. They have 11,000 meters of drill core. The Phase 1 exploration program in progress consists of relogging and assaying the 11,000 meters of core and putting together all the data into a geological model. At the conclusion the Phase 2 portion will drill test the highest priority targets. A drill permit has been applied for and the company believes drilling will commence later this summer.

I should remind readers that 78% of platinum production comes from South Africa. Certain political parties in the country are calling for an open season on white farmers. When South Africa goes the way of Zimbabwe it will leave Russia as primary producer of the PGMs. There is, of course, a coup d’état in progress in the United States with various powerful three-letter agencies determined to overthrow the democratically elected president and to go to war with Russia. I happen to believe that is the worst of bad ideas but who am I?

Should South Africa go the auto-stupid route and the coup succeed, it might be nice to have another alternative source for PGMs.

Both companies are headed by Greg Johnson; he has used the same model as he used with Novagold going back to 2000 in Alaska. He targeted a mineral and then put together a package of land properties in the same region. He has done the same with both Group Ten and Metallic Minerals, where he assembled a known package of similar claims into one big program. He did it in Montana and also in the Yukon in the Keno Hill silver district.

Metallic is focused on high-grade silver in a known district with past production of over 300 million ounces. Their 166 square km land package adjoins Alexco. Given the past production of silver from near surface and recent discoveries, Metallic believes the district has billion-ounce silver potential. Over the past 18 months the company has expended their land position and started a serious exploration program.

The 2018 drill program at Keno has started with four core holes completed from the Gold Hill target and sent to the lab. Results should be announced within the next month. Metallic is currently drilling the Caribou target. Drill applications have been submitted for the Formo target and the company believes drilling will start later in the summer.

After some severe pain to the ever-hopeful speculators, the price for the precious metals is going to turn with a vengeance. Silver and platinum companies should do better in relative terms than just gold. I own shares in both Group Ten and Metallic. Both companies are advertisers and naturally I am biased.

Any company that Greg Johnson is associated with is going to be good at communication and these companies are no different. Interested readers should browse through their presentations to learn a lot about both the companies and their commodities. Group Ten Metals presentation here. Metallic Minerals presentation here.

Group Ten Metals
PGE-V $0.185 (Jul 19, 2018)
PGEZF OTCBB 42.8 million shares 
Group Ten website.

Metallic Minerals Corp
MMG-V $0.28 (Jul 19, 2018)
MMNGF OTCQX 56.5 million shares 
Metallic Minerals website.

Bob and Barb Moriarty brought 321gold.com to the Internet almost 16 years ago. They later added 321energy.com to cover oil, natural gas, gasoline, coal, solar, wind and nuclear energy. Both sites feature articles, editorial opinions, pricing figures and updates on current events affecting both sectors. Previously, Moriarty was a Marine F-4B and O-1 pilot with more than 832 missions in Vietnam. He holds 14 international aviation records.

A Giant is Waking, With Humongous Profits Ahead

Man, I love catching a big move early. And there’s a metal that is just making a turn out of a long, brutal bear market right now.

It’s not gold. It’s not platinum. Nope, this metal glows in the dark.

It is still moving slowly, like a giant rousing from a deep slumber. Investors who hop aboard this giant now stand to make humongous profits.

I’m talking about uranium.

Uranium has rallied more than 12% from a low it hit in April. You might remember that was when I started pounding the table about this white-hot energy metal.

Recently, uranium was at $22.95 per pound, as you can see from this chart …

WWE4091 1

Is that the end of this rally? Heck, no! As this longer-term chart shows, uranium can get a lot more expensive, and in a hurry, too.

WWE4091 2

I expect uranium could rise to $40 a pound in a hurry. And from there, well … this sizzling metal did soar to over $140 a pound in the last bull market.

Screenshot 2018-07-19 07.23.26

BLAM! Did that get your attention? And why is uranium so cheap, anyway?

Well, commodities are cyclical. The last great uranium bull market ended in 2008. I should know. I made my subscribers a heck of a lot of money in that magnificent bull run.

But as often happens, if a mineral stays high enough, long enough, new mines come online.

Still, uranium prices were pretty good. That is, until 2011, when an earthquake and tsunami in Fukushima, Japan, sent three reactors into meltdown. That pushed uranium off a cliff. For a very long time.

The real crush came in the past few years. The price was cut in half, and the spot price of uranium hit a 13-year low of $18.60 in 2016. It bounced … a little … but kept scraping bottom.

The price of uranium went up 17% in 2017. That’s the first time the needle moved in years.

WWE4091 3

That’s only the third time uranium prices have gone higher in the past decade.

And this year? This year, the uranium market is looking to be really hot. White-hot!

Why is that? Well, there’s the fact that one miner after another has shut down production because it’s literally cheaper to buy uranium on the spot market than it is to mine it.

That’s a huge disconnect. It was only made possible because Japan’s idled reactors were selling their fuel reserves into the market. Now, Japan is turning reactors back on. It recently restarted its eighth reactor and is looking at bringing a bunch more back online.

That’s a major shift in the fundamentals.

But let’s look at the global picture. Now, there are 450 reactors in operation. Another 57 are under construction. Most of them are in Asia. Another 154 are on order or planned, and a further 284 proposed.

You need about 200 metric tons of uranium to run a typical 1,000-megawatt (MW) reactor for a year, and about twice that to start one up.

Globally, there are about 395,000 MWs of nuclear power installed. That means we need around 79 million metric tons a year of uranium.

The supply from mines, currently, is straining to meet this. About 65 million tons of uranium was mined in 2017. The rest is met from stockpiles.

But then there are all those new reactors I mentioned. The new reactors that are under construction will produce another 62,000 MWs of power. And that will require 12.4 million more metric tons of uranium per year.

And if we add in all the nuclear power plants on order or planned — that’s another 31.6 million metric tons of uranium required every year.

To be sure, nuclear power plants can’t run forever. And bears will point out that the U.S. has an aging nuclear fleet, and isn’t planning to build many more.

Yet.

But I’ll counter that with the fact that operating licenses for those old plants keep getting extended. That’s because nuclear power is cheap. Very cheap. And it’s needed as a backup for the next generation of sun and wind power, and more.

Now let’s add in the fact that there is a very tiny universe of only about 40 uranium producers, developers, and explorers. More will grab picks and shovels, sure. But right now, it’s like shooting fish in a barrel.

The white-shoe crowd on Wall Street is sleep-walking as the uranium giant rises from its slumber. The stampeded will begin soon enough. 

If you’re doing it on your own, please be careful, and do your own due diligence. But don’t miss this extraordinary rally to come.

All the best

Sean

EXTREME OIL PRICE VOLATILITY: Bad Sign That All Is Not Well In The Markets

The markets are in serious trouble as the extreme oil price volatility continues to devastate the global economy.  Investors and analysts today are totally clueless because they have become the frogs burnt to a crisp in the frying pan.  Over the past several decades, the oil price has fluctuated tremendously, much like the EKG of an individual whose vital signs have run amuck.

Unfortunately, no seems to notice, and no one seems to care (George Carlin).  However, the market and traders have grown accustomed to the volatile trading insanity as the oil price rises and falls 3-5% in a day.  Today, the West Texas Intermediate (WTI) Crude oil price has been down more than 4%:

WTI-OIL-SPOT-JULY-16-2018

And if we consider that the oil price was trading at $74 just last week, it is now down a further stunning 8%.  However, if we look at the oil price over a six-month period, the price fluctuations are even more significant:

When the stock markets suffered a correction at the end of January, beginning of February, the oil price fell 12% in a matter of a few weeks.  And more recently, the oil price shot up 15% from a low of $64 to a closing high of $74.  This huge 15% increase took place in the last two weeks of June.

With the world producing and selling 80+ million barrels of oil per day, large oil price fluctuations cause a great deal of stress in the overall markets.   According to the study on Oil Price Volatility: Causes, Effects, and Policy Implications:

Sharp, rapid swings in the price of oil can have outsize effects on companies, economies, and global geopolitics. Oil price spikes can stunt economic growth, for example, and a sudden price plunge can wreak havoc on cash-strapped oil companies. For countries, an oil price roller coaster can blow a hole in government budgets, prompt wholesale economic reform, or alter geopolitical priorities seemingly overnight.

Extremely large oil price spikes can stunt economic growth while collapsing prices negatively impact public and national oil companies.  However, this hasn’t always been the case.  During the twenty years from 1950 to 1970, the volatility of the U.S. oil price was extremely low, and during the latter decade… it was virtually non-existent:

From 1950 to 1953, the U.S. oil price remained at $1.71 a barrel.  Then in 1954, it increased by 12% and remained at $1.93 for three years until 1954.  The oil price then fell 2% to $1.90 in 1957 before rising 9% to $2.08 for 1958 and 1959. Later on Sept 14th, Iraq, Iran, Saudi Arabia, Kuwait, and Venezuela established OPEC and set the oil price at $1.80 from 1960-1970.

However, when the United States peaked in conventional oil production in 1970 and then after Nixon dropped the Gold-Dollar Peg in 1971, the oil price spiked and the period of tremendous price volatility began:

As we can see in the chart above when the world was still on the Gold Standard and awash in low-cost, high-quality oil, the oil price remained remarkably stable.  However, after the Dollar-Gold Peg was dropped in 1971, then the oil market changed forever.  The oil price shot up from $1.80 in 1970 to $36.83, which was the key factor that pushed the gold price up from $36 to $612 during the same period.  As the oil price surged 20 times from 1970 to 1980, the gold price increased 17 times.

Now, if we look at the oil price after 2000, the price volatility has gone completely wild.  The oil price jumped from $19 in 1999 to a high of $146 in 2008.  While the oil percentage increase (8 times) during the 2000’s wasn’t as tremendous as during the 1970’s (20 times), the volatility is much worse.

For example, the oil price fell from a high of $146 in June 2008 to a low of $34 by the end of the year.  In just six months, the oil price fell 77% from its high.  As the oil price recovered and then stayed above $100 from 2011-2014, it fell very quickly to $30 by the beginning of 2016.

The reason for the significant oil price rise in the 2000’s was due to the massive increase in global debt and derivatives.  According to the OCC Quarterly Reports on Bank Trading and Derivatives Activity, the total notional value of U.S. Banks Derivative Holdings increased from $45 trillion in 2001 to $235 trillion in 2013:

Now, this is only the amount of derivatives at U.S. Banks and Saving Associations.  According to several sources, global derivatives shot up to $1,000 trillion or a quadrillion dollars during the same period.  Furthermore, the global debt has ballooned from approximately $60 trillion in 2000 to $180 trillion by 2013:


While the current global debt is up even higher to a record $247 trillion, we can clearly see in the chart above how quickly the world’s debt skyrocketed from 2000 to 2013.  Thus, the massive increase in global debt and derivatives had a profound impact on the oil price.

As the oil price trended higher from $19 in 1999 to over $100 in 2011 (until mid-2014), this was very supportive to the oil industry.  However, now that the oil price is trading below $70, it is putting severe pressure on the marginal producers (Shale Oil, Heavy Oil, Oil Sands and DeepWater) and is not high enough to generate the needed capital expenditures to maintain or grow production in the future.

Furthermore, when the oil price collapses along with the upcoming market crash-correction, it will destroy a great deal of production.  I believe the next major market crash will be the major turning point for the END OF THE MIGHTY OIL INDUSTRY.

Check back for new articles and updates at the SRSrocco Report

Oil Retraces Libyan Production Surge

oilland2

The oil market took a beating this week, with the return of Libyan supply weighing on crude prices…. CLICK for the complete article