
Energy & Commodities
One quick look at the long term Uranium price chart below highlights Uranium is a very long way from its high in 2007, and it certainly isn’t trending upward. That said, this analyst has found that Uranium stocks are bucking the Uranium metal trend significanly, and are rising from a very sold out low. That, this analyst believes, means “we’re looking at a big, cyclical move in uranium prices” – R. Zurrer for Money Talks

The White-Hot Metal
Have you noticed what’s happening in uranium lately? Not the metal, which continues to snooze. The miners. They are ramping up. Take a look at this chart …

Why is This Happening?
On the demand side …
Global nuclear capacity is ramping up. In fact, it should double to at least 58 gigawatts by 2020-’21, then up to 150 gigawatts by 2030, and much more by 2050. That’s according to a new research report by the World Nuclear Association.
The same report says that China — which has 36 nuclear power reactors in operation — is building 21 new atomic power plants. They’ll all need to be fueled up. Nuclear plants take three times as much uranium at start-up as they normally use in a year.
Japan shut down all its atomic reactors after the Fukushima earthquake/tidal wave caused three of them to melt down. That country recently started bringing its nuclear plants back online. It’s preparing for the eighth restart right now … out of 43.
This is important because one of the things suppressing the uranium price was Japan selling its nuclear stockpiles from shut-down plants into the market. Now, it will have to stock up again.
On the supply side …
Kazakhstan, the world’s biggest uranium producer, has cut its uranium production twice in the last year.
Then Cameco (CCJ), the biggest producing company in the West, suspended production at its McArthur River Mine in Canada. That all adds up to 17,762 metric tons per year of supply taken off the market.
And just recently, the Department of Energy suspended its practice of selling excess uranium. That amounts to 2,100 metric tons per year.
There’s a lot more to the story. But you get the gist of it. We are seeing a good ol’-fashioned supply/demand squeeze in the glow-in-the-dark metal.
The price of uranium has been depressed for years. But last year, the price went up. By 17%. That’s not much, but it’s the first time that uranium prices have gone higher in years.
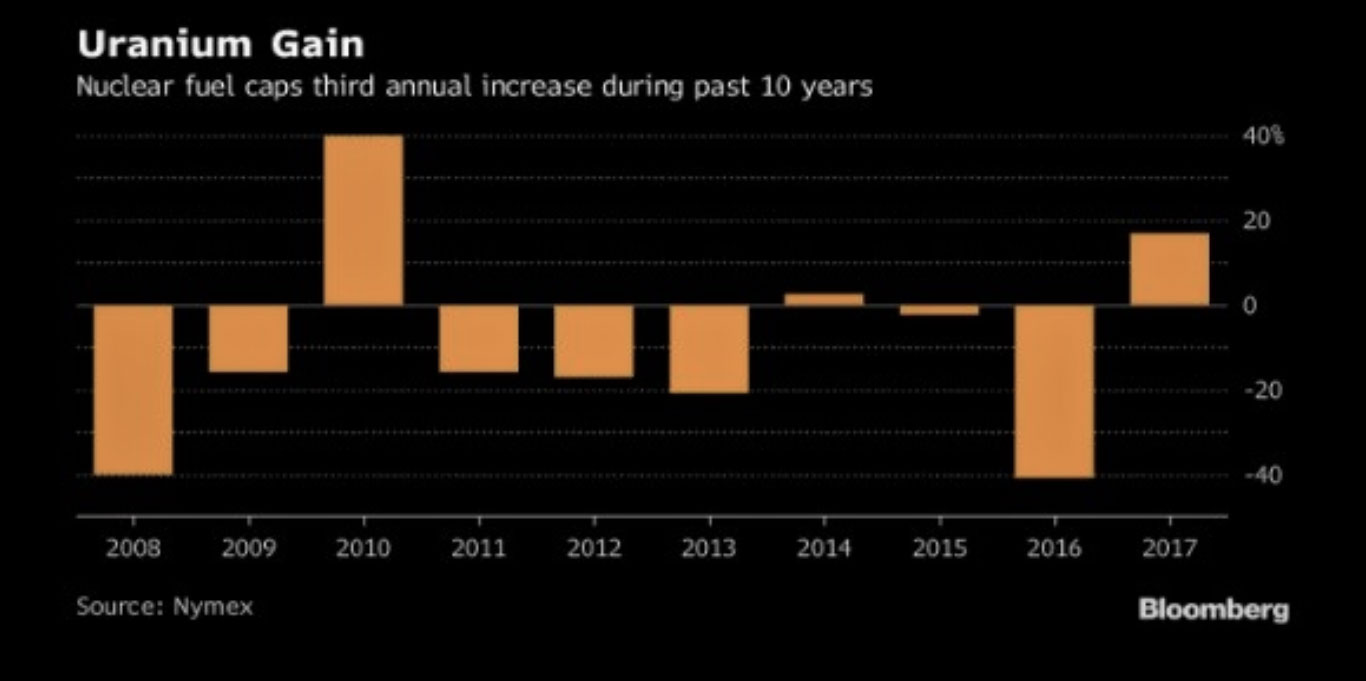 |
That’s nice. But you know what? Prices are still 67% below the 2011 peak!
You can see why I believe uranium might be at a tipping point. I believe we’re looking at a big, cyclical move in uranium prices. And it could be a melt-up, rather than a melt-down.
I’ve been around long enough that I’ve seen this before. In 2006-2007, my subscribers made one big profit after another on uranium stocks. Bam! Bam! Bam!
I just gave my Wealth Supercycle subscribers a new uranium report. It’s chock full of picks, too.
If you want your own copy of the report, click here.
The next big up-cycle in uranium is coming. You want to be onboard for it. My subscribers made a heck of a lot of money the last time this happened. This time could be even bigger.
All the best,
Sean

 Politicians terrified of environmentalists and in favor of anti-business politicial philosophies consider that the $47 billion in government revenue that would have come from the Kinder Morgan pipeline just isn’t that important. Tell that to the people that were going to do the 800,000 man hours of work on the project – R. Zurrer for Money Talks
Kinder Morgan said it would halt nearly all work on a pipeline project that is crucial to the entire Canadian oil sands industry, representing a huge blow to Alberta’s efforts to move oil to market.
Kinder Morgan’s Trans Mountain Expansion is the largest, and one of the very few, pipeline projects that has a chance of reaching completion. Alberta’s oil sands producers have been desperate for new outlets to take their oil out of the country, and the decade-plus Keystone XL saga is the perfect illustration of the industry’s woes.
Keystone XL is still facing an uncertain future, and with several other major oil pipeline projects already shelved, there has been extra emphasis on the successful outcome of the Trans Mountain Expansion. That is exactly why Canada’s federal government, including Prime Minister Justin Trudeau, has gone to bat for the project.
But, despite federal approval, Trans Mountain still faces a variety of obstacles that have bedeviled the project for some time. It appears that opposition from First Nations, environmental groups, local communities affected by the route, and the provincial government in British Columbia have forced Kinder Morgan to throw in the towel, at least for now.
Kinder Morgan said on Sunday that it suspended most work on the $5.8 billion Trans Mountain Expansion.
Environmental groups hailed the announcement. “The writing is on the wall, and even Kinder Morgan can read it. Investors should note that the opposition to this project is strong, deep and gets bigger by the day,” said Mike Hudema, climate campaigner with Greenpeace Canada, according to Reuters. Related: Russia Wants To Drop Dollar For Oil Payments
Kinder Morgan’s CEO Steve Kean said the project would be scrapped unless the legal challenges could be resolved by May 31. The announcement sparked a sense of panic among various Canadian politicians. “We are determined to find a solution. With all our partners, we continue to consider all available options. As our Prime Minister has said, this pipeline will be built,” Canada’s Federal Natural Resources Minister Jim Carr said in a statement.
Alberta’s Premier Rachel Notley, not surprisingly, sounded more alarmed. She took to Twitter to not only lash out at British Columbia, but also vow that her province would push the pipeline, even if it meant taking a public stake in the project.
However, Kinder Morgan actually didn’t sound all that optimistic, despite heavy support from Ottawa and Alberta.
“We will be judicious in our use of shareholder funds. In keeping with that commitment, we have determined that in the current environment, we will not put KML shareholders at risk on the remaining project spend,” Kean said in a statement. Kinder Morgan Canada said the project faces “unquantifiable risk,” noting the threats made by the BC government to kill the project. The company had already spent over C$1 billion preparing the project but hadn’t yet commenced construction. The beginning of construction would mean spending would jump to $200 to $300 million per month, a level of spending that the company says is too risky given the uncertainty.
“The fact remains that a substantial portion of the Project must be constructed through British Columbia, and since the change in government in June 2017, that government has been clear and public in its intention to use ‘every tool in the toolbox’ to stop the Project,” Kinder Morgan Canada’s Keane said in a statement. “The uncertainty created by BC has not been resolved but instead has escalated into an inter-governmental dispute.”
Kinder Morgan Canada saw its share price fall by 10 percent on the news during midday trading on Monday. Related: Continuously Rising Energy Costs Will Cripple The Economy
“This is not good. I think the key point is it shows a lack of confidence in our political and regulatory system,” said Tim Pickering, president of Auspice Capital in Calgary, told Reuters.
Western Canada Select (WCS) has traded at a steep discount relative to WTI, at times widening to as much as $30 per barrel. With WCS prices wallowing in the mid-$30s per barrel, heavy oil producers are missing out on some C$30 to C$40 million per day in revenues, according to Reuters.
The pipeline is critical for Canada’s oil sands. The IEA has forecasted that Canadian oil production already began to exceed takeaway capacity last year, and the pipeline shortage could last for several more years even if Trans Mountain Expansion moves forward. But, if Trans Mountain is killed off, that would be nearly 600,000 bpd of capacity that won’t come online. That raises questions about when and if the bottleneck will ever be addressed. That threatens to prevent new capacity from coming online in the years ahead.
“If we cannot reach agreement by May 31st, it is difficult to conceive of any scenario in which we would proceed with the Project,” Kinder Morgan Canada said in a statement.
By Nick Cunningham of Oilprice.com
More Top Reads From Oilprice.com:
- Permian Bottleneck Could Impact Global Oil Markets
- Higher Oil Prices Boost Saudi Credit Rating
- Saudi Officials Worried About Oil’s Future

While everything else has been getting smashed down, Gold and Silver were two of the few assets that were up within the overall carnage. This analyst makes the case that this is the result as investors begin to switch from building wealth to protecting wealth – R. Zurrer for Money Talks
MARKET MELTDOWN CONTINUES: Gold & Silver Prices Begin To Disconnect
As the BLOOD continues to run on Wall Street, gold and silver were the few assets trading in the green today. As I have mentioned in past articles and interviews, investors need to get used to this sort of trading activity. Even though the Dow Jones Index ended off its lows of the day, it shed another 458 points while the Nasdaq declined 190 points and the S&P fell 60.
As the broader markets sold off, the gold price increased $15 while silver jumped by $0.25. However, if we look at these markets during their peak of trading, the contrast is even more remarkable:
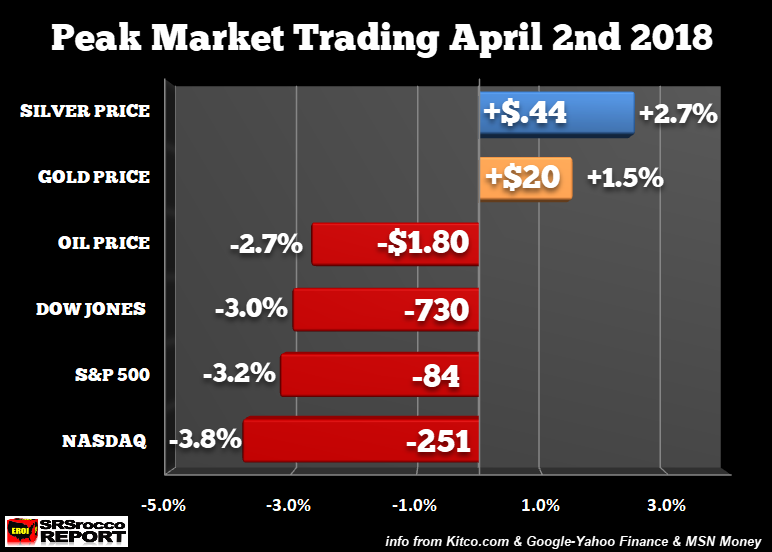
At the lows of the day, the Dow Jones Index fell 730 points or 3%, while the S&P 500 fell 3.2% and the Nasdaq declined by 3.8%. Also, as I expected, the oil price fell along with the broader markets by dropping 2.7%. If individuals believe the oil price will continue towards $100, due to supply and demand fundamentals put forth by some energy analysts, you may want to consider one of the largest Commercial Net Short positions in history. Currently, the Commercial Net Short position is 738,000 contacts. When the oil price was trading at a low of $30 at the beginning of 2016, the Commercial Net Short position was only 180,000 contracts.
Furthermore, if we agree that supply and demand forces are impacting the oil price to a certain degree, does anyone truly believe oil demand won’t fall when the stock market drops by 50+%??? I forecast that as market meltdown continues, the oil price will decline as oil demand falls faster than supply.
Now, when the markets were at their lows today, gold at its peak was up $20 while silver increased by $0.44. Of course, this type of trading activity won’t happen all the time, and we could see a selloff in all assets some days. But, once the Dow Jones Index falls below 19,000, investors will likely start to move into gold and silver in a much bigger way.
If we look at the following stocks and indexes from the peaks set in 2018, clearly, there’s a long way to go before the bottom is in:

The infamous FANG stocks are down between 14-20% from their highs while the broader markets are down 10-11%. When the Dow Jones Index fell from its high of 14,100 in 2007 to its low of 6,600 in 2009, it lost 53%. However, due to a higher degree of leverage in the markets today, I wouldn’t be surprised to see the Dow Jones Index fall by 60-75%. A 60% decline in the Dow Jones Index from its peak would put it at the 10,000 level… perfectly reasonable in my opinion.
So, what would a 60% selloff in the broader markets due to the gold and silver price?? That’s a good question. If just 1% of the $400 trillion in global assets moved into the precious metals, we could see some insanely higher prices. But, I don’t like to put out price targets because analysts who have done so in the past only frustrate themselves and their followers.
The next two charts show the beginning stage of the MARKET MELTDOWN as it pertains to the grossly overvalued stock called Netflix. When I posted this stock a few weeks ago, Netflix was trading at $310 a share. I mentioned that its recent stock trend resembled the antenna on the Empire State Building in New York City:

Unfortunately, the top of Netflix’s antenna must have been chopped off by some low flying 747 jetliner over the past two weeks:

Since March 19th, when Netflix was trading at $310, it has lost $30 or nearly 10%. If investors believe Netflix is a good BUY THE DIP setup, well then I gather you would be too stupid to consider buying gold and silver instead. So, I am not going to waste my breath. However, if you are beginning to get worried that the market has a long WAY TO GO DOWN, then you may want to consider switching from BUILDING WEALTH to PROTECTING WEALTH.
Mark my words… 2018 will be the year that investors started switching from building wealth to protecting wealth. Unfortunately, those who make this change will likely only be a small percentage of the market. Thus, we are probably going to see a lot more BLOOD IN THE STREETS.
Crude Oil is currently scratching at recent highs, but this analysis makes a strong case we will see an immediate drop back $5 to $6 in the next 5-10 days. Click on all chart for larger versions – R. Zurrer for Money Talks
Crude Oil – Hello Elliott, My Old Friend…
The test of the resistance line, the triangle apex reversal, the a-b-c waves in the zigzag pattern… What connects them? Give us 28 paragraphs and 974 words and you will see that these seemingly mismatched concepts will form a meaningful and promising scenario
Technical Analysis of Crude Oil
Let’s start with the well-known daily chart (charts courtesy of http://stockcharts.com).

In our Monday’s Oil Trading Alert, we wrote that oil bulls took control shortly after the opening of the Friday session (…) and climbed to the major resistance zone, which stopped light crude’s rally at the end of January, triggering declines in the following weeks.
Will history repeat itself once again and we see similar price action in the coming days?
As you see on the daily chart, the red resistance zone created by the previous 2018 peaks is currently reinforced by the upper border of the green rising trend channel, which suggests that reversal may be just around the corner – especially when we factor in the fact that the daily indicators increased to their overbought areas, which could translate into sell signals in the very near future.
From today’s point of view, we see that the situation developed in tune with our assumptions and crude oil reversed and pulled back after the test of the upper border of the green rising trend channel, which suggests further deterioration in the coming days.
But will we really see the next downward move in near future? After all, oil bears disappointed us many times during the last month, so why should it be different now and why we should trust them?
The Reasons
First, the bears have on their side the above-mentioned strong resistance zone, which successfully stopped their opponents two times earlier this year.
Second, the Stochastic Oscillator generated the sell signal.
Third, Elliott wave theory…
What do we mean by that? Let’s examine the chart below.

Looking at the daily chart once again (but this time from a wider and different perspective), you can see that we divided the entire upward move, which started in June 2017 for individual waves in accordance with Elliott wave theory.
The potential first wave ended on August 1, 2017, the second wave ended on August 31. The third wave stretched until January 25. After this peak the price of crude oil corrected the previous upward move, which created the first wave (marked with a) in a potential zigzag pattern. As you see, the green support zone triggered a rebound, which created a potential wave b of a zigzag, which includes another zigzag at the moment of writing these words.
What does it mean for crude oil and how oil bears can use this pattern?
The most important feature of wave b is that it cannot retrace 100% of wave a. In other words, if the above sequence of waves is well-written, we’ll see another downward move in the coming days. In this way, black gold will create wave c in the above-mentioned big zigzag.
How Low Could Crude Oil Go?
If crude oil goes to the south from current levels, we’ll see (at least) a decline to the lower border of the medium-term blue rising trend channel seen on the above chart (currently around the February low of $58.10).
This is the Time, This is the Place
Once we already know where (potentially) the next wave of declines will head, it’s time to find out when we can expect another bigger reversal that will end the move to the downside. What can help us with this issue?
If you do not know yet, don’t worry about that, because we will describe everything in the following paragraphs (after all, you have us to analyze the charts carefully and share our insights).

So, coming back to the earlier question… what can help us determine the date of the next reversal? Triangle apex reversal pattern. What does it mean in practice?
Looking at the above chart, you can see the yellow triangle created by the resistance line based on the late February and early March highs and the support line based on the mid-February and mid-March lows. The intersection of his arms took place yesterday, which resulted in a reversal.
On the above chart, however, we can notice one more tringle (marked with the black dashed lines). As you see, it is created by the resistance line based on the February peaks and the support line based on the December and February lows. When will these lines intersect? Around April 10. What’s interesting, this date is also confirmed by the blue triangle (we marked it with dashed lines on the first daily chart in today’s alert) and two medium-term triangles seen on the weekly chat below.

From this perspective, we see that the blue triangle is created by the resistance line based on the June 2016 and January 2017 peaks and the support line based on the April 2016 low and mid-November 2016 low. The green triangle is created by the resistance line based on the February and April 2017 highs and the support line based on the August 2016 and June 2017 lows.
Additionally, analyzing the above chart, we noticed that April 4, 2016 and April 10, 2017 brought reversals, which increases the probability that we’ll likely similar price action in the coming month.
Will April 9/10, 2018 show the bottom of the fourth wave in the five-wave sequence? Taking all the above into account and combining it with the fact that in the same “time zone” the duration of the wave c will be equal to the duration of the wave a (we marked them with black rectangles on the last daily chart) we believe that oil bears will do their best and realize this scenario, making our short positions profitable.
Finishing today’s Oil Trading Alert, please keep in mind that the above waves’ structure may break only if the price of light crude increases above the major red resistance zone. Nevertheless, at the moment of writing these words, all available technical and fundamental factors favor the pro-bearish scenario in the following weeks.
Thank you.
Nadia Simmons
Forex & Oil Trading Strategist
Przemyslaw Radomski, CFA
Founder, Editor-in-chief, Gold & Silver Fund Manager
Sunshine Profits – Tools for Effective Gold & Silver Investments
Get 7 days of free access to our premium daily Oil Trading Alerts as well as Gold & Silver Trading Alerts. Sign up now.
* * * * *
All essays, research and information found above represent analyses and opinions of Przemyslaw Radomski, CFA and Sunshine Profits’ associates only. As such, it may prove wrong and be a subject to change without notice. Opinions and analyses were based on data available to authors of respective essays at the time of writing. Although the information provided above is based on careful research and sources that are believed to be accurate, Przemyslaw Radomski, CFA and his associates do not guarantee the accuracy or thoroughness of the data or information reported. The opinions published above are neither an offer nor a recommendation to purchase or sell any securities. Mr. Radomski is not a Registered Securities Advisor. By reading Przemyslaw Radomski’s, CFA reports you fully agree that he will not be held responsible or liable for any decisions you make regarding any information provided in these reports. Investing, trading and speculation in any financial markets may involve high risk of loss. Przemyslaw Radomski, CFA, Sunshine Profits’ employees and affiliates as well as members of their families may have a short or long position in any securities, including those mentioned in any of the reports or essays, and may make additional purchases and/or sales of those securities without notice.
Game theory postulates that rising oil prices increases the payoff for OPEC members to cheat on their deal. Game Theory is “the study of mathematical models of conflict and cooperation between intelligent rational decision-makers” and is mainly used in economics – R. Zurrer for Money Talks

- OPEC members have a deal to cap production levels until December.
- Oil prices are rising.
- When prices are higher, there is less incentive to cooperate with production caps.
With oil prices rising, Organization of Petroleum Exporting Countries members are facing a dilemma.
Extending output caps means making more room in the market for non-member competitors, and coordinating a higher amount of output means lowering prices. So they might not do either, and game theory could help explain why.
“Game theory suggests that higher oil prices increase the pay-off from cheating on the deal, which means that compliance could fall in 2018,” Thomas Pugh and Liam Peach, economists at Capital Economics, wrote in a note to clients this week.
West Texas Intermediate crude oil has stayed above $60 a barrel most of this year, only falling during a major market selloff in February. And as prices rise, non-OPEC production is increasing. In November, US shale producers hit a record high for production, pumping more than 10 billion barrels a day.
For an individual country focused on maximizing revenue, producing as much oil as possible is usually the dominant strategy — what players should do regardless of the actions of other players.
But when everyone amps up production, it puts downward pressure on prices. In game theory, this is an example of the prisoner’s dilemma. Because everyone acts out of self-interest, players end up in a worse scenario than if they collaborated.
This is where OPEC collusion comes in. Member countries — Algeria, Angola, Ecuador, Equatorial Guinea, Gabon, Iran, Iraq, Kuwait, Libya, Nigeria, Qatar, Saudi Arabia and the United Arab Emirates — act as a single supplier.
But as prices rise, it creates more incentive for members to cheat and produce more. Because marginal revenue is higher than at lower prices, there is greater payoff from raising output — even in the face of production caps.
At the same time, the opportunity cost of complying also becomes greater.
“Cutting output to counter the effect of rising non-OPEC production would require giving up increasing amounts of market share and revenue,” Pugh and Peach added.
….also from Business Insider: Trump wants to go after Amazon

-
I know Mike is a very solid investor and respect his opinions very much. So if he says pay attention to this or that - I will.
~ Dale G.
-
I've started managing my own investments so view Michael's site as a one-stop shop from which to get information and perspectives.
~ Dave E.
-
Michael offers easy reading, honest, common sense information that anyone can use in a practical manner.
~ der_al.
-
A sane voice in a scrambled investment world.
~ Ed R.
Inside Edge Pro Contributors

Greg Weldon

Josef Schachter

Tyler Bollhorn

Ryan Irvine

Paul Beattie

Martin Straith

Patrick Ceresna

Mark Leibovit

James Thorne

Victor Adair