
Energy & Commodities
The smashed Stock Market, an $8 drop in Oil combined with a seasonality situation has created an exceptional opportunity. One look at the chart of the XLE Energy Select Sector Fund and you can see you’ll be buying low! Whether its a new bull market or not, Institutional Advisors sees an 8 week rally from a severly oversold situation. Take a look – Robert Zurrer for Money Talks:
We reported on the upside Exhaustion Alert in the big cap oils (XLE) on January 11th, anticipating a pullback into the normal seasonal low in February with the possibility of two legs to the downside. Prices continued higher for another ten days, but with bearish divergences in the money flow oscillators. Needless to say, the break has been more than normal. Downside Capitulation Alerts have been generated as of Friday. These follow a daily Sequential 9 Buy Setup. A 40% to 50% retracement of the decline, back to the 50-day moving averages within three to six weeks would be the normal action.

Seasonally, the XLE tends to bottom around the 20th of February and rally for eight weeks (profitable 14 of the 18 years). The most reliable moves have been when the price has been oversold in the preceding weeks. This year clearly offers that set of circumstances.
Opinions in this report are solely those of the author. The information herein was obtained from various sources; however, we do not guarantee its accuracy or completeness. This research report is prepared for general circulation and is circulated for general information only. It does not have regard to the specific investment objectives, financial situation and the particular needs regarding the appropriateness of investing in any securities or investment strategies discussed or recommended in this report and should understand that statements regarding future prospects may not be realized.
Investors should note that income from such securities, if any, may fluctuate and that each security’s price or value may rise or fall. Accordingly, investors may receive back less than originally invested. Past performance is not necessarily a guide to future performance. Neither the information nor any opinion expressed constitutes an offer to buy or sell any securities or options or futures contracts. Foreign currency rates of exchange may adversely affect the value, price or income of any security or related investment mentioned in this report. In addition, investors in securities such as ADRs, whose values are influenced by the currency of the underlying security, effectively assume currency risk. Moreover, from time to time, members of the Institutional Advisors team may be long or short positions discussed in our publications.
BOB HOYE,
INSTITUTIONAL ADVISORS
EMAIL bhoye.institutionaladvisors@telus.net
WEBSITE www.institutionaladvisors.com

On Monday, oil bulls extended gains after Friday’s invalidation of the breakout, which together with the buy signal generated by the Stochastic Oscillator suggest further improvement. A least at the first sight. But does watching the room through the keyhole give us a full picture of what’s inside? We also think so, therefore, we invite you to analyze a broader picture of crude oil.
Let’s analyze the charts below (charts courtesy of http://stockcharts.com).
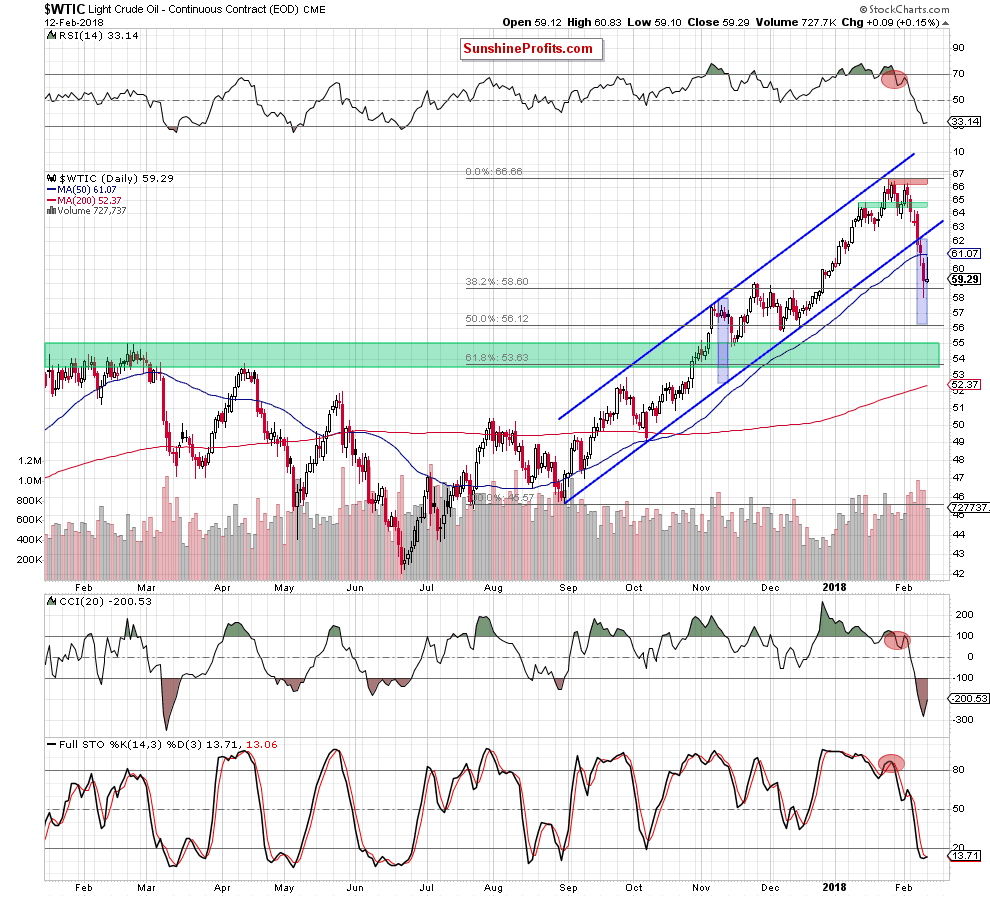
On the daily chart, we see that thanks to Friday’s decline the commodity dropped to our first downside target – the 38.2% Fibonacci retracement (based on the August-January upward move), but then rebounded and invalidated the earlier breakdown under this support. As you see, this positive event encouraged oil bulls to act, which resulted in further improvement after the market open.
But did the bulls’ “rally” change anything in the overall picture of black gold? Some of you will likely say that an invalidation of the breakdown under the above-mentioned retracement in combination with the buy signal generated by the Stochastic Oscillator could trigger further improvement.
Of course, such a probability can’t be ruled out, however, focusing only on these two positive factors without looking more closely at the bearish arguments is like watching a closed room through a keyhole. We see only a little piece of a larger image, which can be confusing. Why are we writing about it? Let’s analyze the factors, which oil bears have on their side.
Firstly, light crude increased to the previously-broken 50-day moving average, but then reversed and decline quite sharply, which looks like a verification of the earlier breakdown under this line. Secondly, size of volume, which accompanied yesterday’s increase was visibly smaller compared to what we saw in the previous week during declines. Thirdly, although the Stochastic Oscillator generated the buy signal, the sell signals generated by the RSI and the CCI remain in the cards.
On top of that, let’s recall the most important factor, which justifies the maintenance of short positions (seen on the medium-chart below).
What do we mean? An invalidation of the breakout above the upper border of the green rising trend channel, which materialized on huge volume, increasing the probability of further deterioration.
Additionally, from this perspective, we clearly see that yesterday’s price action also looks like a verification of the breakdown under this important resistance line, which is (at least at the moment of writing these words) a bearish development – especially when we factor in the sell signals generated by all the medium-term indicators.
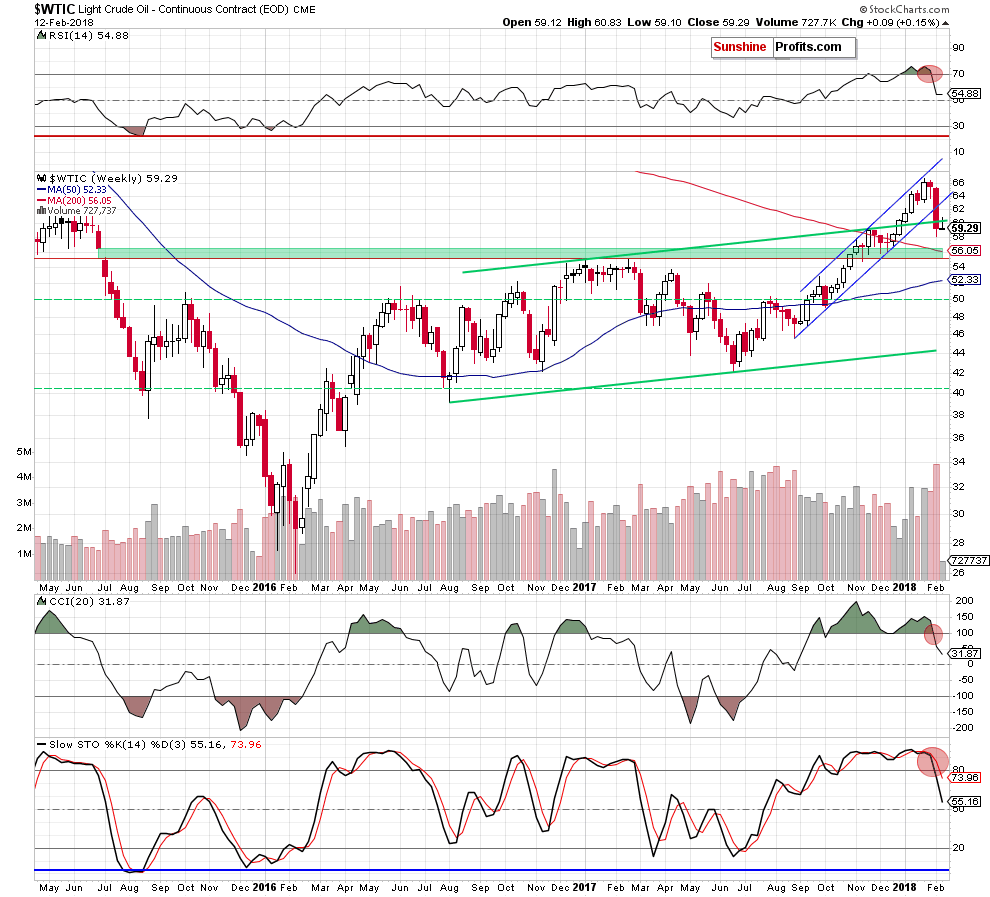
And speaking of the indicators… let’s zoom out our picture and take a look at the long-term chart. Will oil bears find an ally here?
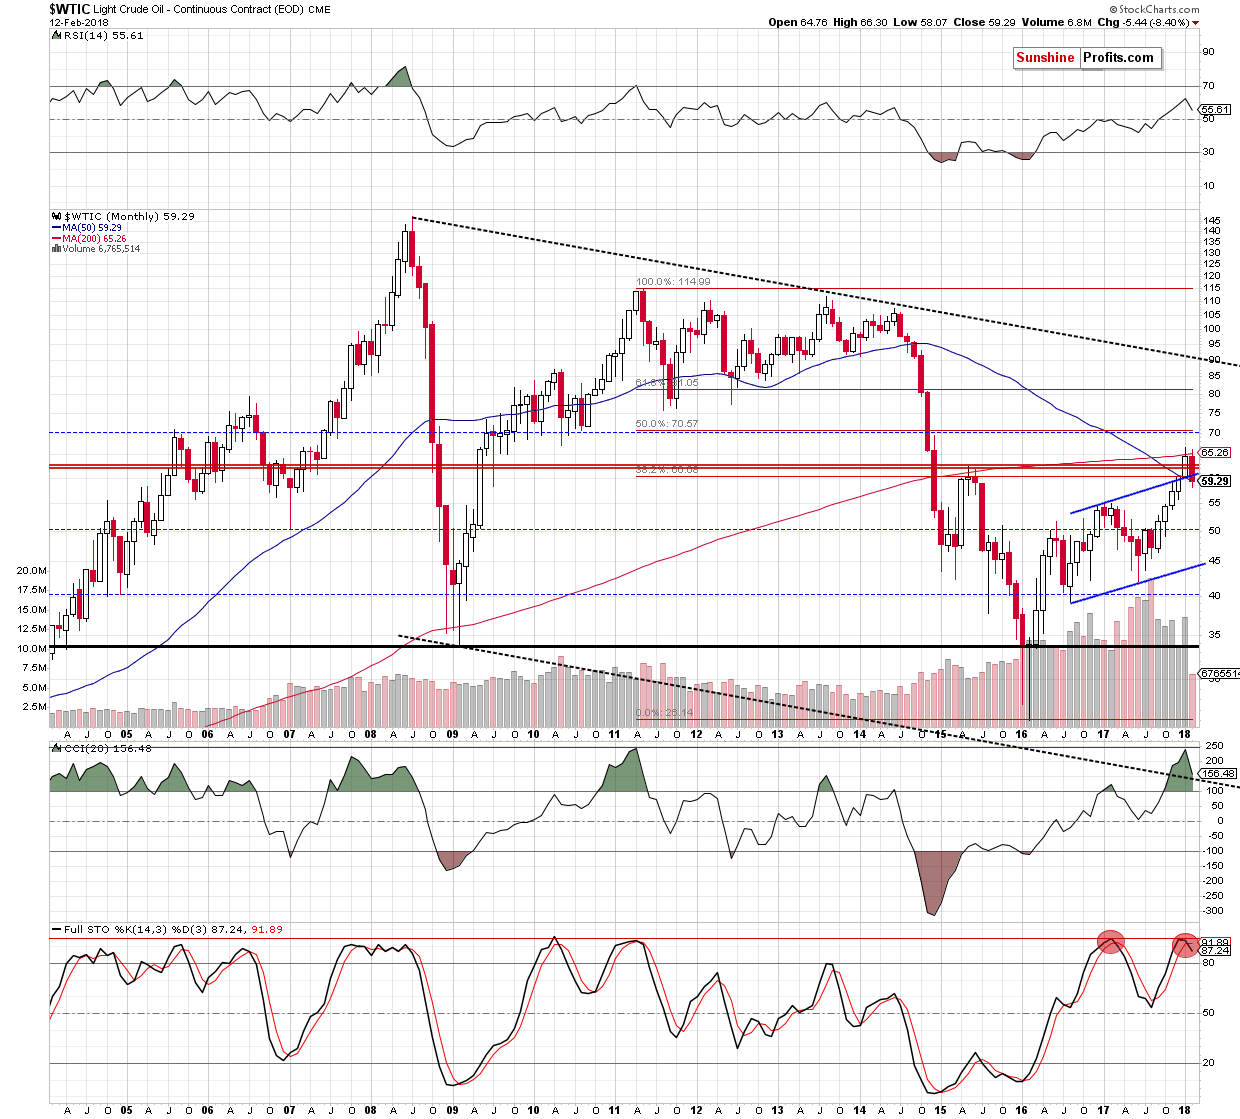
In our opinion, even four: another invalidation of the tiny breakout above the 200-month moving average, an invalidation of the breakout above the May 2015 peaks, an invalidation of the breakout above the 38.2% Fibonacci retracement and the sell signal generated by the Stochastic Oscillator.
The last time when this indicator generated the sell signal was in March 2017. What happened in the following moths? Declines, which took crude oil not only below the barrier of $50, but also to the 2017 low of $42.05.
Where could black gold head next? In our opinion, the first downside target will be around $55.82-$56.12, where the December lows and the 50% Fibonacci retracement are. Additionally, in this area the size of the downward move will correspond to the height of the blue rising trend channel, which increases the probability that oil bears will test this area, making our short positions even more profitable in the coming week.
If you enjoyed the above analysis and would like to receive daily premium follow-ups, we encourage you to sign up for our Oil Trading Alerts. Sign me up.
Thank you.
Nadia Simmons
Forex & Oil Trading Strategist
Przemyslaw Radomski, CFA
Founder, Editor-in-chief, Gold & Silver Fund Manager
While U.S. oil production reached a new peak of 10.25 million barrels per day, the higher it goes, the more breathtaking will be the inevitable collapse. Thus, as the mainstream media touts the glorious new record in U.S. production that has both surpassed its previous peak in 1970 and Saudi Arabia’s current oil production, it’s a bittersweet victory.
Why? There are two critical reasons the current record level of U.S. oil production won’t last and is also, a house of cards. First of all, oil production profiles tend to be somewhat symmetrical. They rise and fall in the same manner. While this doesn’t happen in every country or every oil field, we do see similar patterns. For example, this similar trend is taking place in both Argentina and Norway:

Here we can see that oil production increased, peaked and declined in a similar pattern in both Argentina and Norway. However, many countries had their domestic oil industries impacted by wars, geopolitical events, and or enhanced oil recovery techniques that have resulted in altered production profiles. Regardless, the United States experienced a symmetrical oil production profile from 1930 to 2007:

As we can see in the chart, U.S. oil production from 1930 to 2007 increased and then declined in the same fashion. On the other hand, the new Shale Oil Production trend is much different. What took 23 years for U.S. oil production to double from 5 million barrels per day (mbd) in 1947 to a peak of nearly 10 mbd in 1970, was accomplished in less than a decade with the new shale oil industry. Total U.S. oil production doubled from 5 mbd in 2009 to over 10 mbd currently.
For those Americans or delusional individuals who believe the U.S. oil industry will be able to continue producing a record amount of oil for the next several decades, you have no idea about the financial carnage taking place in the U.S. shale oil industry. This leads me to the second reason. The U.S. Shale Industry hasn’t made any money producing oil since the industry took off in 2008. And it’s even worse than that. Not only have they not made any money, but they have also spent a lot of investor money (most that will never be returned) and added a massive amount of debt to their balance sheets.
According to the Financial Times article, In Charts: Has The US Shale Drilling Revolution Peaked?, they provided the following chart on the negative free cash flow in the U.S. Exploration and Production Industry:

Because the U.S. Shale Oil Industry was a Ponzi Scheme from day one, the shale oil companies had to design clever investor relations presentations to bamboozle, hoodwink, swindle and hornswoggle investors from their money. And boy did it work. Even though two-thirds of the U.S. shale energy companies are still losing money, investors continue to flood the energy sector with gobs of Dollars and Pennies from Heaven. Without these much-needed funds, the U.S. Shale oil industry would go belly-up.
Now, there’s another downside to the U.S. Shale Oil Industry that I haven’t yet mentioned. Because shale energy industry is producing a grade of oil that has a very high API gravity (very light oil), we have to export more and more of it as our refiners can’t use it all. The notion that the U.S. decided to start export oil because we have become a leading oil producer is pure BOLLOCKS. The real reason the U.S. Government allowed the exporting of oil in 2015 was that our refining industry couldn’t use it all…LOL.
If you have your thinking cap on, why would we have to export oil if we could use it ourselves?? Well, again… the answer is that we cannot use all of our “light tight” shale oil. Here is a chart from one of the members of the PeakOilBarrel.com site:

According to the U.S. Energy Information Agency (EIA), the majority of growth in U.S. oil production is in the very light API gravity oils above 40. Unfortunately, there is a glut of high API Gravity oils (light oil) in the United States and the world. In the Petroleum Economist article, U.S. Tight Oil: Too Light, Too Sweet, stated the following:
While the US runs on light products, with gasoline making up nearly 48% of the demand barrel, the rest of the world has a stronger taste for middle distillates. The global demand barrel is 36% middle distillates and only 32% gasoline. European and Eurasian middle-distillate demand is an enormous 49.3% of the barrel, according to the latest BP Statistical Review. Middle-distillate demand is widely expected to grow as worldwide trucking volumes increase and maritime fuels begin a major shift to marine gasoil from heavy fuel oil so they comply with new sulphur-emissions limits. Product consumption patterns outside the US argue for processing middle-gravity crudes such as Arab Light, Iranian Light and Russian Urals, rather than extra-light barrels such as 48°API gravity Eagle Ford.
The weighted average API gravity of EU crude imports in 2016 was 35.2°, according to Eurostat. Refinery inputs look similar: the current average API gravity of the crude entering American refineries is approximately 32.3°, nearly unchanged for the past 30 years despite the recent rise in light oil output. Worldwide investments into more complex, higher conversion refineries have eroded very light sweet oils’ long-prized light-distillate yield advantage.
As the article states, the rest of the world demands more middle distillate fuels that come from medium grade oil stock. Furthermore, the weighted average API gravity of EU (European Union) crude oil imports in 2016 was 35.2°. However, the majority of U.S. Shale oil API gravity is 40-50°+.
Thus, as the U.S. shale oil industry continues to produce more light oil, exports will likely increase. And we already see this taking place. The U.S. net oil imports have risen from 2 mbd in Oct 2017 to 4.4 mbd currently. It is difficult to tell how much net oil imports will be over the next six months, but it is quite interesting to see the U.S. importing more oil even though we just hit a record of 10.25 mbd.
In conclusion, U.S. oil production in the future will collapse just as fast as it increased. It is hard to forecast when U.S. oil production will finally peak for good because there is so much fraud, leverage, and debt propping up the system. But, when the Greatest Financial Ponzi Scheme finally pops… I believe U.S. oil production will collapse much faster than we realize.
Check back for new articles and updates at the SRSrocco Report.
What is happening in the crude oil market is unprecedented. Commercial short positions have now reached unimaginable levels (see stunning chart below).

Meanwhile, Commercial Euro Shorts Hit All-Time Record! —–continue reading HERE

Pay close attention to where commodities are relative to equities right now. Compared to the S&P 500 Index, materials are extremely undervalued, the most since at least 1970. This makes now a very attractive entry point—or as natural resource investors Goehring & Rozencwajg Associates writes in its quarterly report, there could be “a proverbial fortune to be made” if investors take advantage of this once-in-a-generation opportunity.
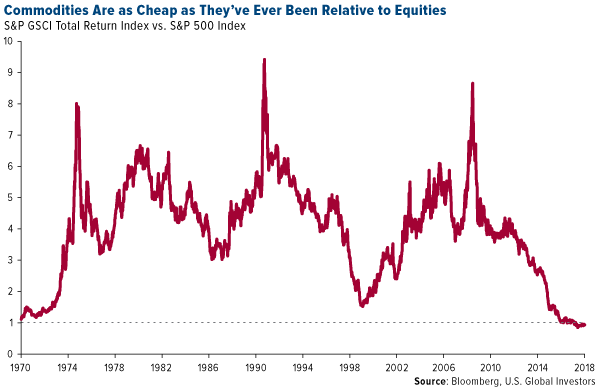
“When commodities are this cheap relative to stocks, the returns accruing to commodity investors have been spectacular,” the firm continues:
For example, had an investor bought the Goldman Sachs Commodity Index (or something equivalent) in 1970, by 1974 he would have compounded his money at 50 percent per year. From 1970 to 1980, commodities compounded annually in price by 20 percent. If that same investor had bought commodities in 2000, he would have also compounded his money at 20 percent for the next 10 years.
Past performance doesn’t guarantee future results, of course, but the implications here are very compelling if mean reversion takes place. There have been few times that I can remember when an asset class looked as favorable as commodities do now. If you agree, it might be time to consider adding exposure to materials, energy and mining to your portfolio.
Oil Just Had Its Best January Since 2006—Further Gains Ahead?
Energy in particular looks very attractive. West Texas Intermediate (WTI) crude oil, the American benchmark, logged its best January since 2006, gaining more than 7 percent on scorching hot demand, sustained production cuts by the Organization of Petroleum Exporting Countries (OPEC), deteriorating output from Venezuela and a record-setting stockpile drawdown. U.S. oil inventories declined for 10 straight weeks as of January 24, the longest stretch ever recorded, before jumping again in the week ended January 31.
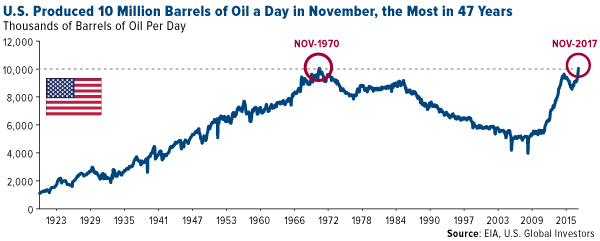
What’s more, the U.S. Energy Information Administration (EIA) just reported that, thanks to the revitalized shale revolution, the U.S. produced over 10 million barrels of oil per day in November, the first time it’s done so since 1970. This puts the country on a path to catch up with and possibly exceed Russia, which produced an average 11 million barrels a day in 2017, and world leader Saudi Arabia, whose energy behemoth Saudi Aramco produces around 12.5 million barrels a day.
As I’ve written many times before, the American fracking industry is largely responsible for keeping global oil prices low, which has been a huge windfall to the world economy. In its coverage of the news that U.S. output topped 10 million barrels, the Financial Times put it best, writing that American frackers have “boosted the U.S. economy, creating tens of thousands of jobs, bolstered its energy security, created new international relationships and given Washington new freedom to use sanctions as a tool for strategic influence.”
But shouldn’t all this extra supply halt the oil rally and put a damper on producer and explorer stocks? Not so fast.
Companies Just as Profitable with $65 Oil as They Were with $100 Oil
In the years since oil prices cratered—and subsequently began to rise—energy companies have become much more efficient and have learned to do more with less. As the Financial Times notes, U.S. frackers are producing what they are today while employing only three quarters of the workforce they had in the days of $100-a-barrel oil. ExxonMobil, the largest American producer, is in expansion mode, with plans to ramp up its shale mining in the Permian Basin to 500,000 barrels a day by 2025.
It’s not just American companies that have grown lean and mean in this climate of lower oil prices. Says the chief financial officer of Royal Dutch Shell: “We are able to do the same for less.”
Europe’s largest producer this week reported that profits tripled in 2017, generating nearly as much cash flow as when oil prices hovered around $100.
According to the Wall Street Journal, the company has “fundamentally revamped the way it designs and executes projects and is working to deliver another $9 billion to $10 billion of savings in the coming years” through restructuring and by paying down loads of debt.
As a result, Shell has rewarded its shareholders well, delivering a dividend yield of nearly 6 percent, among the highest in the entire industry.
These rewards could continue, as Goldman Sachs now sees Brent jumping to $82.50 within the next six months, up from just under $70 today. Hedge funds’ net long position on Brent hit an all-time high of more than 584,000 contracts last week, according to ICE Futures Europe and reported by Bloomberg. WTI net long positions also surged, according to the U.S. Commodity Futures Trading Commission, to nearly 500,000 contracts, the most since 2006.
To learn more about energy and commodities, click here!

-
I know Mike is a very solid investor and respect his opinions very much. So if he says pay attention to this or that - I will.
~ Dale G.
-
I've started managing my own investments so view Michael's site as a one-stop shop from which to get information and perspectives.
~ Dave E.
-
Michael offers easy reading, honest, common sense information that anyone can use in a practical manner.
~ der_al.
-
A sane voice in a scrambled investment world.
~ Ed R.
Inside Edge Pro Contributors

Greg Weldon

Josef Schachter

Tyler Bollhorn

Ryan Irvine

Paul Beattie

Martin Straith

Patrick Ceresna

Mark Leibovit

James Thorne

Victor Adair