
Energy & Commodities
We’ve all watched in amazement, while the equities markets around the world have risen to new highs. On Wall Street hardly a week goes by without a new record. There comes a time however when a sector becomes so overbought, that smart money begins to leave and search for a sector that has been overlooked. That moment is now at hand, as can be seen in our first chart – courtesy sources listed.

This chart compares equities to commodities. In 1970, 2000 and today, equities have become overpriced, while commodities are oversold and cheap by comparison. In 1973, 1990 and 2008, oil and commodities became overbought and investors sold commodities and bought stocks. If history repeats (and it often does), we are about to witness a massive switching from equities into commodities. This trend may or may not include oil, since it is already in a bull market, but because of ongoing demand in Asia it will include such items as natural gas, copper, lithium, vanadium, zinc, and cobalt, and the stocks of the companies that mine and produce these commodities will be in great demand.

This chart courtesy Zerohedge.com shows the average number of days in the US stock market between occasions where the index drops 5% or more is 92 days, all the way back to 1929. In the mid-1960s there was a stretch without a 5% correction for 386 days. In the mid 1990s the index went 394 days without a 5% correction. And now (as of Thursday Jan 25th) we have gone a record 399 days without a 5% pullback. So The S&P has NEVER been this over-valued, NEVER been this overbought, and NEVER gone this long without even a minor correction. Odds are…..

This chart courtesy goldchartsrus.com shows US Money Supply continues to rise, across all measures. This money needs a destination, and with the stock market in bubble territory, a lot of this money is destined for commodities.

This S&P GSCI Commodity Index chart courtesy sources listed shows an inflation gauge that is used by the NY FED. It is called the Underlying Inflation Gauge, and you can see it here as a light blue line. It is warning that price inflation is underway. At www.pdegraaf you’ll see that the Model Portfolio (which reflects live transactions) is currently ahead by 38% – well above the rate of inflation. It is very important that our investments stay ahead of the rate of inflation.

Featured is GNX the commodity index. Price is breaking out above lateral resistance, after already having broken out from beneath the 200WMA. The target for this breakout is at the green arrow. The supporting indicators are positive.

This chart courtesy Mark J. Lundeen will be a surprise to some. It compares US bonds, stocks, silver and gold to currency in circulation. The surprise is that since year 2000, gold has outperformed equities by 4.60 to 2.27. Even silver, – in an 18 year span, – has outperformed the stock market. It was inflation that propelled gold and silver to rocket higher in the late 1970s. Is history about to repeat? Whenever commodities are in a bull market, gold and silver tend to shine.
Peter Degraaf is an investor with over 50 years of experience. Google him, or visit www.pdegraaf.com
DISCLAIMER: Please do your own due diligence. Peter Degraaf is NOT responsible for your trading decisions.

 Bob Moriarty of 321 Gold discusses the role of sentiment in the commodities markets and what it means for investors.
We have an interesting situation where a number of commodities are pressing at sentiment extremes all at the same time. Since the S&P and Nasdaq are both US stock market indexes, it is perfectly natural for their sentiment readings to be similar. After all, the indexes are alike in that they are bundles of different shares. In the same way, you can reasonably assume that the DSI for gold and silver to be close, they are both precious metals.

On the seventh day of the seventh month in the north of Spain, you will see about 3,000 men — some old, mostly young, all brave — gather in the town of Pamplona.
They are there for the nine-day Festival of San Fermín. They are there to run with the bulls.
Running with the bulls at Pamplona isn’t for the lily-livered. Ernest Hemingway described it this way: “It’s like being shot at, and missed!”
But now, you don’t have to risk a horn though the guts to run with the bulls. What’s more, you can make a mountain of money, doing it, too.
I’m talking about the great, big, snorting bull market right in front of you …
The bull market in commodities is pawing the ground and ready to roar. Just look at this chart of the Thomson Reuters Commodity CRB Index. Or the CRB Index (NYBOT: CRB), for short.
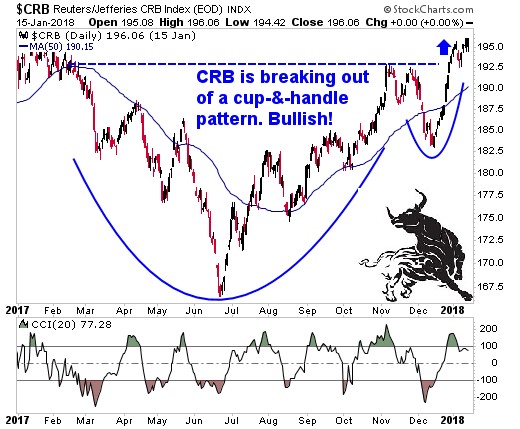
There are many kinds of bulls in Pamplona. And the CRB Index is comprised of 19 different types of commodities: aluminum, cocoa, coffee, copper, corn, cotton, crude oil, gold, wheat. But its weighted toward energy (33%).
The important point is that ALL the bulls are running. Some will run faster; some will run slower. If you can grab on to a fast bull, you can go very far indeed.
How far? This cup-and-handle pattern on the chart gives us a minimum target that is 11% higher from recent prices.
Stocks that are leveraged to commodities can do much better.
Now, what if I told you there is a massive force that is putting Tabasco under the tails of these bulls? It’s a potent mixture … one that could spur these bulls to run further and faster than many dream possible.
It’s in this chart right here …

The chart shows us that commodities haven’t been this cheap compared to stocks since 1999. A generation is 25 years. So, this is as close as we’ll get to a once-in-a-generation buying opportunity.
“Once in a Generation!” Hey, if you’re going to run with the bulls, that’s when you want to do it. When the risk/reward is tipped heavily in your favor. When those bulls are so hungry, they will roar and charge down the street like rolling thunder.
Here are some of the bulls leading the pack …
Energy Metals
I’m talking lithium and cobalt, sure. They’re the metals powering the electric vehicle (EV) revolution. But also nickel and copper. Heck, an EV car has, on average, four times as much copper wiring as an internal combustion engine (ICE) car.
We’re at the dawn of the EV age. The growth rates for both EV vehicles and demand for the metals that go into EV batteries are awesome. The International Energy Agency estimates that there will be 50 million electric vehicles on the road by 2025 … and 300 million by 2040. That’s up from closer to 2 million now.
Oil and Gas
Just because EV cars are coming in doesn’t mean gasoline-powered cars are going away. Everybody around the world wants to drive like Americans. The total number of cars — EV and ICE — is projected to DOUBLE by 2040.
Most of this growth is set to happen in emerging markets like China and India. That’s because global populations are set to rise by another 2 billion over the next 25 years, to 9.2 billion people. And the population growth is in those countries.
You know what else all those people will need? Not only energy. Air conditioners, dishwashers and TVs. Aluminum … stainless steel … copper … metals of all types.
Precious Metals
My subscribers are already riding this big, bullish trend. There is a lot more to come. A long and brutal bear market dried up exploration. That is squeezing supply. At the same time, those global population forces I mentioned are boosting demand. Now throw in geopolitical and global financial risk. This means we are looking at a price explosion in gold, silver and more.
Cannabis
Cannabis is not in the CRB Index. But it should be. I have made my subscribers a heck of a lot of money deep in the weeds.
And boy, this party is just getting started …
There is a tidal wave of legalization in the U.S., Canada, Mexico and around the world. Fortunes of a lifetime will be made in this industry in the next few years. This is my biggest, most-rampaging bull of the new bull market.
So, if all these bulls are running, you can do it on your own, right? Maybe … and maybe not.
Let’s go back to the bulls of Pamplona. One man who ran with the bulls said:
“It is madness and chaos when you’re in the run itself. You’re running with thousands of people but you’re actually only worried about what’s happening 10 feet in front of you and right around you.”
The same goes for this commodity bull market, too. If you’re too close, you can get gored. It helps to have some perspective.
That’s what I’m offering you here. I want you to run with the bulls. I DON’T want you to get trampled by the wild swings of the crowds. The madness and chaos that can shred all your hard work and money in a matter of minutes.
If you don’t listen to me, please, just listen to someone else. Get someone to keep you on the straight and narrow. Don’t get gored.
But whatever you do, don’t miss this running of the bulls. Your fortune is calling. The bulls are snorting. The race is on.
All the best,
Sean Brodrick
 Last week the U.S. Global Investors office was visited by a living legend in the junior mining industry, billionaire founder and executive chairman of Ivanhoe Mines, Robert Friedland. In case you don’t know, back in the mid-1970s, Robert was caretaker of an apple orchard south of Portland that one of his buddies from Reed College would often visit. That buddy’s name was Steve Jobs, who later went on to found a little company he named—what else?—Apple.
Before Robert and Steve Jobs began palling around, Jobs was known as shy and withdrawn. It was Robert who taught him his skills in what’s been described by many as “reality distortion.” Having seen numerous speeches by Robert over the years, I can attest to his masterful ability to utterly command a room of hundreds with his electric charisma. Some of that charisma must have rubbed off on Jobs, helping the future iPhone innovator evolve into the shrewd, larger-than-life business leader he’s celebrated as today.
Robert’s “reality distortion” was on full display during his visit. I was pleased and honored, as were my U.S. Global team members, to have the opportunity to hear his unique insights on a wide range of issues, from the debilitating smog in Delhi, India; to China’s efforts to become the world’s leading electric vehicle (EV) economy; to Ivanhoe’s development of the Kamoa-Kakula Copper Project in the Democratic Republic of Congo, independently ranked as the largest high-grade copper discovery in the world.
Robert made a very compelling case for Kamoa-Kakula, which he calls “the most disruptive Tier One copper project in the world today.” In its first year of production, its average copper grade is estimated to average an ultra-high 7.3 percent. Because the site is flat and uninhabited, and wages are paid in local currency, the cash cost for the life of the mine is projected to be a low, low $0.64 per pound of copper. As of my writing this, copper is priced at $3.20 a pound, so the margin is significant. After an initial $1.2 billion in capital costs to develop the project, the company expects a payback period of only 3.1 years.
It’s all a very attractive proposition.
Robert Friedland: You’re Going to Need a Telescope
I reminded Robert that we’re bullish on both copper and the industries it supports, including the imminent EV revolution and massive electricity demand in emerging markets, especially China and India. EVs, as I’ve pointed out before, require three to four times as much copper as traditional gas-powered vehicles. By 2027, as much as 1.74 million metric tons of copper will be needed to meet EV demand alone, up from only 185,000 tons today, according to the International Copper Association.
The red metal was one of the best performing commodities last year, surging more than 30 percent, and with investment demand near all-time highs, I predict another year of phenomenal returns. That would represent a third straight year of positive gains, something copper hasn’t accomplished this decade.
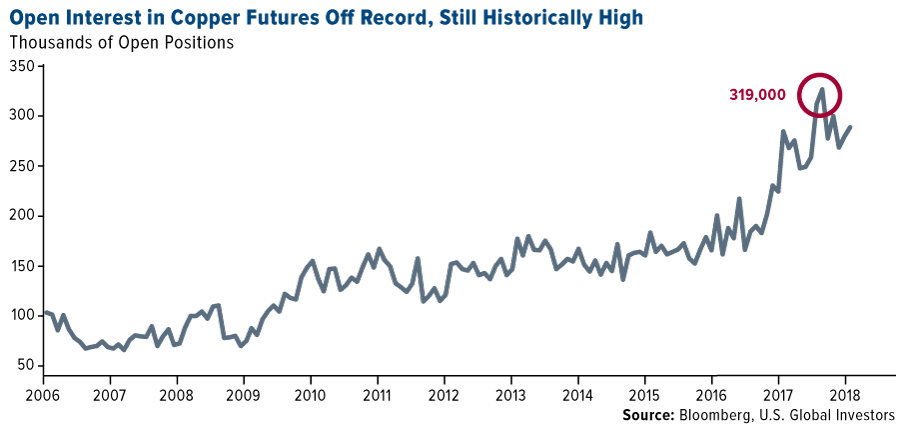
As you can see below, open interest in copper futures on the Chicago Mercantile Exchange (CME) is still historically high, even after cooling somewhat from its all-time high set in late July, when contracts hit an average 319,000 contracts. Open positions last month averaged more than 285,000, up 7.3 percent from the previous month and 26.9 percent from December 2016.
Robert expressed confidence that copper—along with aluminum, cobalt, nickel, platinum and scandium—will be among the biggest beneficiaries of the global transition to EVs and clean energy.
“You’re going to need a telescope to see copper prices in 2021,” he told us theatrically.
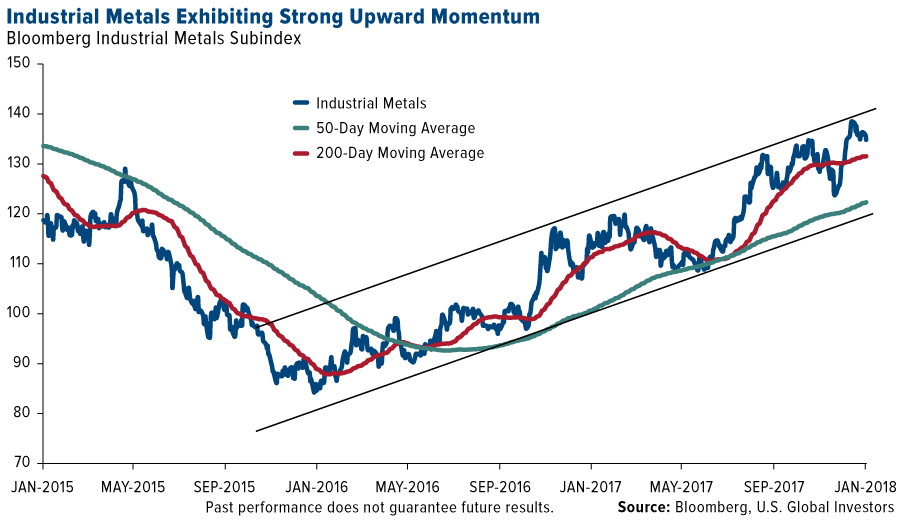
A rally is already in the works. From its recent low two years ago this month, the Bloomberg Industrial Metals Subindex, which tracks aluminum, copper, nickel and zinc, has surged more than 65 percent. Support looks strong, and copper prices could be headed even higher on global supply disruptions, as labor negotiations continue in Chile, the world’s top producer of the red metal.
“There are between 20 and 25 collective negotiations expected. If some of them lead to significant strikes, that would have a positive impact on [copper] prices,” explained Sergio Hernandez, vice president of Cochilco, Chile’s state copper commission.
Other fundamental trends are driving commodities, as I’ve noted earlier. The global purchasing manager’s index (PMI), a gauge of the manufacturing industry, is near a seven-year high. Construction confidence in the eurozone turned positive. And construction spending here in the U.S. hit $1.257 trillion in November, a new high.
China and India Cleaning Up Its Act
About half of all the copper produced globally every year is consumed by China. Last year, the Asian giant set a new record in importing the red metal. Imports climbed to a never-before-seen 17.35 million metric tons in 2017, up 2.3 percent from the previous year.

The metal is needed not just for the construction of new buildings but also to manufacture millions of new electric vehicles in the world’s largest auto market. Sometime this year, China is expected to announce when it plans to outlaw gas-powered vehicles, joining a growing number of other countries, including the U.K. (which is shooting for a 2040 ban), France (2040), Germany (2030), India (“next 13 years”) and more.
According to Bloomberg New Energy Finance, about 1,293 gigawatts per hour (GWh) are forecast for the lithium-ion battery market. That’s up spectacularly from only 19 GWh in 2015. About two thirds of the demand will come from China and the U.S.

To accommodate all these new EVs, China has pledged to build a charging station for every vehicle on the road by 2020. That equates to around 4.8 million charging outlets and stations, requiring a total investment of $19 billion. China had 190,000 charging stations at the end of September, so to call this goal ambitious is an understatement. The U.S., by comparison, has a little over 64,000 outlets and stations around the country, according to the Department of Energy.
Even William Ford Jr., Ford Motor’s executive chairman, acknowledged that the Chinese are more aggressive than most in their mission to fully embrace the electric vehicle. “When I think of where EVs are going,” Ford said in Shanghai last month, “it’s clearly the case that China will lead the world in EV development.”
Not only was China the largest importer of copper, crude oil, natural gas and other natural resources, it also outspent every other country in new clean energy capacity. The country invested as much as $132.6 billion in 2017, about 16 percent more than the U.S. and Europe combined. The government’s efforts already seem to be having a positive effect, as sales of face masks and air purifiers in Beijing have fallen dramatically compared to last winter.

Another market that’s in urgent need of clean energy is India. In Delhi, the country’s capital territory, the air quality has become so noxious and filled with heavy metals that the World Health Organization has likened it to smoking at least 50 cigarettes a day. The city’s chief minister, Arvind Kejriwal, went so far as to call it a “gas chamber.”
Shell Shelling Out for Electricity Provider
It’s not just governments seeking to diversify their energy mix. Royal Dutch Shell, the largest oil company in Europe, is steadily acquiring smaller providers of electrical power and natural gas. In December it announced a deal to buy retail energy provider First Utility. It’s just the latest in a series of purchases by large oil and gas companies looking ahead to the day when charging stations, rather than gas stations, might be the norm.
In an interview this month, Shell CEO Ben van Beurden sees the current energy transition as an opportunity.
“We have to embrace the future, and the future will include battery electric cars,” van Beurden said. “Importantly, I believe Shell can achieve this without destroying value in the company. It is about identifying real business opportunities to thrive through the energy transition.”
As my friend Robert Friedland sees it, those business opportunities lie in copper, aluminum, cobalt and other key industrial metals.
“We’re in the battery business,” he told us, adding that very little of lithium-ion batteries is actually lithium.
Racing for Bitcoin
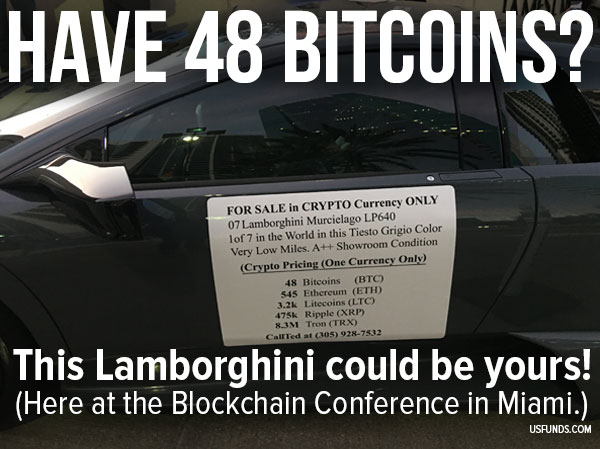
Last week I was in Delray Beach, Florida, attending the Black Diamond Investment Conference, where I was excited to see a 2007 Lamborghini Murcielago for sale. It wasn’t so much the fact that it was a Lamborghini but that the sellers were seeking payment in cryptocurrency only. In case you have 48 bitcoins lying around—valued at a little over half a million dollars at today’s price—you could be the proud new owner of a top-quality sports car. I’m pleased to see even more transactions being made in bitcoin and other cryptocurrencies.
All opinions expressed and data provided are subject to change without notice. Some of these opinions may not be appropriate to every investor. By clicking the link(s) above, you will be directed to a third-party website(s). U.S. Global Investors does not endorse all information supplied by this/these website(s) and is not responsible for its/their content.
The Purchasing Manager’s Index is an indicator of the economic health of the manufacturing sector. The PMI index is based on five major indicators: new orders, inventory levels, production, supplier deliveries and the employment environment.
The Bloomberg Industrial Metals Subindex is composed of longer-dated futures contracts on aluminum, copper, nickel and zinc. It reflects the return on fully collateralized futures positions and is quoted in USD.
Fund portfolios are actively managed, and holdings may change daily. Holdings are reported as of the most recent quarter-end. The following securities mentioned in the article were held by one or more of U.S. Global Investors Funds as of 12/31/2018: Ivanhoe Mines Ltd., Royal Dutch Shell PLC.
Who Will Take Control in Oil Market? #2
Although the EIA weekly report showed that crude oil inventories dropped for a ninth straight week and distillate stockpiles fell more than expected, U.S. production outweighed positive news. But did yesterday price action change anything in the technical picture of black gold?
Yesterday’s report showed that crude inventories dropped by 6.9 million barrels easily beating expectations for a decrease of 3.5 million barrels. This significant decline was mainly led by a record drawdown of 4.2 million barrels at the U.S. storage hub in Cushing, Oklahoma. What’s interesting, it was the largest weekly draw since 2004. Despite this bullish fact and a decline in distillate stockpiles, U.S. crude oil production rose 258,000 barrels per day to 9.75 million bpd last week, which means that the barrier of 10 million bpd could be broke quite easily in the coming week.
This also suggests that we may see short-lived moves in both directions before the release of another government report as investors may want to wait for a significant fundamental factor that would sink the price of black gold before opening big short positions.
Nevertheless, such a pro-bearish signal that could trigger a move to the downside may also be today’s Baker Hughes report. If it shows a bigger increase in the number of oil rigs, oil bears will likely react before today’s market closure or on Monday – similarly to what we saw in the past.
Before we see how the number of oil rigs changed in the recent week, let’s check how yesterday’s price action influenced the technical picture of crude oil.
Crude Oil’s Technical Picture
The long-term hasn’t changed much since our Wednesday alert was posted, therefore, if you haven’t had the chance to read about the broader perspective, we encourage you to do so today. Today, just like yesterday, we’ll focus on the daily chart (charts courtesy of http://stockcharts.com).
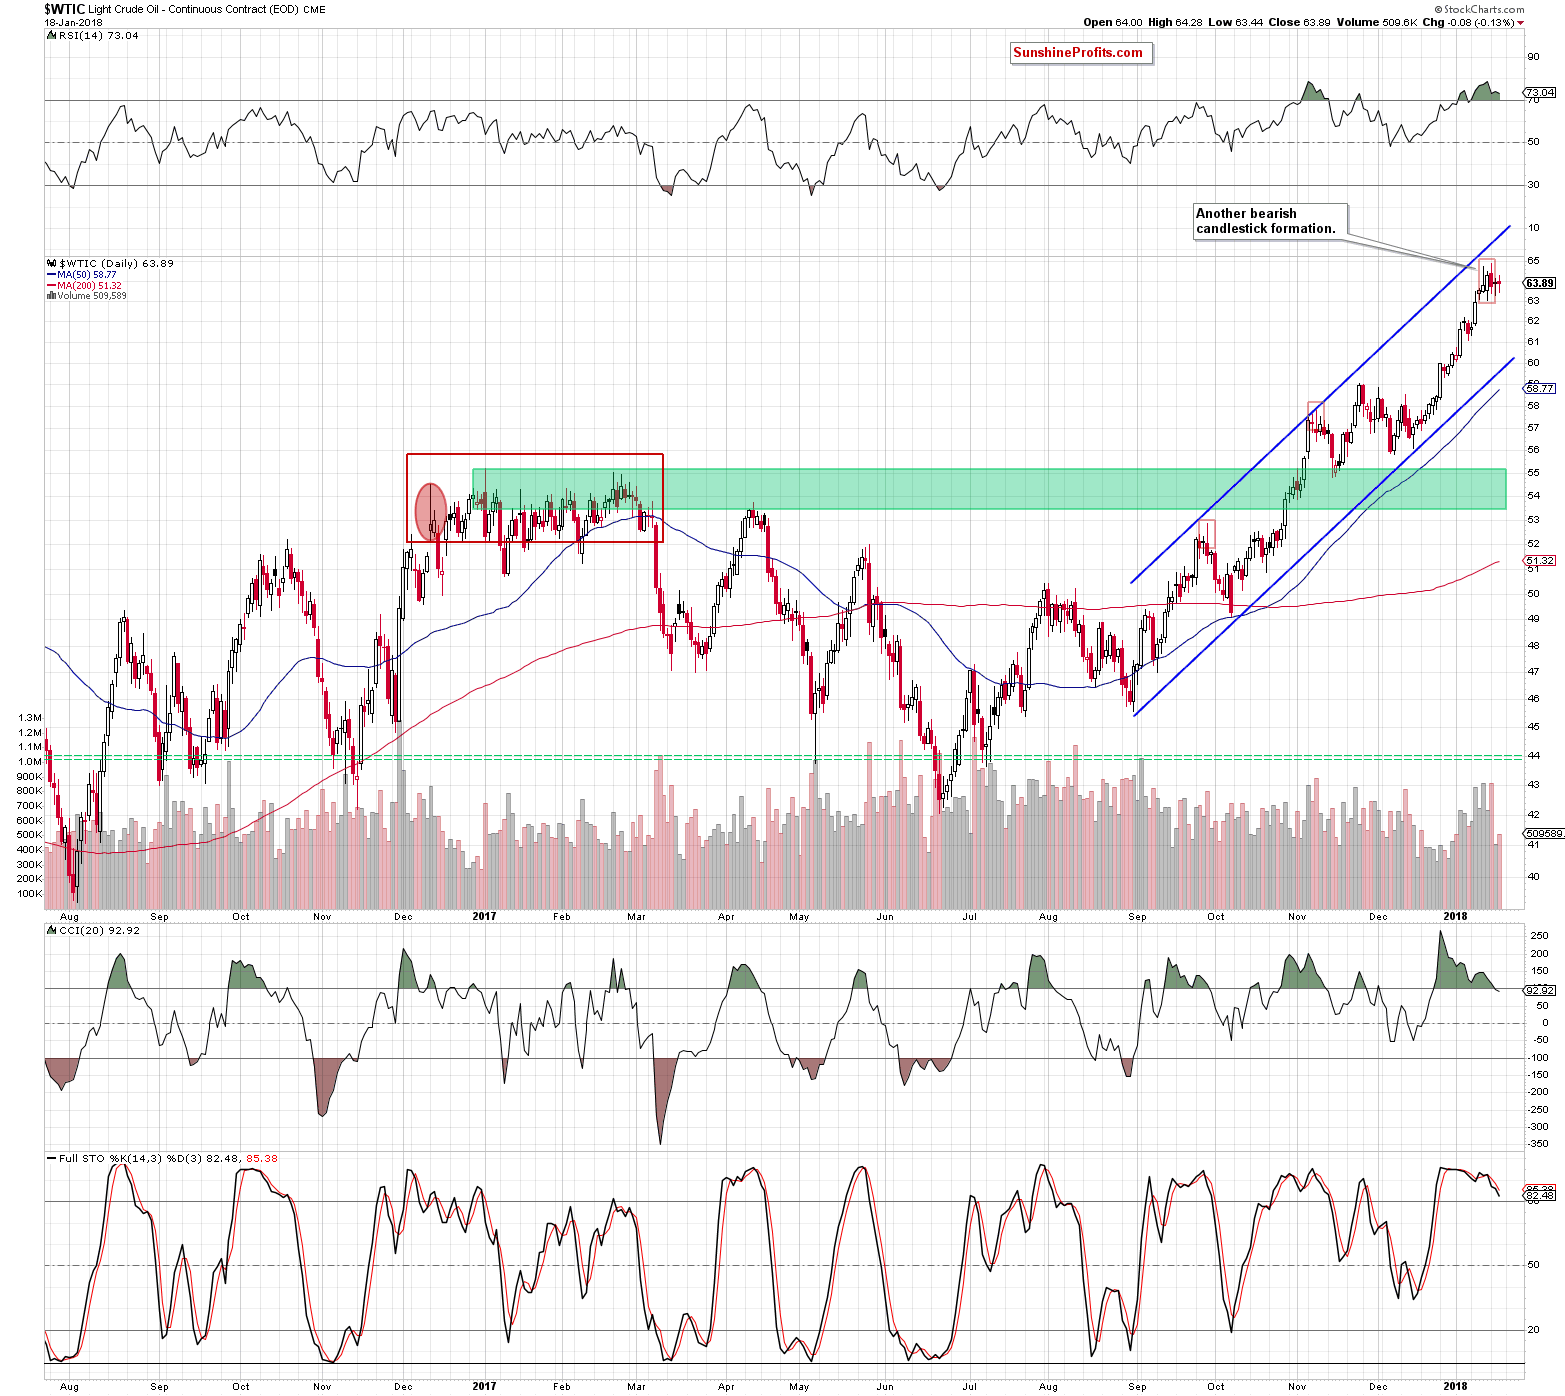
From today’s point of view, we clearly see that the overall situation in the very short term also hasn’t changed much, because crude oil wavered the second day in a row, which resulted in another doji candle. Taking this fact into account, we believe that what we wrote yesterday remains up-to-date also today:
(…) Although neither oil bulls nor oil bears show an advantage yesterday, two bearish candlestick formations remain in the cards, strengthening the resistance zone created by the 200-month moving average at $65.09. Additionally, the CCI joined the Stochastic Oscillator and generated a sale signal, giving oil bears another reason to act.
On top of that, volume was tiny compared to what we saw in the previous days, which confirms oil investors’ indecision regarding the direction of the next move. Therefore, waiting at the sidelines for more clear signals without open positions seems to be the best decision (…)
Taking into account the technical picture of crude oil, we think that oil bears have more arguments on their side to take control on the market. Nevertheless, it seems to us that as long as investors do not see a strong bearish fundamental factor (…), the price of black gold will be wavering in a narrow range under the 200-month moving average.
Finishing today’s alert, we would like to add two more comments to the technical picture of the commodity after yesterday’s session.
Firstly, the size of volume that accompanied yesterday’s price action was slightly higher than the day before, which suggests that investors could return to the market to start closing their long positions. It was not a hard sell off, because crude oil lost only 0.13% compared to the previous session, however, such price action raises doubts about the continuation of the upward move in the coming week.
Secondly, we would like to share a short note about the doji candle with you. If the market moves in a horizontal trend or potential decreases (just like in our case) are only in the initial phase, the doji candle is not very important. However, if the doji appears on the chart after a long upward or downward trend, there is a high probability that we will see a pullback or even a reversal of the current trend in the near future.
If you enjoyed the above analysis and would like to receive daily premium follow-ups, we encourage you to sign up for our Oil Trading Alerts. Sign up today.
Thank you.
Nadia Simmons
Forex & Oil Trading Strategist
Przemyslaw Radomski, CFA
Founder, Editor-in-chief, Gold & Silver Fund Manager

-
I know Mike is a very solid investor and respect his opinions very much. So if he says pay attention to this or that - I will.
~ Dale G.
-
I've started managing my own investments so view Michael's site as a one-stop shop from which to get information and perspectives.
~ Dave E.
-
Michael offers easy reading, honest, common sense information that anyone can use in a practical manner.
~ der_al.
-
A sane voice in a scrambled investment world.
~ Ed R.
Inside Edge Pro Contributors

Greg Weldon

Josef Schachter

Tyler Bollhorn

Ryan Irvine

Paul Beattie

Martin Straith

Patrick Ceresna

Mark Leibovit

James Thorne

Victor Adair