
….also from Gary: Stock Market Update
Energy & Commodities

HOUSTON (Reuters) – Surging shale production is poised to push U.S. oil output to more than 10 million barrels per day – toppling a record set in 1970 and crossing a threshold few could have imagined even a decade ago.
And this new record, expected within days, likely won’t last long. The U.S. government forecasts that the nation’s production will climb to 11 million barrels a day by late 2019, a level that would rival Russia, the world’s top producer.
The economic and political impacts of soaring U.S. output are breathtaking, cutting the nation’s oil imports by a fifth over a decade, providing high-paying jobs in rural communities and lowering consumer prices for domestic gasoline by 37 percent from a 2008 peak.
Fears of dire energy shortages that gripped the country in the 1970s have been replaced by a presidential policy of global “energy dominance.”
also from Reuters:
Strong China data cranks up pressure on bond markets – Global Borrowing Costs at 10 month High

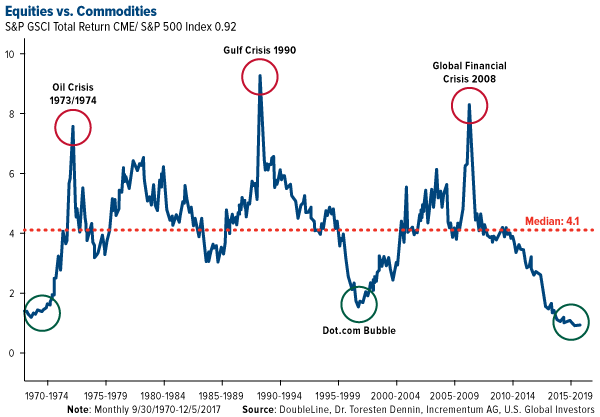
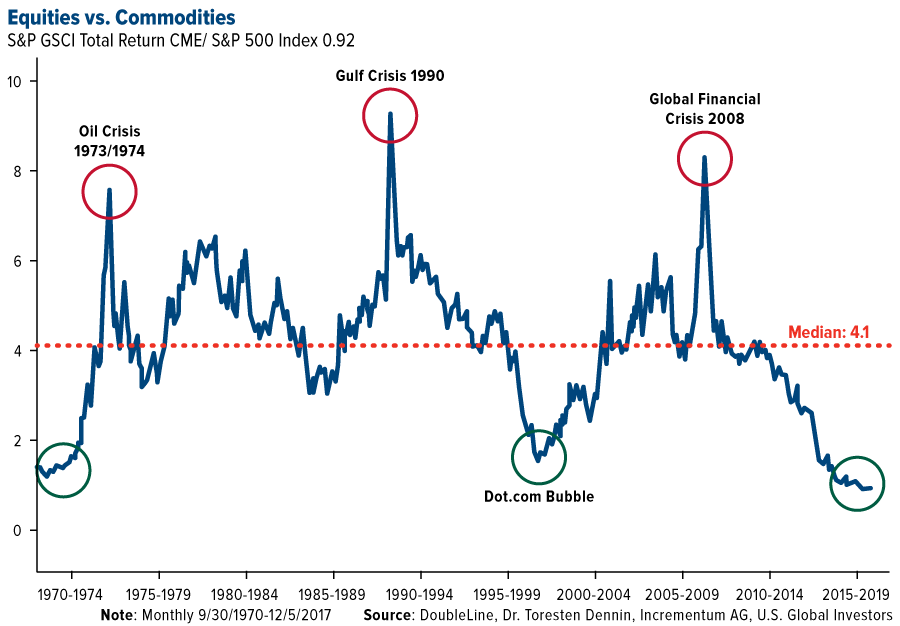
Ed Note: With US Dollar breaking to multi-year lows and the 37 Year old Bull Market in Bonds set to go bearish there is going to be dramatic changes in where money flows. Based on previous booms and busts, the S&P GSCI Total Return Index-to-S&P 500 Index ratio above is now at its lowest point since the dotcom bubble, meaning commodities and mining companies are highly undervalued relative to large-cap stocks. I think its highly likely that in the Stock Market the more glamorous sectors like Biotech, Cannabis, Cryptocurrencies and the FANGS, etc. will likely give way stocks that have significant exposure to commodities. Money Talks Ed.
Recipe Calls for a Broad Commodities Rally in 2018
At the beginning of every year, we update what’s typically one of our most popular pages, the Periodic Table of Commodity Returns. I encourage you to explore 10 years’ worth of data on basic materials such as aluminum, zinc and everything in between. A word of warning, though—the interactive feature makes the table highly addictive. Please feel free to share it with friends and family!

It was a photo finish for commodities in 2017. The group, as measured by the Bloomberg Commodity Index, barely eked out a win for the second straight year, edging up 0.7 percent. Spurred by a weaker U.S. dollar and strengthening materials demand from factories, the index headed higher thanks to a breathtaking rally late in the year that lasted a record 14 consecutive days.
The annual return might not look too impressive, but I believe the economic conditions are ripe for a broad commodities rally in 2018. I’m not alone in predicting they’ll be among the best performing asset classes by year end, perhaps even beating domestic equities as quantitative tightening threatens to put a damper on the nine-year bull run.
Analysts at Goldman Sachs, for instance, are overly bullish commodities, recommending an overweight position for the next 12 months. Bank of America Merrill Lynch is calling for a $7,700-a-tonne copper price target by mid-2018, up from $7,140 today. In last Friday’s technical market outlook, Bloomberg Intelligence commodity strategist Mike McGlone writes that the “technical setup for metals is similar to the early days of the 2002-08 bull market.” Hedge fund managers are currently building never-before-seen long positions in heating oil and Brent crude oil, which broke above $70 a barrel in intraday trading Thursday for the first time since December 2014. It’s now up close to 160 percent since its recent low of $27 a barrel at the beginning of 2016.
Few have taken such a bullish position, though, as billionaire founder of DoubleLine Capital Jeffrey Gundlach, whose thoughts are always worth considering.
Commodities Ready for Mean Reversion?
Last month I shared with you a chart, courtesy of DoubleLine, that makes the case we could be entering an attractive entry point for commodities, based on previous booms and busts. The S&P GSCI Total Return Index-to-S&P 500 Index ratio is now at its lowest point since the dotcom bubble, meaning commodities and mining companies are highly undervalued relative to large-cap stocks. We could see mean reversion begin to happen as soon as this year, triggering a commodities super-cycle the likes of which we haven’t seen since the 2000s.
Gundlach has more to say on this subject. During his annual “Just Markets” webcast, he told investors that “commodities will outperform in 2018” because they “always rally sharply—much more sharply than they have so far—late in the business cycle as we head into a recession.”
Speaking to CNBC, he added that the S&P 500 “may go up 15 percent in the first part of the year, but I believe, when it falls, it will wipe out the entire gain of the first part of the year with a negative sign in front of it.”
Gundlach might be in the minority here, but it’s hard to ignore the tell-tale signs that we’re approaching the end of the business cycle, as I’ve pointed out before. We’ve begun a new interest rate hike cycle, both here in the U.S. and the United Kingdom. The Federal Reserve has started to unwind its massive balance sheet. The Treasury yield curve continues to flatten. And the S&P 500 just had its least volatile year on record.
All of these indicators, among others, have historically preceded a substantial market correction.
In his 2018 outlook, David Rosenberg, chief economist and strategist at Canadian wealth management firm Gluskin Sheff, makes similar observations, writing that “it is safe to say that we are pretty late in the game.”

How late? After looking at a number of market and macro variables, Rosenberg and his team concluded that we’re about “90 percent through, which means we are somewhere past the seventh inning stretch in baseball parlance but not yet at the bottom of the ninth.”
Look for mean reversion this year, Rosenberg adds, “which would be a good thing in terms of opening up some buying opportunities.”
Resource stocks, I believe, could be an attractive place to look, as they’ve traditionally outperformed in the last phase of an economic cycle.
Manufacturing and Construction Booms Underway
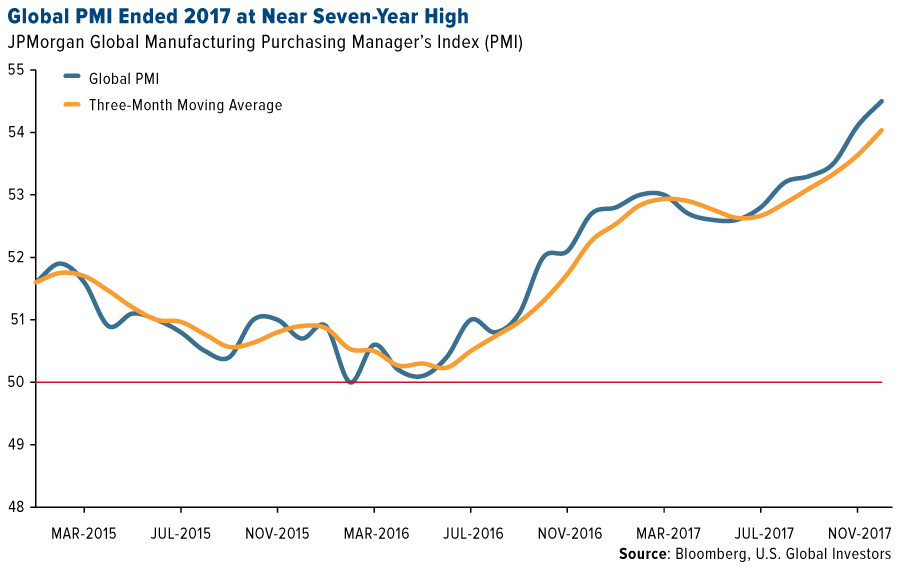
You don’t have to bet on a recession to be bullish on commodities. The dollar appears to have peaked, making materials less expensive for overseas markets, and the Global Manufacturing Purchasing Manager’s Index (PMI) ended 2017 at 54.5, close to a seven-year high. The sector has been in expansion mode now for the past 22 months, with the eurozone signaling its fastest growth in the series’ two-decade history.
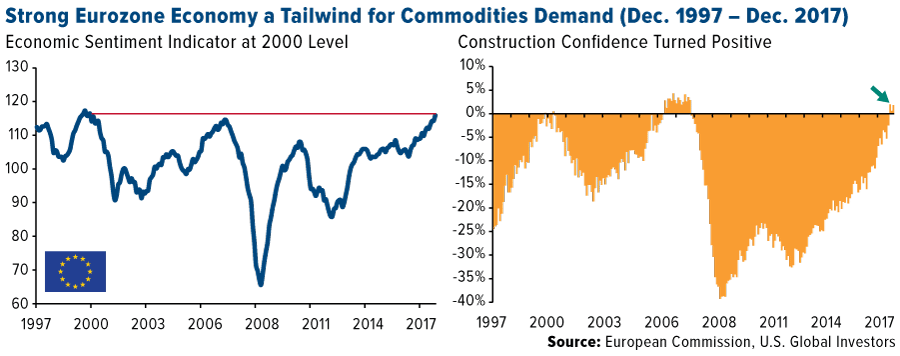
That’s not the only constructive news out of Europe. The European Commission’s headline economic sentiment indicator jumped more than economists had anticipated in December, ending the year at a 17-year high. Construction confidence in the eurozone also looks as if it’s fully recovered and is trending in positive territory for the first time since the financial crisis.
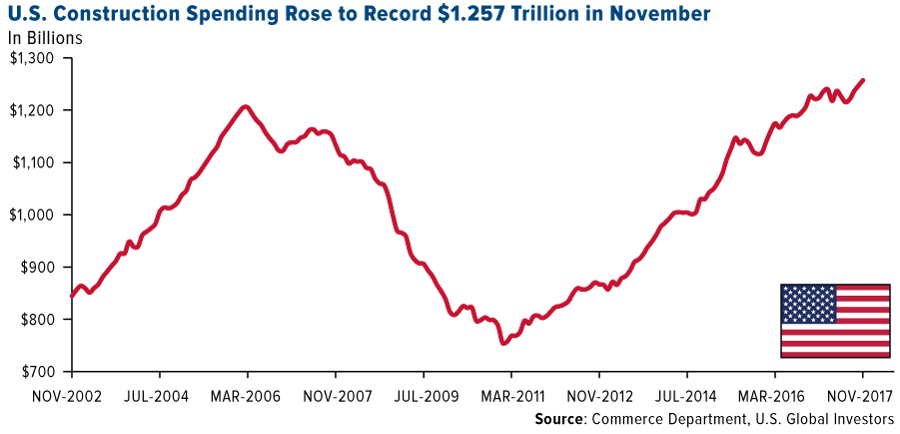
Strong manufacturing and construction expansion here in the U.S. is likewise supportive of commodity prices. December’s ISM Manufacturing PMI clocked in at a historically high 59.7. New orders grew 5.4 percent from the precious month to 59.4, its highest reading since January 2004. What’s more, U.S. construction spending in November rose to an all-time high of $1.257 trillion, according to this month’s report from the Census Bureau.
Which Commodities Are Set to Rally the Most?
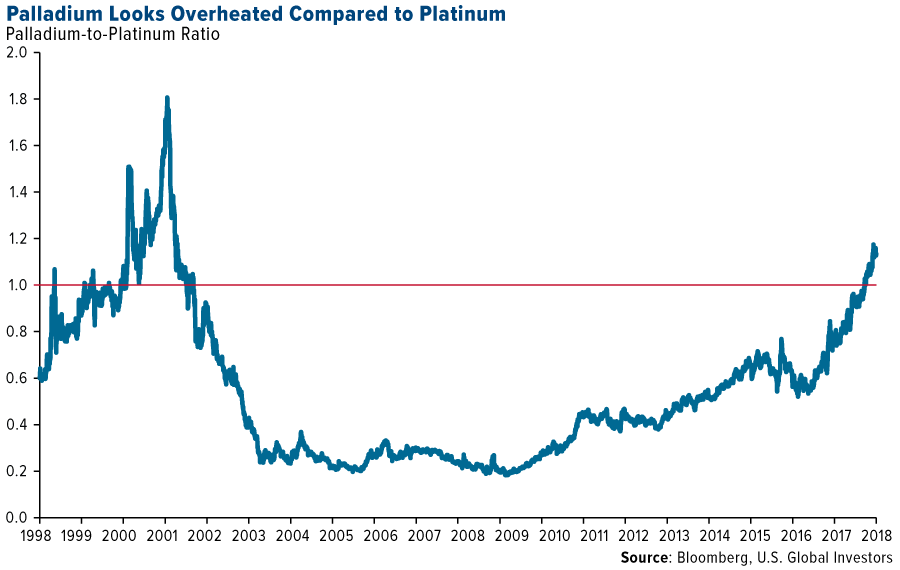
Palladium was the best performing commodity of 2017, climbing more than 56 percent on a weaker dollar, concerns of a supply crunch and a robust global auto market. Along with its sister metal, platinum, palladium is used primarily in the production of catalytic converters, which curb emissions from gasoline-powered vehicles.
For the first time since 2001, palladium traded higher than platinum beginning in September, and the week before last it hit an all-time intraday high of $1,099 an ounce. A healthy correction at this point wouldn’t be surprising, as the metal’s looking overbought compared to platinum.
“Pressured by diesel-emission scandals, platinum appears too low vs. palladium,” writes Bloomberg’s Mike McGlone. We might be in for another price reversal this year.
As I wrote recently, gold’s Fear Trade growth drivers are firmly in place. If a “Fed rally” occurs similar to the past two rallies, we could see gold climb to as high as $1,500 an ounce by summer. We also have the Chinese New Year to look forward to, which falls on February 16.
I believe 2018 could also be silver’s year to shine. The white metal rose 6.42 percent in 2017, with Indian silver bullion imports jumping an amazing 90 percent compared to imports the previous year, according to Metals Focus. Goldman Sachs analysts point out that silver has historically fared better than gold near the end of the business cycle, “as it is more strongly leveraged to global growth, given its significant industry use.”
A recent online survey conducted by Kitco News found that nearly 40 percent of respondents believed silver would outperform in 2018, compared to four other metals. Twenty-seven percent of readers said gold would outperform, followed by a quarter for copper. About 10 percent were most bullish on either platinum or palladium.
Highlights:
Base metals had a strong finish in 2017, a year when the copper and zinc prices increased by over 30%, the highest in over 3 years for copper and in 10 years for zinc. Nickel also outperformed, rising by 28%. The performance in 2017 was underpinned by supply disruptions for copper, lack of production growth for zinc, and declining global inventories, within the context of a positive outlook for Chinese, and global growth.
- Strong copper demand in 2018. It is estimated that China’s copper demand (which accounts for around 50% of global copper demand of 23.5Mt) could grow by up to 3% in 2018, from around 2% in 2017. Codelco, Chile’s state-owned copper miner, sees a sustained increase in copper deficits, supported by growing copper deficits. As a result, the company says the copper price may test records above $10,000/t ($4.50/lb) in 2018.
- Potential for supply tightness. Over 30 labour contracts, covering 5Mt of mine supply of copper are due to expire in 2018, mostly in Chile and Peru. Notably, the Escondida contract expires in June. In China, scrap import restrictions and closures related to winter pollution will contribute to tightness in the copper market.
- Zinc continues to have the best fundamentals among the base metals. Global zinc stocks were down 59% in 2017, ending the year at 8.2 days of consumption. Chinese zinc imports increased by 43% in the first 11 months of 2017, and continue to be strong.
- Outlook is positive. We expect strong global manufacturing output, supported by resilient European and U.S. PMIs, as well as sustained metals demand from China to provide further impetus for a metals rally in 2018Weekly Performance.

Precious metals had a strong start to the year, with the price if gold rising above the $1,300 on December 29th amid a falling U.S. dollar and the prospects of another interest rate hike less following worse-than-expected payroll data this morning. This follows a positive 2010 for precious metals with gold (up 11%) and silver (up 4%) finishing at $1,3XX and $17.XX per ounce respectively. Palladium soars. Platinum prices rose almost 50% on the back of robust demand for catalytic converters and limited supply. Palladium prices tested the $1,100 per ounce level on Thursday, with some commentators speculating it could overtake gold, before settling at $1,090 (up X%) on Friday. In contrast, platinum prices finished the year where they began at $907 per ounce
….click here for the full report
2018 has so far brought in the highest price of crude oil since late 2014 (chart 1), but we shouldn’t be surprised by the price action. Indeed, ignoring geopolitics for a moment, the fundamental picture for the crude markets haven’t been this favorable in years. As we will see, from inventory levels, to the US dollar, to economic growth, to the setup in the futures markets, most signs are pointing to higher oil prices ahead.

One of the main drivers of oil prices is the relationship between production, consumption and inventory levels. As chart 2 shows, crude production in the US has recovered to mid-2016 highs, which in and of itself would be bearish for crude prices. But, the total inventory of crude has been falling over that period and now stands at the lowest level in 2.5 years. Chart three depicts total crude inventories (ex the strategic petroleum reserve) plotted with the blue line on the left, inverted axis, overlaid on the price of oil on the right axis (red line). Furthermore, oil consumption has remained strong too. The combination of lower stocks and growing demand has caused the days supply of oil to drop from 34 a year ago to just 25 now. Chart four shows the price of crude on the left axis (blue line) overlaid on the days supply of oil on the right, inverted axis (red line). These two series are highly inversely correlated, so a contracting days supply should result in higher prices. As we will see later, a continuation of this trend is likely.

The gold:oil ratio has been trending in favor of oil for a number of months. I look for this trend to reverse soon in favor of gold.

https://blog.smartmoneytrackerpremium.com/

-
I know Mike is a very solid investor and respect his opinions very much. So if he says pay attention to this or that - I will.
~ Dale G.
-
I've started managing my own investments so view Michael's site as a one-stop shop from which to get information and perspectives.
~ Dave E.
-
Michael offers easy reading, honest, common sense information that anyone can use in a practical manner.
~ der_al.
-
A sane voice in a scrambled investment world.
~ Ed R.
Inside Edge Pro Contributors

Greg Weldon

Josef Schachter

Tyler Bollhorn

Ryan Irvine

Paul Beattie

Martin Straith

Patrick Ceresna

Mark Leibovit

James Thorne

Victor Adair