Energy & Commodities

Copper Outlook at Critical Juncture & Implications For The Silver Price

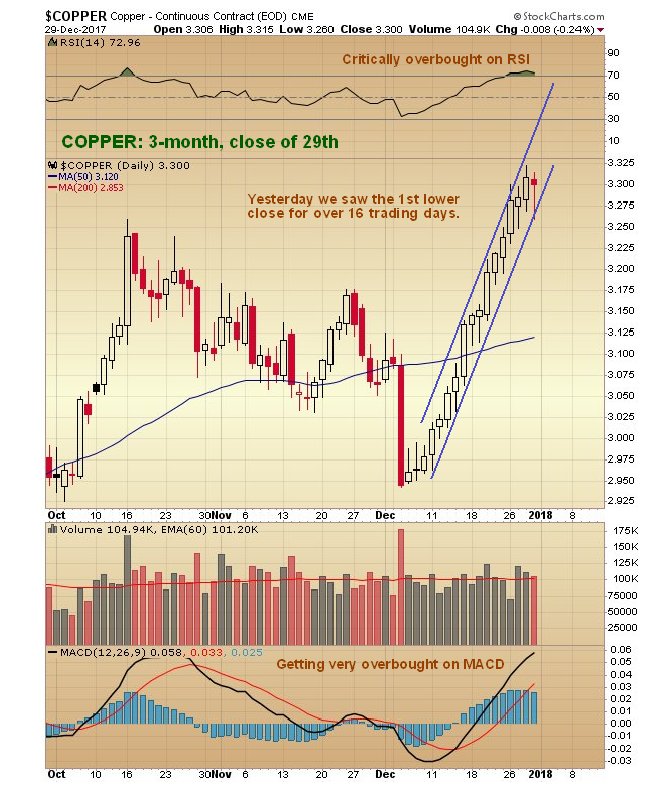
We have seen an unusually steady uptrend in copper this month, that has resulted in it appreciating by about 10%, which might not sound like much, but makes a big difference if you are a producer with fixed costs. What is remarkable about this uptrend is not only that it came hard on the heels of a high volume smackdown in the early days of the month that at the time looked bearish, but that we have seen 16 days trading days in a row of higher closes as of the close of trading on Thursday, as can be seen on the 3-month chart for copper shown below. After doing some extensive research it has been discovered that the fundamental reason for this day after day seemingly interminable uptrend was that a prominent Chinese buyer, who has an old fashioned way of doing things, was walking over to the London Metals Exchange every day for weeks with his black briefcase in hand and buying roughly the same amount of copper… 

copper3month301217

But sadly, on Friday, he was run over by a London bus whilst on his way to the exchange, and was thus unable to buy and the price dipped for the first time in a long while… 

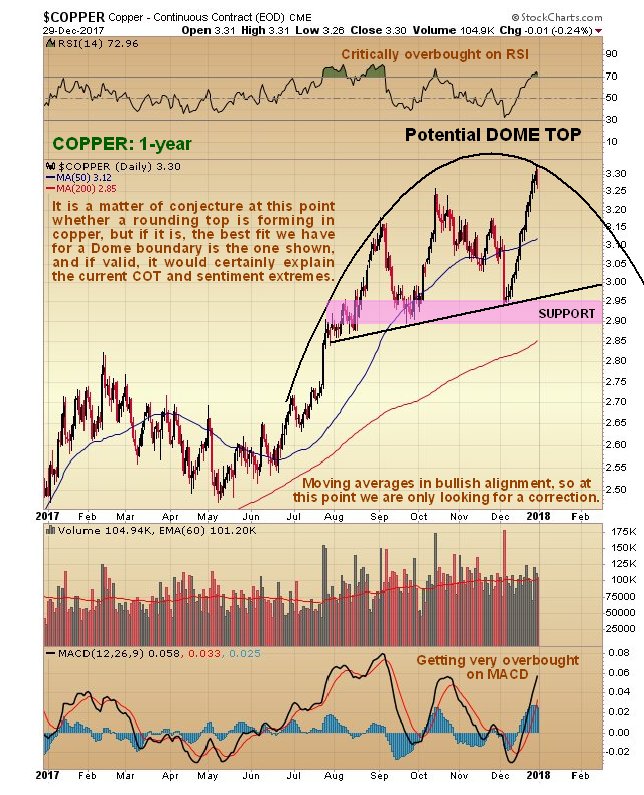
We will now zoom out to look at copper on its latest 1-year chart. On this chart we can see that, while copper still has not broken down from its steep uptrend in force all this month, it is getting very overbought on its MACD and RSI indicators and is quite a long way ahead of its 200-day moving average, and these factors, taken together with the now extreme COT structure and sentiment indicators that we will look at shortly, suggest a high chance that it will go into reverse here or very soon and react back. 

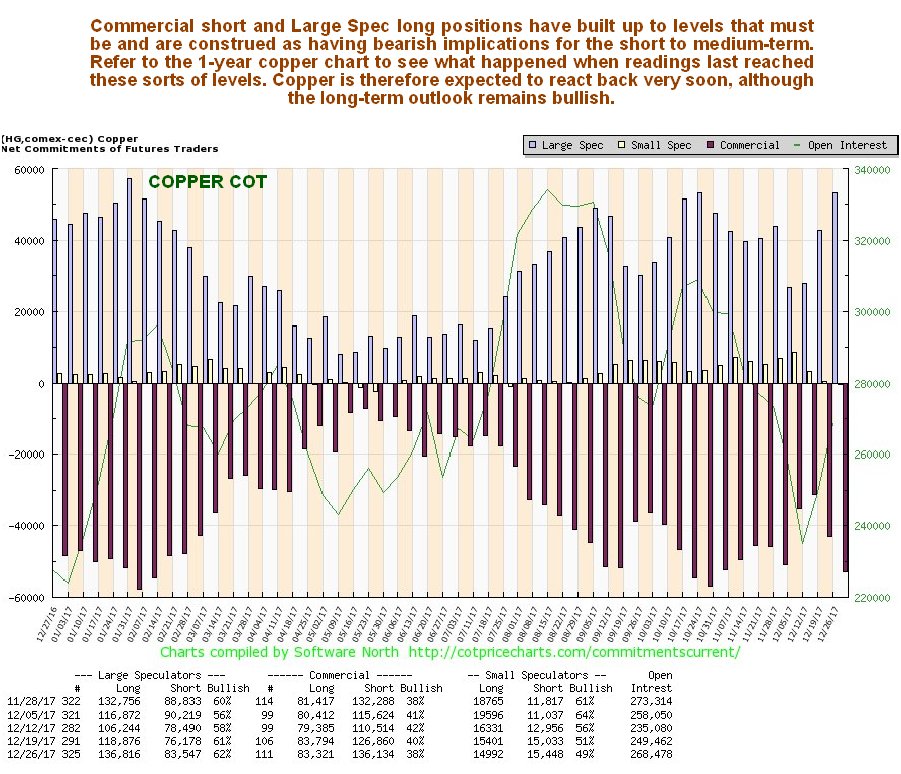
Next we will look at copper’s latest COT chart, which, since it also goes back a year, can be directly compared to the 1-year copper chart above. As we can see, Large Spec long positions are very close to their highs of the past year, and when they have reached these sorts of levels in the past, a reaction back by copper reaction has ensued, and a reaction is made more likely given the factors that we have observed on copper’s 1-year chart, and the sentiment extremes which now exist that we will look at next. 

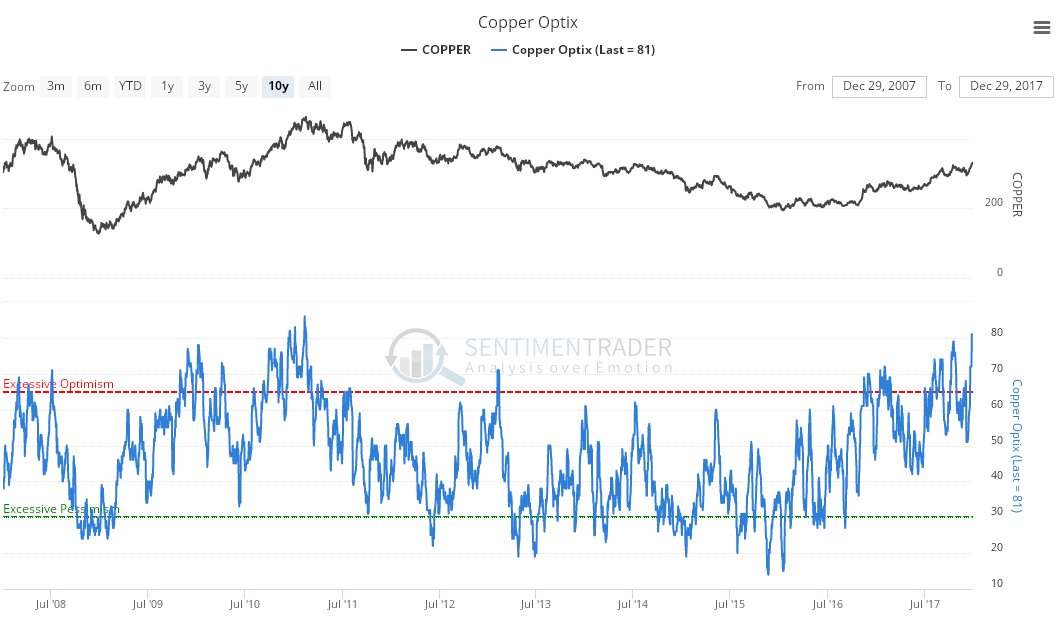
Click on chart to popup a larger clearer version. On the latest copper optix, or optimism chart, we can see that bullish sentiment towards copper is at the sort of wild extremes that we have only seen once before in the last 10 years, and that coincided with a major top. This is not to say that it does this time, but it would certainly seem to indicate a high probability that we are at or close to a significant intermediate (medium-term) top. 

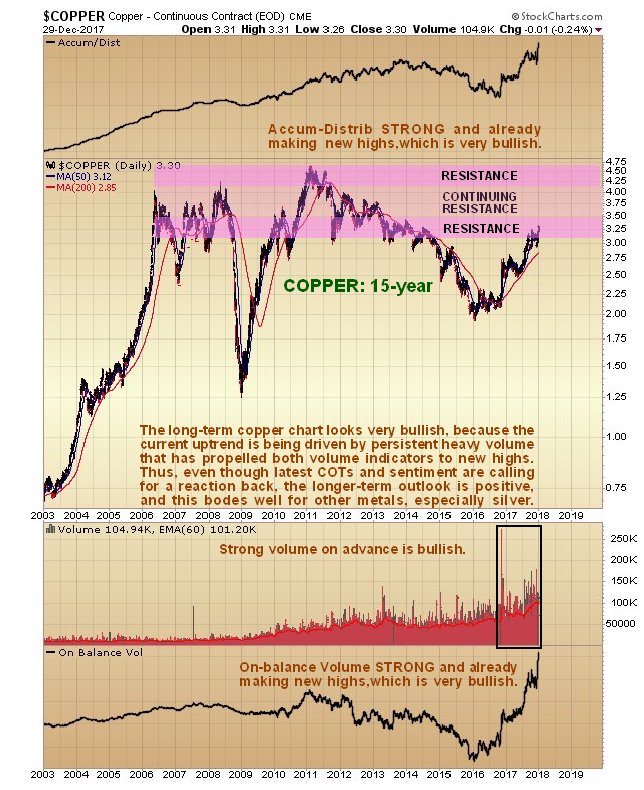
Click on chart to popup a larger clearer version. Chart courtesy of sentimentrader.comThe long-term chart for copper actually looks very bullish, because the bullmarket that began in October 2016 has been driven by record strong upside volume, which has propelled both volume indicators to clear new highs. What this suggests is that, while the other factors that we have already looked at, allied with the considerable resistance approaching the old peaks that we can delineate on this chart, will probably force a reaction back soon, the longer-term outlook remains favorable, with a high probability that copper will eventually proceed to break out to new all-time highs, i.e. get above even its 2011 peak in the $4.60 area. If that happens its rate of rise can of course be expected to accelerate. 

Whilst a detailed look at the copper price technicals may seem like a waste of time to some of you, given all the other subject matter for such analysis, it is important to keep in mind that we are not looking at copper for its own sake, we are looking at it because of its implications for the economy generally, and especially because of its implications for the outlook for the prices of other metals, especially silver. What we are seeing on these copper charts, principally its long-term chart, bodes very well indeed for the future trend of silver prices. End of update. 

Posted at 1.20 pm EST on 30th December 17.

What Drove WTI Above $60?

Screen Shot 2018-01-02 at 7.05.17 AM

WTI briefly broke above $60 per barrel on news that a pipeline in Libya exploded, knocking a sizable portion of supply offline.

The oil pipeline carries crude oil to the Es Sider oil export terminal, Libya’s largest, raising fears of a dramatic supply outage. Early reports suggest that the explosion was the result of an attack by militants, although the precise cause was unclear.

However, Libya’s National Oil Company said that the incident will curtail output by 70,000 to 100,000 bpd – not a trivial amount of supply, but not the nightmare scenario that some oil traders may have feared. The National Oil Company said that Waha Oil Co. “has immediately diverted production to the Samah line,” which will help keep oil flowing. “However, NOC expects a reduction in production of [between] 70,000 to 100,000 barrels a day,” the statement said, according to S&P Global Platts.

The Es Sider terminal was one of the main export facilities that suffered disruptions in recent years, and its return to operation is what has helped Libya ramp up oil production and exports, restoring shipments to 1 million barrels per day (mb/d) from less than half of that a little more than a year ago.

The outage is not catastrophic, but Brent prices jumped more than 2.5 percent on the news, closing in on $67 per barrel, while WTI topped $60 per barrel for the first time in more than two and a half years.

Related: The Biggest Factors In Future Oil Production

The jolt to prices speaks a lot to how psychology can move the market. After all, the amount of supply knocked offline in Libya is about equivalent to the volume added to the global market from U.S. shale in just the past few weeks. And despite the U.S. adding supply in such a short amount of time, prices have posted gains since the start of December. The markets have priced in gains from shale, but they haven’t priced in unexpected outages.

The disruption in Libya, as long as the size of the volume knocked offline stays at the 100,000-bpd level, probably won’t have a major effect on the oil market. Indeed, prices fell back after it became clear that the disruption was as small as it is.

But the market jitters are magnified by the fact that the oil market is a lot tighter than it used to be. Inventories have dramatically declined, and are sitting roughly 100 million barrels above the five-year average, less than a third of the peak surplus the market saw last year. An outage in Libya could help accelerate the rebalancing process, depending on how long it takes for the pipeline to see repairs.

It also comes on the heels of a roughly 400,000-450,000 bpd outage in the North Sea because of the crack in the Forties pipeline. Moreover, a string of geopolitical events in the second half of 2017 acted as price catalysts, a notable change after about three years during which no amount of unrest was able bother oil prices at all.

Related: Goldman: Oil Markets To Balance Sooner Than Expected

These incidents highlight the unforeseen risks to supply, although in the case of the latter, repairs are expected to be completed in the next few days with a full return to operation of the Forties pipeline expected in January. “Oil markets got a real big reminder of all the different things that can and will drive prices—from investor flows to geopolitics to unplanned disruptions pipelines and refineries,” Michael Wittner, global head of oil research at Société Générale, told the WSJ, referring to the reemergence of geopolitical risk.

Investors trading in oil futures are starting to show some signs of nervousness, which makes incidents like the Libya outage important. Hedge funds and other money managers trimmed their net-length in WTI futures for the week ending on December 19, the third consecutive week of a decline.

The outage in Libya could stave off a further liquidation of bullish bets, but the return of the Forties pipeline might also pose downside risk. There is “some worry about what next month is going to bring,” John Kilduff, founding partner at Again Capital LLC told Bloomberg. “There’s not as much enthusiasm about the OPEC/non-OPEC accord as there was even a few weeks ago.”

By Nick Cunningham of Oilprice.com

More Top Reads From Oilprice.com:


Top 5 Mining Stocks To Watch In 2018

Summary

This article introduces five mine developers that are realistically able to generate significant gains for their shareholders in 2018.

Although all of the stocks are exposed to various risks, the risks are far outweighed by the potential gains.

Companies featured in the Top 5 for 2018 are focused on gold, copper, platinum group metals, zinc, and uranium.

Last year I published an article named “Top 5 Mining Stocks to Watch In 2017” where I listed 5 interesting miners and mine developers that were expected to bring some nice gains to their shareholders. As the article was very successful, this year I decided to write the 2018 version. I know that there are definitely some other companies with high potential that could have been considered for inclusion into the Top 5. Please feel free to mention them in the comments section.

5. Ivanhoe Mines (OTCQX:IVPAF)

In “Top 5 Mining Stocks to Watch In 2017”, I picked Ivanhoe Mines as No. 1. And it hasn’t disappointed, as its share price has grown almost by 85%. Given its three world-class projects and the continuing flow of great exploration results, there is still a lot of upside potential left for this company. And although I don’t expect it to record another 85% gains in 2018, there should be further exciting events that will make Ivanhoe Mines an exciting investment for the coming years.

13760932-1514468840473021 origin

….continue reading HERE

….also from Seeking Alpha:

Dow 50,000 By 2024

Miners Are At Another Inflection Point

For those that follow me regularly, you will know that I have been tracking a set up for the VanEck Vectors Gold Miners ETF (NYSEARCA:GDX), which I analyze as a proxy for the metals market. I believe that the GDX can outperform the general equity market once we confirm a long term break out has begun, and I think we can see it in 2018.

Recent price action

In early December, we identified a specific 20.89-21.26 support region, which, if held, could begin that major 3rd wave break out and rally we have been awaiting. But, since it would mean that this 2nd wave would have completed in an unorthodox manner, I noted that I would need to see confirmation that the market has truly bottomed.

Two weeks ago, I warned you to be prepared for large moves in the market, and the market has certainly given us a bit of excitement.

sc

As we now know with the benefit of hindsight, the GDX bottomed at 21.27 (within a penny of our support), and began a rally which came within pennies of our first resistance region of 22.30 before it pulled back. Last weekend, I noted in my weekend market analysis to the members of The Market Pinball Wizard that the market was likely set up to continue higher, since the pullback looked corrective off the 22.30 region. During this past week, I presented my members with the set up for the market to rally to an ideal target of 22.85, and, as the close of the week, the market struck a high so far of 22.92.

(While I have been doing this for many years, I can honestly say I am still amazed at the accuracy of the turning points that Elliott Wave, coupled with our Fibonacci Pinball method, is able to provide us time and again, as we bottomed within one penny of our noted IMPORTANT support level, and the rallied to within pennies of our noted resistances.)

Anecdotal and other sentiment indications

So, after providing public analysis or over 6 years, I am still quite amazed at how accurately mathematics can identify turning points in the market. And, yes, this even applies in the metals market, about which everyone yells and screams is so manipulated.

If it was truly as manipulated as people claim, then what we have done in this market would be completely impossible, unless we were the manipulators. Yet, those that are so certain the market is manipulated always seem to be on the wrong side of price when making their claims. You would think that they would put their money on the side of the market which they believe is manipulated rather than complaining so much about it. But, I digress.

You see, markets are driven by the same natural progression and regression we see throughout all of nature. While we love to believe we understand their movements through some understanding of what we believe to be the “fundamentals” of the market, those fundamentals have all too often left investors holding the bag at the major market turns. And, for those that want to be honest with themselves, you would recognize that investors were exceptionally bullish as we were striking the 2011 highs, and exceptionally bearish as we were striking the 2015 lows due to their perspective of the fundamentals of the metals market.

As I have said so many times in so many different ways, the metals market is directed by the tone of overall investor sentiment more so than anything else. And, I am often asked what I mean by that. So, allow me to present you some insight on the topic.

R.N. Elliott, the one who discovered Elliott Wave analysis, wrote almost 90 years ago:

No truth meets more general acceptance than that the universe is ruled by law. Without law, it is self-evident there would be chaos, and where chaos is, nothing is . . . Man is no less a natural object than the sun or the moon, and his actions, too, in their metrical occurrence, are subject to analysis . . . Very extensive research in connection with . . human activities indicates that practically all developments which result from our social-economic processes follow a law that causes them to repeat themselves in similar and constantly recurring serials of waves or impulses of definite number and pattern. . . The stock market illustrates the wave impulse common to social-economic activity . . . It has its law, just as is true of other things throughout the universe. . .

“The causes of these cyclical changes seem clearly to have their origin in the immutable natural law that governs all things, including the various moods of human behavior. Causes, therefore, tend to become relatively unimportant in the long term progress of the cycle. This fundamental law cannot be subverted or set aside by statutes or restrictions. Current news and political developments are of only incidental important, soon forgotten; their presumed influence on market trends is not as weighty as is commonly believed.”

Bernard Baruch, an exceptionally successful American financier and stock market speculator who lived from 1870– 1965, identified the following long ago:

All economic movements, by their very nature, are motivated by crowd psychology. Without due recognition of crowd-thinking … our theories of economics leave much to be desired. … It has always seemed to me that the periodic madness which afflicts mankind must reflect some deeply rooted trait in human nature — a trait akin to the force that motivates the migration of birds or the rush of lemmings to the sea … It is a force wholly impalpable … yet, knowledge of it is necessary to right judgments on passing events.

During his tenure as chairman of the Federal Reserve, Alan Greenspan testified many times before various committees of Congress. In front of the Joint Economic Committee, Green- span noted that markets are driven by “human psychology” and “waves of optimism and pessimism.” Ultimately, as Greenspan correctly recognized, it is social mood and sentiment that moves markets.

Social experiments have actually been conducted which resulted in price patterns that mirror those found in the stock market. In 1997, the Europhysics Letters published a study conducted by Caldarelli, Marsili and Zhang, in which subjects simulated trading currencies, however, there were no exogenous factors that were involved in potentially affecting the trading pattern. Their specific goal was to observe financial market psychology “in the absence of external factors.”

One of the noted findings was that the trading behavior of the participants were “very similar to that observed in the real economy,“ wherein the price distributions were based on Phi (.618).

Their ultimate conclusion would surprise the most avid trader today:

In spite of the simplicity of our model and of the strategies of the single participants, and the outright exclusion of economic external factors, we find a market which behaves surprisingly realistically. These results suggest that a stock market can be considered as a self-organized critical system: The system reaches dynamically an equilibrium state characterized by fluctuations of any size, without the need of any parameter fine tuning or external driving.

Marsili was quoted as saying that “the understanding that we got is that the statistics of price histories in financial markets can be understood as the result of internal interaction and not the fundamental interaction with the external world.”

Elliott postulated that public sentiment and mass psychology moves in 5 waves within a primary trend, and 3 waves in a counter-trend. Once a 5 wave move in public sentiment is completed, then it is time for the subconscious sentiment of the public to shift in the opposite direction, which is simply a natural cause of events in the human psyche, and not the operative effect from some form of “news.”

This mass form of progression and regression seems to be hard wired deep within the psyche all living creatures. This is what we have come to know today as the “herding principle,” and the herd seems to turn at Fibonacci ratios, as supported by the studies mentioned before.

Humans are hard wired for herding within their basal ganglia and limbic system within their brain, which is a biological response they share with all animals. In fact, in a study performed by Dr. Joseph Ledoux, a psychologist at the Center for Neural Science at NYU, he noted that emotion and the reaction caused by such emotion occur independent and prior to, the ability of the brain to reason.

In a paper entitled “Large Financial Crashes,” published in 1997 in Physica A., a publication of the European Physical Society, the authors, within their conclusions, present a nice summation for the overall herding phenomena within financial markets:

Stock markets are fascinating structures with analogies to what is arguably the most complex dynamical system found in natural sciences, i.e., the human mind. Instead of the usual interpretation of the Efficient Market Hypothesis in which traders extract and incorporate consciously (by their action) all information contained in market prices, we propose that the market as a whole can exhibit an “emergent” behavior not shared by any of its constituents. In other words, we have in mind the process of the emergence of intelligent behavior at a macroscopic scale that individuals at the microscopic scales have no idea of. This process has been discussed in biology for instance in the animal populations such as ant colonies or in connection with the emergence of consciousness.

In fact, one commenter to one of my articles on Seeking Alpha made the following astute point regarding how news affects these subconscious herding trends:

Compare the market to a stream of ants marching by in, generally, a single direction. Run a stick across their path and there will be some momentary confusion and reaction to the direct stimuli but very soon afterwards the original parade of ants continues and the stimulus is forgotten.

So, based upon much research, it does seem that the market may be considered to be on a path that is determined by a mass form of herding that is given direction by social mood, as directed through the laws of nature which governs all living things, and not due to some reasoned reactions based upon perceived fundamentals. And, those that have followed the metals market through the years should know this quite intuitively, especially during the drop in the market between 2011-2015, as the fundamentals never changed during a 75% drop in silver.

Price pattern sentiment indications and upcoming expectations

Thus far, the GDX has been rather predictable, at least within pennies of our targets. But, now we are faced with another test being presented in the GDX. The question before us, which will likely be decided in the coming week or two, is if the GDX is going to continue much higher and begin to confirm that the larger degree 3rd wave rally has begun, or if we will roll over to extend this 2nd wave pullback into early 2018.

But, I will need to see the GDX break through the 23.30 region for me to begin to become a believer that the more immediately bullish potential will be seen. Until such time, I remain quite cautious as we now reside at a resistance point which can turn us down again into early 2018 to extend this pullback off the September high.

Again, my intention is to provide you a road map for impending market action based upon what I am seeing in the market at the time of my writing this article, and I am using the GDX as my proxy for the metals market. But, overall, I am looking for a very bullish 2018 in the metals complex once we complete this 2nd wave pullback.

By Avi Gilburt via ElliotWaveTrader.net

THE U.S. SHALE OIL INDUSTRY: Swindling and Stealing Energy To Stay Alive

While the U.S. Shale Energy Industry continues to borrow money to produce uneconomical oil and gas, there is another important phenomenon that is not understood by the analyst community.  The critical factor overlooked by the media is the fact that the U.S. shale industry is swindling and stealing energy from other areas to stay alive.  Let me explain.

First, let’s take a look at some interesting graphs done by the Bloomberg Gadfly.  The first chart below shows how the U.S. shale industry continues to burn through investor cash regardless of $100 or $50 oil prices:

Burn-Baby-Burn-Shale-Oil-Free-Cash-Flow

The chart above shows the negative free cash flow for 33 shale-weighted E&P companies.  Even at $100 oil prices in 2012 and 2013, these companies spent more money producing shale energy in the top four U.S. shale fields than they made from operations.  While costs to produce shale oil and gas came down in 2015 and 2016 (due to lower energy input prices), these companies still spent more money than they made.  As we can see, the Permian basin (in black) gets the first place award for losing the most money in the group.

Now, burning through investor money to produce low-quality, subpar oil is only part of the story.  The shale energy companies utilized another tactic to bring in additional funds from the POOR SLOBS in the retail investment community… it’s called equity issuance.  This next chart reveals the annual equity issuance by the U.S. E&P companies:

According to the information in the chart, the U.S. E&P companies will have raised over $100 billion between 2012 and 2017 by issuing new stock to investors.  If we add up the funds borrowed by the U.S. E&P companies (negative free cash flow), plus the stock issuance, we have the following chart:

Thus, the U.S. E&P companies tapped into an additional $212 billion worth of funding over the last six years to produce uneconomical shale oil and gas.  Now, this chart is an approximation based on the negative free cash flow (RED color) from the four top U.S. shale fields and the shale equity issuance (OLIVE color).  So, how much money would these U.S. E&P companies need to make to pay back these funds?

Good question.  If we assume that the U.S. shale oil companies will be able to produce another 10 billion barrels of oil, they would need to make $21 a barrel profit to pay back that $212 billion.  However, they haven’t made any profits in at least the past six years, so why would they make any profits in the next six years?

Okay, now that we understand that the U.S. shale industry has been burning through cash and issuing stock to continue an unprofitable business model, let’s take it a step further.  If we understand that the U.S. shale energy industry is not making enough money from producing the oil and gas, then it also means that it takes more energy to produce it then we are getting from it.  Sounds strange… but true.

We must remember, investors, furnishing U.S. shale energy companies with funds are another way of providing ENERGY.  These U.S. shale energy companies are taking that extra $212 billion (2012-2017) and burning the energy equivalent to produce their oil and gas.  For example, it takes a lot more water to frack oil and gas wells.  To transport the water, we either do it by truck or by pipeline.  While this extra water usage is a Dollar Cost to the shale energy industry, it is really an ENERGY COST.  Think about all the energy it took to either transport the water by truck, or the energy it took to make the pipelines, install them and the energy to pump the water.

Moreover, if we add up all of the additional costs to produce U.S. shale oil and gas, the majority of it comes from burning energy, in one form or another.  Again, investor funds translate to burning energy.  Thus, the U.S. shale industry needs more energy to produce the oil and gas than we get from it in the first place.

Unfortunately, investors don’t see it this way because they do not realize they will never receive their investment back.  It was spent and burned years ago to continue the Great U.S. Shale Energy Ponzi Scheme.

Let me put it in another way.  The U.S. and world economies are based on burning energy.  When we burn energy, we create economic activity and hopefully growth.  If the U.S. shale energy industry needed $212 billion more to produce the oil than they made from operations, then it means it burned more energy than it sent to the market.  Do you see that now??

So, the U.S. shale energy industry is STEALING & SWINDLING energy wherever it can to stay alive.  This is the perfect example of the Falling EROI (Energy Returned On Investment) forcing an industry to CANNABLIZE itself (and the public) to keep from going bankrupt.

Lastly, as time goes by the U.S. shale energy industry will behave like a BLACK HOLE, by sucking more and more energy in to produce even lower and lower quality oil and gas.  At some point, the shale energy industry will collapse upon itself leaving one hell of a mess behind.  While it’s hard to predict the timing of the event, it will likely occur within the next 2-5 years.

Check back for new articles and updates at the SRSrocco Report