
Energy & Commodities
- Investors have avoided commodities like the plague for the last half-decade.
- But today, Eric reveals how one base metal may be signaling a turnaround in the sector…
Just like Lassie, the lovable TV canine, zinc may be trying to tell us something important. Zinc’s message probably has nothing to do with Timmy falling into a well, but it may have a lot to do with the prospect of rising commodity prices.
You see, the price of zinc has been conspicuously strong, which often portends good things for the rest of the commodity complex.
Unlike Lassie, zinc doesn’t receive much love or attention. No one ever searches for zinc-filled treasure chests… or slides a zinc ring around a wedding finger. In fact, most folks couldn’t identify the stuff if you dropped a chunk of it on their kitchen table.
But this overlooked metal deserves a closer look… right now. Not only is its high-flying price leading the base metals sector, but it is also leading the entire commodity complex.

For most of the last six years, the commodity sector has been a great one to avoid. After hitting an all-time high in early 2011, the Thomson Reuters CRB Commodity Index tumbled 60% to a 15-year low. Many individual commodities plummeted more than 80%
But the CRB Index finally hit rock bottom early last year. Since then, it has bounced about 20%. However, not all commodities have enjoyed a similar revival. Many are still languishing near their 2016 lows.
As the chart below shows, base metals and energy have registered the biggest gains from their 2016 lows, while agricultural commodities and soft commodities like coffee and cotton have barely budged.

Within the very strong base metals sector, zinc has been the strongest metal of all. Its price has doubled during the last two years.

In other words, zinc is the red-hot metal that is leading the red-hot base metals sector… which in turn is leading the rest of the commodity sector. That’s why zinc deserves our attention.
Since the prices of base metals like zinc tend to respond to global economic trends, a weakening economy causes their prices to drop, whereas a strengthening economy causes their prices to rise… all else being equal.
In times past, the relationship between global economic activity and the price trend of base metals was so close that copper gained the nickname “Dr. Copper, the metal with the Ph.D. in economics.”
During the current economic cycle, however, zinc is the metal with the advanced degree in economics. Its rising price indicates that the global economy is gaining strength. The other base metals seem to agree.
Therefore, if a strengthening economy is lifting the prices of zinc, copper, aluminum and nickel, continuing economic strength should spur demand for most other commodities, which should lift their prices higher as well.
This exact scenario has played out several times in the past. In early 1994, for example, base metal prices started moving sharply higher. The rest of the CRB Index eventually kicked into gear and soared 80% over the next three years.
Again in early 2009, base metal prices began ratcheting sharply higher. And again, the CRB Index followed – climbing 80% in just two years.

History appears to be repeating itself. The price of zinc and the other base metals are soaring, which means the prices of most commodities should also work their way higher.
Unlike Lassie, zinc might not receive a star on the Hollywood Walk of Fame. But this base metal is playing its own starring role in the new commodity bull market now underway.
Good investing,
Eric Fry
Eric Fry is The Oxford Club’s Macro Strategist and the head of Fry’s Pinnacle Portfolio

 General Electric Corp., as part of a turnaround plan announced November 13, halved its common stock dividend, from $.24 to $.12. per quarter, a fifty percent reduction. Wall Street had anticipated this move, but the stock has declined 8 percent following this announcement.
Given GE’s lengthy connection with the locomotive industry, it doesn’t seem inappropriate to view the company as a slow moving train wreck, at least in terms of share price performance. Under former CEO Jeffrey Immelt, GE’s stock declined forty percent while the S&P 500 stock index more than doubled. Today’s dividend cut is simply one more in a long list of indignities for shareholders starting in the year 2000 when the stock peaked at about $60 per share. (It is trading a tad below $19 today.)
But since August this Stamford-based conglomerate has had a new Chairman and CEO, John Flannery. The dividend cut and proposed corporate restructuring are on his watch. As an aside, former CEO Immelt begin his corporate tenure by cutting the stock dividend after the financial conflagration at GE capital. Not an auspicious omen.
You can find Leonard Hyman’s lastest book ‘Electricity Acts’ on Amazon
The company plans to streamline and reorganize around three legacy businesses: power generation, aviation, and healthcare while divesting oil and gas exploration, transportation and the energy connection/lighting businesses. Mr. Flannery and his team hope to collect $20 billion from asset dispositions. In addition, dramatic cost-cutting measures could boost corporate cash flows by a total of $3 billion between 2017 and 2018. You don’t need us to tell you that strategically you can’t cost-cut your way to growth and profitability. We suspect that new-CEO Flannery knows this too.
Of the remaining business lines, aviation and healthcare look capable of generating at least average earnings growth relative to the broad market. The power business on the other hand, faces “business challenges”, as the presentation slide show put it (as did the soon-to-be- divested oil & gas business). GE managers seem unable to name the real challenge.
Related: OPEC Chairman: Output Cuts Are The ‘’Only Viable Option’’
The electric utility business both in the U.S. and Europe has become a low growth-no growth business. This looks to be a secular rather than a cyclical challenge. As a result, GE may not see a pickup in demand for its gas turbines, generators, IGCC technologies, and nuclear fuel and support services that the company offers to the power industry around the world.
However, GE is also in the renewables business, particularly on shore and offshore wind turbines as well as hydro generation. From a strategic standpoint, the senior managers of the renewables business want to render the legacy power generation obsolete. Literally they are trying to kick the legacy fossil and nuclear generators off the grid. It must make for interesting conversations over the punch bowl at the annual Christmas party.
You can find Leonard Hyman’s lastest book ‘Electricity Acts’ on Amazon
We are not experts in corporate strategy. But this house-divided-against-itself internal business dynamic seems self-defeating over the long term. It creates potential conflicts. Should one division be reined in to slow the decline of the other (bigger) division? The renewables business could likely command a much higher PE multiple than the slow growing (at best) legacy electric power generation business. How CEO Flannery handles this divide could well determine his success as CEO.
As for GE’s stock and its proper valuation, right now despite all the tumult the market values the company at about 19 times projected earnings and the dividend yields 2.5 percent. The stocks comprising the Dow Jones Industrial Averages trade at around 19 times estimated earnings and yield about 2.2 percent. In other words, investors currently seem to view GE as an average company. The question is whether the new management can meet those even those expectations with its existing mix of businesses and inherent business conflicts.
by Leonard Hyman and Bill Tilles for Oilprice.com
More Top Reads From Oilprice.com:
- Houthi Rebels Threaten To Attack Saudi Oil Tankers
- OPEC Sees Oil Demand Soaring In 2018
- U.S. Congress Slashes Support For Renewables And EVs
Investors need to be concerned that the U.S. Stock Market is well beyond bubble territory as it has now entered into the final stage of a Super-Charged Tulip Mania. Not only are stock prices inflated well above anything we have ever seen before, but valuations are also reaching heights that are totally unsustainable. Unfortunately, these highly inflated share prices and insane valuations seem normal to investors who are suffering from brain damage as years of mainstream propaganda have turned the soft tissue in their skulls to mush.
Also, we are way beyond “Boiling Frogs” now. Yes, we passed that stage a while back. Today, the typical U.S. investor has been fried to death. Investors now resemble a super-crisp chicken-wing with very little meat on it but at least will offer, one hell of a crunch. Please realize I don’t mean to be harsh about my fellow investor. However, when I look around and see what 99% of the market is doing, it reminds me of a famous line from the movie Aliens. The star of the movie, after being found lost in deep space for many years, said the following in a meeting, “Did IQ’s drop sharply while I was away?”
We find out in the rest of the movie that the so-called Mainstream experts were totally wrong about their assessment of the situation. However, billions of dollars were still spent and many lives lost because high-level individuals infected with stupidity (in the Aliens Movie) still controlled the shots. No different than today.
Regardless, the U.S. Stock Market has entered into the last stage, which I call the Super-Charged Tulip Mania. In this stage, it wouldn’t matter if the North Koreans launched a nuclear missile and declared war on the rest of the world, the universe and all Aliens floating around in space. By God, the Dow Jones Index would look at these as a catalyst to reach the next important psychological level of 25,000 points. Reaching that new level wouldn’t really be that hard as the Fed would just need to hire a few dozen more trading geeks and provide them with an endless supply of Hot Pockets and Starbucks. Easy-peasy.
Okay… it’s time to get serious. Here are a group of charts that show just how insane the markets and valuations have become today.
JP MORGAN & CATERPILLAR: Exponential Share Price Increase & Insane Valuation
Let’s take a look at two of the companies listed in the Dow Jones Index. JP Morgan Chase has benefited immensely from the U.S. Government bailout of the garbage assets such as Mortgaged Back Securities after the housing and banking collapse in 2008. JP Morgan has seen its share price surge four times from $25 in 2012 to over $100 currently:
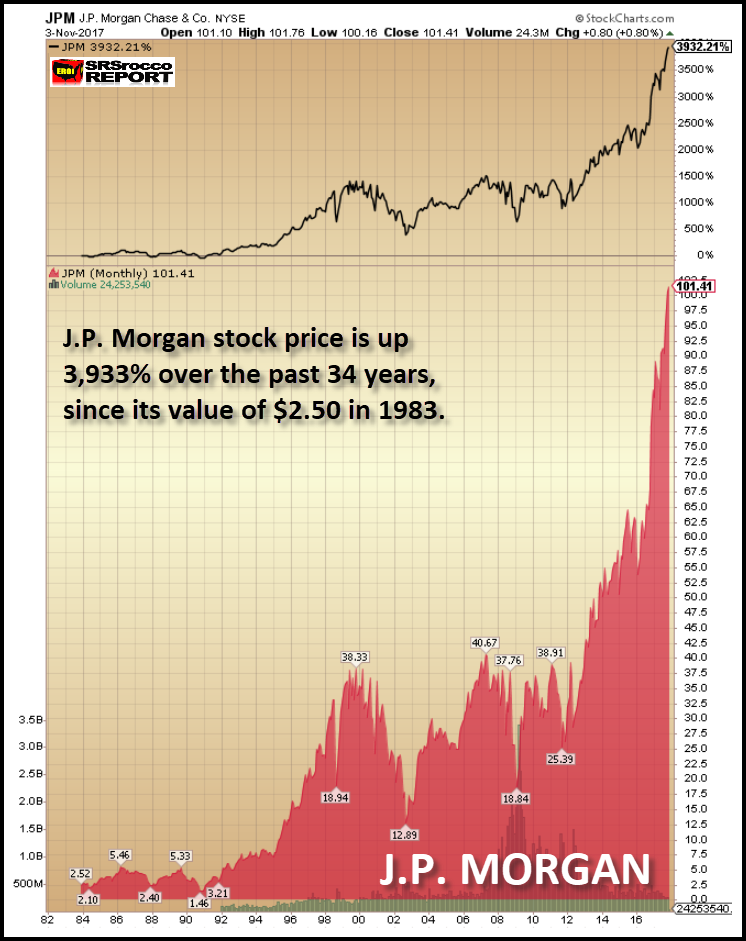
Furthermore, if an investor was lucky enough to buy a bunch of JP Morgan stock back in 1983 at $2.50 a share, he or she wouldn’t be complaining a bit today. JP Morgan’s stock price is up a stunning 3,933% over the past 34 years. If we look this chart, we can see that the share price is now moving up in an exponential trend. Sadly for JP, all exponential trends never last. While they may continue higher a bit longer, all will collapse sooner or later.
Another stock that has moved into the exponential territory, is Caterpillar. After years of falling sales, Caterpillar has emerged out of the ashes to increased sales, profits and with it… a skyrocketing share price:

Not only is Caterpillar’s share price up more than double to $137 since the beginning of 2016, but its current PE Ratio (Price to Earnings) is also at a staggering 95. Let me tell you, Caterpillar’s PE Ratio of 95 is nearly six times higher than its median PE Ratio over the past 13 years. Moreover, Caterpillar’s net income Q1-Q3 2007 was higher ($2.5 billion) than Q1-Q3 2017 ($2 billion), but its stock price was only $55 in 2007 versus the $137 today. So, what gives?
Again… these stock prices may continue higher for a while, but nothing heads up in a straight line for long.
APPLE STOCK: From Nose-Bleed To Outer-Space Brain Crushing Levels
It’s no surprise that Apple’s share price has reached a level that would make any Las Vegas bookie extremely jealous. And why shouldn’t it? What other company has actually brainwashed people into believing that they need to stand in line overnight to purchase the newest I-phone model at $1,000 a pop? Even though Caterpillar’s share price is up almost 3,000 percent over the past 36 years, who stands in line for a new Caterpillar Earth Moving machine? Or how about the latest Nike sneaker?
Amazingly, Apple’s stock price is up an earth-shattering 46,648% since it starting trading at $0.40 in 1984:

It is also quite astonishing to see Apple’s stock up more than 15 times at $172 compared to its low set in 2009 at $11. We must remember what was going on in the first quarter of 2009. The Dow Jones Index was falling to a gut-wrenching low of $6,600 as CNBC’s Mad Money, Jim Cramer was telling everyone that “There’s no end in sight to how far the market would fall.” Ole Jim was finally throwing in the towel. Back then, I also wondered how the hell did the CNBC talking heads could continue to get out of bed, get in front of the camera, and deal with what looked like the end of the world. What a difference in eight years… ah?
Today at CNBC land, there’s nothing but BIG SMILES and BACK SLAPS. Everyone is wondering when the Dow Jones will finally reach the 25,000 level. I gather all it would take to get us there would be the following three incidents; 1) A war with North Korean Nuclear, 2) A Saudi Arabia Royal Government Coup and, 3) A tidal wave that floods New York City.
THE DOW JONES & EXXONMOBIL: Watch Out Below!!
The Dow Jones and ExxonMobil are two of my favorite indicators which show that something is seriously wrong in the market. First, let’s look at ExxonMobil. While ExxonMobil’s stock isn’t moving up exponentially, as is Caterpillar, JP Morgan, and Apple, its share price is still well above its ratio to the oil price. If we go back to 2005, when the oil price was trading the same as today, ExxonMobil’s share price was only $35. However, ExxonMobil’s share price is over $83. You can see the oil price (BLACK line) versus ExxonMobil’s share price (PURPLE area):

While it’s true that ExxonMobil’s share price has increased as a result of its massive stock-repurchasing program over the past decade, the company also spent over $220 billion in profits to reduce its outstanding shares from 6.3 billion in 2005 to 4.2 billion currently. Thus, the company management thought it was a better decision to spend nearly a quarter of a Trillion Dollars to buy back its stock, rather than to use it for exploring, developing and producing more oil.
For ExxonMobil to finally be able to enjoy a tiny bit of free cash flow this year after it paid its shareholder dividends, it had to gut its capital expenditures by nearly two-thirds since 2012. By cutting its capital expenditures by $22+ billion, how does it expect to replace its oil reserves going forward? Good question. However, there isn’t a good answer as the low oil price has put the U.S. oil industry into a severe predicament with no real solution.
If Americans understood how dire the situation has become in the domestic oil industry, they wouldn’t be pushing up the value of the Dow Jones to new record highs. Why? Without energy, there is no economy or financial assets. Sure, if we went back to using human and animal labor, there would be some small valuations. Maybe the Dow Jones Index would be trading at say 100-200 points, but nowhere near the 23,500 level today.
The Dow Jones Index chart below shows how one index can become a Super-Charged Tulip Mania while the other index can be driven down to bottom-basement cesspool levels:

First, can you imagine owning the Dow Jones Index trading at a measly 850 points in 1981? It took the Dow nearly a century to reach 850 points in 1981, but it was able to increase 850 points in the past two months. Amazing things can happen to market prices and valuations when we have massive Central Bank money printing, Mainstream propaganda and societal brain damage.
Second, as the Dow Jones Index reached 23,500 points, the VIX Index (volatility) fell to a new record low of 9.14 (shown at the bottom right-hand side of chart). Think of these two indexes as an oversized stretched rubber band. At some point, the rubber band will snap back, and the fun will begin.
THE UNLOVED METALS: No Bubble Here… Just A Lot Of Frustration
While the first group of charts provided clear evidence of bubbles and tulip manias, this last group reveals quite the opposite. And out of the three following metal charts, silver is by far, the most unloved. Yes, that’s correct. A metal that has been money for more than 2,000 years has performed the worst when we compare it to copper and gold. Let’s take a look at copper first.
Even though the copper price had fallen from its high back in 2011, it has surged over 50% in the past two years. However, if we go back to 1981, the copper price is only up 312% over the 36-year period:

In 1981, the copper price was trading at $0.75, but today with all the massive money printing, the king base metal is only trading at $3. Now compare the 312% increase in the copper price since 1981 versus the Dow Jones Index at 2,548% and Caterpillar at 2,990%. Thus, it paid much more handsomely to invest in industrial stocks than in copper over this 36-year period.
Now, if you think copper under-performed the stock market, wait until you see gold. The gold price today is only up 217% since it was traded for $400 in 1981:

I would imagine some precious metals investors would claim that taking the $400 figure (1981) as a baseline would be disingenuous as gold was coming off its high in 1980. Okay, I will give you that. But, even if we used the low of $275 set in 2001, the increase would still only be 350% during that 16-year period. Thus, gold’s 350% increase from its low in 2001 is still anemic compared to gains made by the Dow Jones Index or the other stocks mentioned above.
Either way, both copper, and gold have severely underperformed the gains experienced in the broader markets. Sadly, it’s even worse when we look at the last metal in this group. While copper and gold at least enjoyed triple-digit percentage gains over the past 36 years, the current silver didn’t hasn’t even surpassed double-digit gains. As of the end of trading last week, the silver price had only gained a paltry 99% from its trading level of $8 in 1981:

This chart reveals the frustration felt by many silver investors. However, there is a good side to this story. And that is… BUBBLES POP while DEPRESSED ASSETS SURGE. You have to think about the metals in this fashion. Gold and silver are behaving like the VIX. The more the VIX index goes down, the more the stock market rises. But, when the bubble markets finally pop, then the VIX will shoot back higher (as seen in the RED SPIKES in the DOW chart above), taking the precious metals prices up with it.
This next market crash will not resemble anything similar to what took place during the 2008-2009 U.S. banking and housing market collapse. When the markets cracked in 2008, EVERYTHING went down together. Instead this time around, as the markets tank the precious metals will surge to new highs. We must remember, there really isn’t much in the way of safe assets to move into during the next market crash. So, as investors flee from bloated STOCKS, BONDS, and REAL ESTATE, to the tiny gold and silver market, fundamentals won’t matter either… LOL. Yeah… we could see some ridiculous high gold and silver prices as investors finally receive precious metals religion.
Check back for new articles and updates at the SRSrocco Report.

 U.S. President Donald Trump will visit China November 8-10 for a series of bilateral and commercial events, including a meeting with Chinese President Xi Jinping.
On that trip, President Trump’s first visit to China—the country that he has repeatedly criticized for trade practices and the way it has handled relations with North Korea—the administration will be taking some 40 U.S. companies on a trade mission to forge deals and discuss Chinese investments in the U.S.
One of the biggest deals up for discussion is an investment of around $7 billion by an alliance including China Petroleum & Chemical Corporation, or Sinopec, for an oil pipeline in Texas and an expansion of an oil storage facility in the U.S. Virgin Islands, Bloombergreports, quoting a person familiar with the proposal. The deal is likely to be in the form of a non-binding memorandum of understanding, not a definitive contract. According to insiders, the investment will still need a final go-ahead by both the U.S. administration and China.
Sinopec, in partnership with ArcLight Capital Partners—a Boston-based private equity firm focused on energy infrastructure assets—and with Connecticut-based Freepoint Commodities, is expected to propose a project for building a 700-mile-long pipeline from the Permian to the Gulf Coast and a storage facility at the Coast, according to Bloomberg’s source. Sinopec also wants to expand an oil storage facility on St. Croix, U.S. Virgin Islands.
Related: Oil Prices Fly Higher On EIA Report
Back in early 2016, ArcLight Capital Partners and Freepoint Commodities bought the idled storage terminals, refining units, and marine infrastructure located at Limetree Bay, St. Croix, from HOVENSA. The St. Croix Facility consists of some 32 million barrels of crude oil and petroleum product storage, idled refinery units with total peak processing capacity of 650,000 bpd, a deepwater port with nine ship docks, six tug boats, and various associated equipment and inventory.
LB Terminals—the company managed by ArcLight and Freepoint Commodities—wants to invest significant resources to revitalize the St. Croix Facility as a multi-purpose energy center, with an initial focus on crude oil and refined petroleum product storage. LB Terminals has already executed a 10-year lease agreement for 10 million barrels of storage capacity with Sinopec, the partners said in January 2016.
The potential Sinopec investment in U.S. energy assets and creation of jobs in hurricane-hit areas will not be President Trump’s only mission on his Chinese visit.
“This multi-sector mission will promote U.S. exports to China by supporting U.S. companies in launching or increasing their business in the marketplace, as well as address trade policy issues with high-level Chinese officials,” the Department of Commerce said, adding that due to the high interest and the significant number of applications received, it decided to accept more than 25 U.S. firms or trade associations as delegation participants.
According to Bloomberg, more than 100 U.S. companies have applied for the trade mission, and the Commerce Department will pick some 40 of them and announce their names soon. Companies tentatively listed as working on deals with China include General Electric, Westinghouse Electric, Alaska Gasline Development Corp, Cheniere Energy, and the Boeing Co, Bloomberg says, quoting a government document it obtained.
According to Reuters, energy firms dominate the provisional list of U.S. companies picked to accompany President Trump in China. A total of ten firms are listed—few of them confirmed to Reuters that they were getting ready to travel to China, but most declined to comment. The companies are Delfin Midstream LLC, Alaska Gasline Development Corp, Cheniere Energy, Texas LNG Brownsville LLC, Freepoint Commodities, Sempra Energy, SolarReserve LLC, Westinghouse Electric Co, Arclight Capital Partners, and Air Products.
Related: Saudis Need $70 Oil To Break Even
Considering this lineup, it’s very probable that President Trump and the Commerce trade mission delegation will negotiate boosting U.S. LNG exports to China.
In April, the Commerce Department said “companies from China may proceed at any time to negotiate all types of contractual arrangement with U.S. LNG exporters, including long-term contracts, subject to the commercial considerations of the parties.”
During his visit to China last month, U.S. Commerce Secretary Wilbur Ross stressed again his intention “to reduce the trade deficit through increased exports of high-value U.S. goods and services to China and improved market access for U.S. firms.” The U.S. and China should work to overcome bilateral trade frictions through negotiation, the parties agreed, but Secretary Ross “reiterated the need for concrete deliverables and meaningful action on key issues.”
By Tsvetana Paraskova for Oilprice.com
More Top Reads From Oilprice.com:
- U.S. Gasoline Demand Climbs To Record Highs
- Tensions Rise As Iraq Halts Kirkuk Oil Exports
- Coal Prices Soar As Demand Heats Up
If you’re looking for action, the commodities sector has traditionally been a good place to find it.
With wild price swings, massive up-cycles, exciting resource discoveries, and extreme weather events all playing into things, there’s usually never a dull day in the sector. That being said, it’s hard to remember a more lackluster period for commodities than in the last couple of years.
For commodity bulls, the good news is that the sector is no longer tanking. The bad news, however, is that all the recent action has been in relatively niche sectors, as metals like cobalt, zinc, and lithium all have their day in the sun.
At the same time, the big commodities (gold, oil, copper) have all slid sideways, having yet to revisit their former periods of glory.
ARE COMMODITIES CHEAP?
From the post-crisis bottom in 2009 until today, the S&P 500 is up a staggering 215.4%.
During that same timeframe, most major commodities crashed and then went sideways. The Goldman Sachs Commodity Index (GSCI) is down roughly -31.2%, which is a strong juxtaposition to how equities have done.
This extreme divergence can be best seen in this long-term chart, which compares the two indices since 1971.

In other words: despite the lack of action in commodities that we noted earlier, the sector has never been cheaper relative to equities even going back 45 years.
That means that there could be some much-needed action soon.
COMMODITY WINNERS SO FAR
Before we highlight why commodities could still be cheap, let’s look at recent performance to get some context. Here are the commodities that have positive returns in H1 2017 so far:

Palladium is the best performer in 2017 so far, and it has now almost passed platinum in price. That would be the first time since 2001 that this has happened, and for the stretch of 2007-2012 it was even true that palladium traded at a $1,000 deficit to platinum.
Agricultural goods like rough rice, lean hogs, oats, and and wheat have also gotten more expensive so far this year. Meanwhile, metals like gold, copper, and silver have seen modest gains – but these are only after dismal performances from the last part of 2016.
THE LOSERS SO FAR
Here is the scoreboard for the commodities in negative territory, with the most noticeable losses in sugar and energy.

….also from Morris Hubbartt:
Long Term Outlook For Commodities

-
I know Mike is a very solid investor and respect his opinions very much. So if he says pay attention to this or that - I will.
~ Dale G.
-
I've started managing my own investments so view Michael's site as a one-stop shop from which to get information and perspectives.
~ Dave E.
-
Michael offers easy reading, honest, common sense information that anyone can use in a practical manner.
~ der_al.
-
A sane voice in a scrambled investment world.
~ Ed R.
Inside Edge Pro Contributors

Greg Weldon

Josef Schachter

Tyler Bollhorn

Ryan Irvine

Paul Beattie

Martin Straith

Patrick Ceresna

Mark Leibovit

James Thorne

Victor Adair