
Energy & Commodities

In September, USDA global wheat production estimates were revised slightly higher. Mainly due to better crop conditions in Turkey and Russia, estimates were raised to 744.85 million tons from 743.18 million tons in August. Based on the latest data, Russia is currently expected to be the top wheat exporter in the 2017/18 season year. Global wheat consumption is now expected to edge slightly lower from this year’s record of 738.7 million tons and reach 737.5 million tons next season year. Latest data are more bearish for global inventories, however, which are forecast to increase 16.5 percent to 263.14 million tons.

The September USDA report saw a downward revision in corn production for Ukraine, Russia and EU countries. As a result, global production is forecast to demonstrate a 3.7 percent year-over-year decrease to 1.03 billion tons in 2017/18. In contrast with forecasts for an annual consumption increase in August, global corn consumption was revised lower in September and is now projected to remain nearly unchanged at just below 1.06 billion tons. Consequently, global inventories are expected to demonstrate a strong 11 percent year-over-year increase to 202.5 million tons.

With soybean consumption continuing to increase, global crush in 2017/18 is expected to reach 300.7 million tons vs. the current year’s level of 288.5 million tons – a 4.2 percent year-over-year increase mainly driven by solid production yields and a record soybeans production of 4.431 million bushels. Global inventories are expected to slightly offset the balance and are currently projected to remain nearly unchanged at 97.8 million tons. With a forecast for a 3.4 percent increase in global exports, USDA expects the US soybean prices to average $8.35-10.05 per bushel in 2017/18, 10 cents lower year-over-year at the midpoint.

Global soybean meal production is expected to continue closely tracking domestic use in 2017/18, and is currently expected at 234.4 million tons – a 5.5 percent year-over-year increase from the current year’s level of 222.1 million tons. In the meantime, global production – projected at 236.6 million tons – will likely narrow down the production-consumption spread to 2.17 from 4.27 million tons a year earlier. However, despite the expected global ending stocks decrease – currently seen at 12.9 metric tons – the USDA lowered its pricing forecast from August and currently expects U.S. prices to average $290-330 per short ton next year.

Due to a significant expected decrease in harvested area, U.S. rice production is forecast to suffer a 20 percent decrease in 2017/18, with additional downward revisions for China and Bangladesh. Partially offset by increased production levels in India, Burma and Peru, global production is expected to reach 483.36 million tons next year, a minor decrease from this season year’s estimate of 486.39 million tons. Global consumption is projected to edge slightly lower to 482.5 million tons, raising the ending stocks estimate to 123.52 from 120.33 million tons estimated for the current season year.
Due to a strong decrease in U.S. production estimates, USDA projects the domestic stocks to suffer a 37 percent year-over-year decline in 2017/18, fueling a significant increase in domestic price estimates: “For the third consecutive month, U.S. season-average price forecasts (SAPF) for 2017/18 for both classes of rice and for both growing regions were revised up. Like last month, this month’s upward revisions were largely based on tighter U.S. supplies, increases in both reported monthly cash prices and weekly spot prices, and expectations of prices during the remainder of the 2017/18 market year. Forecast 2017/18 SAFPs are well above 2016/17 SAFPs for both classes of rice. The 2017/18 long-grain season-average farm price is projected at $12.00-$13.00 per cwt, up 50 cents on both ends from the previous forecast and well above the slightly revised $9.62 in 2016/17. […] The California medium- and short-grain 2017/18 SAFP is forecast at $15.50-$16.50, also up 50 cents on both ends of the range from the August forecast and up from a revised $13.60 in 2016/17.”

The September USDA report saw an upward increase in global cotton production estimates, raising the 2017/18 estimate to 120.8 from 117.3 million bales in August. Mainly driven by continued cotton demand growth in the Asian region, world cotton consumption is projected to demonstrate a 3.6 percent year-over-year increase and reach 117.75 million bales during the next season year. Ending global stocks are forecast to increase from the current multi-year low of 89.6 to 92.5 million bales. Consequently, latest U.S. pricing estimates are slightly below the current price of $0.68 and are forecast to trade in the range between $0.54 and $0.66 per pound in 2017/18.

With no significant data updates on Coffee in September, Brazilian crop harvesting period is nearing its end. As a result of excess rain and beetle pests, country’s Arabica production came in below estimates and resulted in slashed crop estimates by Conab, Brazil’s official crop bureau. Conab currently projects domestic production at 44.77 million bags in 2017/18, lower by 790,000 from the previous estimate. Despite the upward revision totalling 568,000 bags, Brazilian Robusta crop is forecast at 10.71 million bag and is expected to demonstrate its 2ndweakest result in a decade. Despite slightly tempering the upbeat coffee production expectations, its global supply balance remains relatively bearish. Signalling weaker sentiment, large traders have been net short the coffee futures contract since the middle of August.

Sugar prices remain in a downtrend due to bearish supply fundamentals, with no USDA data updates in September. Reports of better crop conditions in India and the abolishment of the EU sugar quotas – resulting in a significant inflow of new sugar exports – continue to depress the soft commodity. In the meantime, recent price action was also significantly influenced by the reports of a production rebound in Brazil. According to a cane industry group Unica, Brazilian Centre South mills – representing more than 90 percent of the total Brazilian output – produced a total of 3.13 million tons in the first half of September, 50 thousand tonnes above the S&P Global Platts consensus estimates.

Oil prices are falling on reports of rising OPEC oil production, but the main culprit is likely the rising dollar.
Reports that Nigerian and Libyan oil production increased caused some selling as well as a report by Baker Hughes that showed the U.S. oil rig count rise by six, even as the natural gas rig count fell by one. Still reports of problems at Libya’s largest oil field that was shut since Sunday and a pledge by the United Arab Emirates to reduce production by 139,000 barrels per day in November puts the oil price fate in the hands of the dollar (see chart below).

A proposal by the U.S. Department of Energy may be the biggest story in energy today as the Trump Administration looks to reward coal and nuclear on the basis of those forms of energy contributions to the electric grid reliability and resiliency.
Energy Secretary Rick Perry invoked his powers under the Department of Energy Organization Act, to direct the Federal Energy Regulatory Commission (FERC) to consider a new grid resiliency rule according to Reuters.
“The proposed rule would require independent system operators (ISOs) and regional transmission organizations (RTOs) regulated by FERC to implement new electricity market rules compensating eligible power producers for their contributions to reliability and resiliency. Specifically, the (proposed) rule allows for the recovery of costs of fuel-secure generation units that make our grid reliable and resilient,” Perry wrote in a letter to FERC dated Sept. 28. “Such resources provide reliable capacity, resilient generation, frequency and voltage support, (and) on-site fuel inventory,” he explained. “The rule allows the full recovery costs of certain eligible units.”
“Eligible units must … be able to provide essential energy and ancillary reliability services and have a 90-day fuel supply on-site in the event of supply disruptions caused by emergencies, extreme weather, or natural or man-made disasters.”
The proposed rule would require ISOs and RTOs to establish “just and reasonable” tariffs for eligible units to recover their full costs and earn a fair rate of return.
 Despite concerns around refinery closures and inventory builds post Hurricanes Harvey and Irma, WTI Oil has traded constructively and, in our view, has the potential to reach $60+ as we head into the end of the year…
WTI Crude has broken through the trend line across the 2017 highs and this overall setup can be viewed as a triangle consolidation before the prevailing trend higher resumes. In fact, the break higher suggests just that (see chart below).
also:
DANGER: Major Warning Indicator Hits All-Time High While A 2nd Plunges To All-Time Record Low!
 The price of oil is finally back above $50 and Dan Steffens, President of the Energy Prospectus Group, believes the remainder of the year will be quite bullish for the energy sector.
Market Direction Is Up
With demand projected to continue growing this year into next, inventories tightening and continuing to fall, and rig counts decreasing, we can expect oil prices to go up into year-end, said Steffens.
It’s interesting to note that in the first quarter, S&P 500 profits largely came from the energy sector. Yet, energy stocks have been decimated since then.
Steffens follows about 50 publicly traded companies, and almost all are down year-to-date even though they’re having a better year financially.
There’s “this fear that there’s going to be a big collapse in oil and gas prices,” he said. “I don’t see it happening. I don’t see any way sub-$50 oil can be maintained and meet future demand for refined products.”
While Steffens doesn’t think we’re going to see $100 anytime soon, he believes we will hit around $65 oil in 3 or 4 months.
Energy Stocks Unloved
Also Consider: Dan Steffens: Energy Sector Massively Undervalued (Podcast)

Tonight I would like to update some of the different commodities and emerging markets we took some positions in back in late July of this year. First, let me say that as investors we like everything to line up in perfect harmony so we can make some sense out of what is actually happening in the markets. It’s just human nature. For example, if the US dollar is doing this then the PM complex or the commodities should be doing that. There is a general rule that there is an inverse correlation between the US dollar and the PM complex or commodities, but it’s not always accurate.
Many times we can get bogged down trying to make everything fit perfectly before we make a trade. This can sometimes lead to missed opportunities as what we were expecting didn’t take place. For the most part this is one of the reasons why I prefer Chartology. When a pattern is building out the bears and bulls are making their side known by the battle they’re having with each other, which eventually creates a consolidation or reversal pattern. All the fundamentals that a stock has is also priced into the chart pattern.
Many times as investors we have to know why a stock is doing what it’s doing, from a fundamental point of view, which can begin to complicate things to the point where we become more confused than ever and can’t see the forest for the trees anymore. For me personally I try to keep it fairly simple by looking at what chart pattern is building out and base my buy or sell points by what the chart is suggesting. Nothing is perfect when it comes to trading the markets, but sometimes less is more.
I know right now many investors are seeing a stronger dollar and expect that commodities will head much lower based on the inverse correlation these two generally have which may in fact turn out that way. From a Chartology perspective many of the different commodities built out very large reversal patterns, which is going to be very hard to reverse those patterns. So regardless of what the US dollar is doing I have to go with what the chart patterns are suggesting.
Lets start by looking at a weekly chart for Copper which built out a very large 3 year inverse H&S bottom. About 3 months ago we got the breakout above its neckline telling us the bottoming process was complete. After a strong breakout move Copper is now pulling back to the breakout point forming a backtest to the neckline which will come in around the 2.75 area along with the 30 week ema. Until something changes this bullish setup I have to respect what the chart is saying regardless of what the US dollar is doing presently.
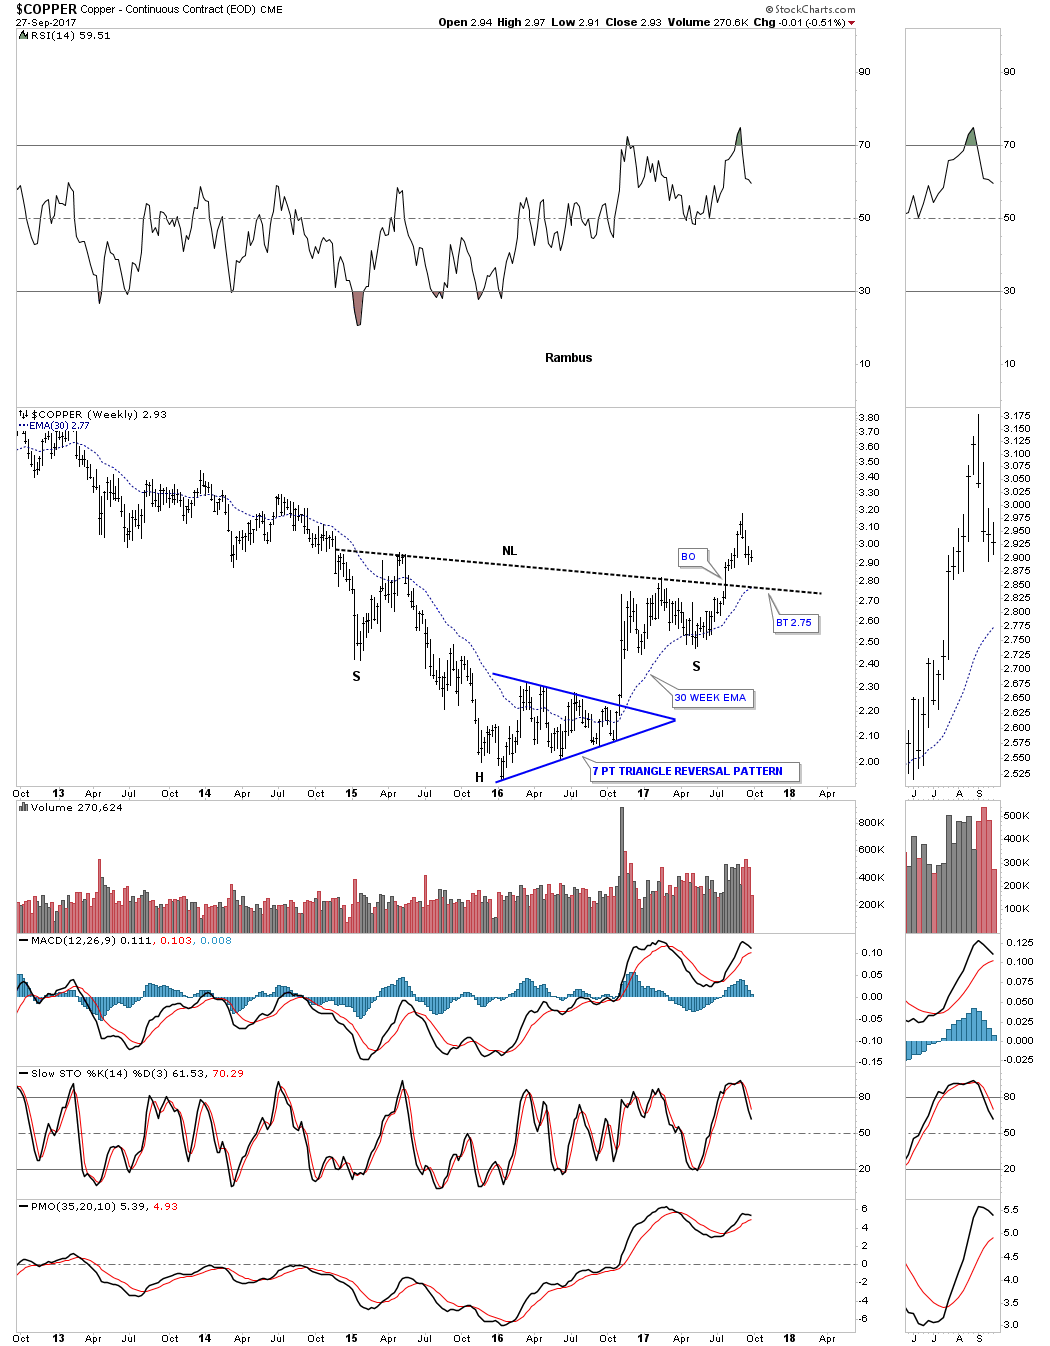
Double Click to Get Full Chart
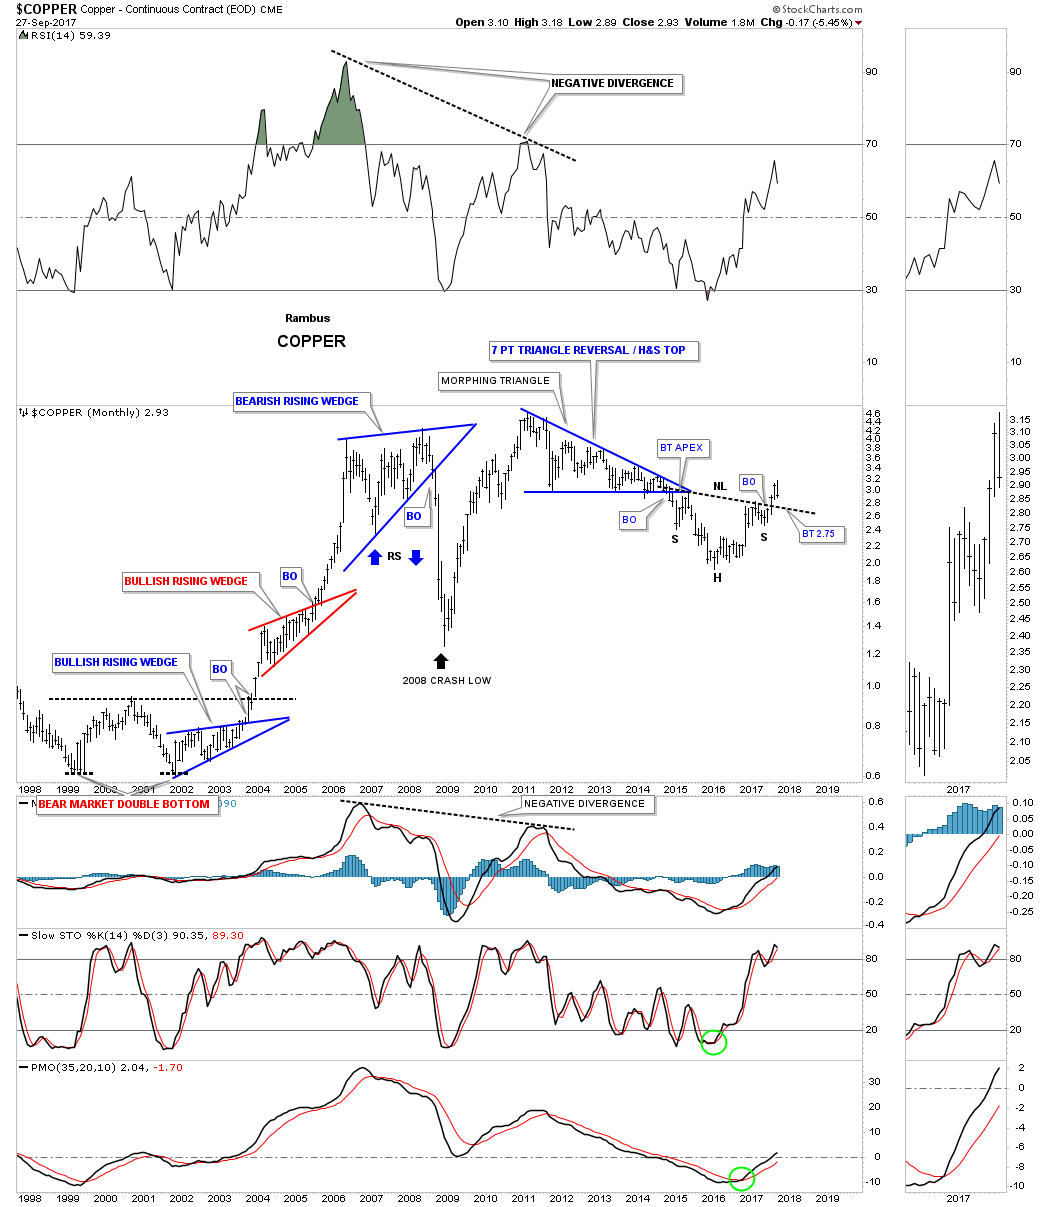
The 20 year monthly chart for Copper shows a very symmetrical H&S bottom forming after an almost 7 year decline. This is the area one would be looking for some type of reversal pattern to form.
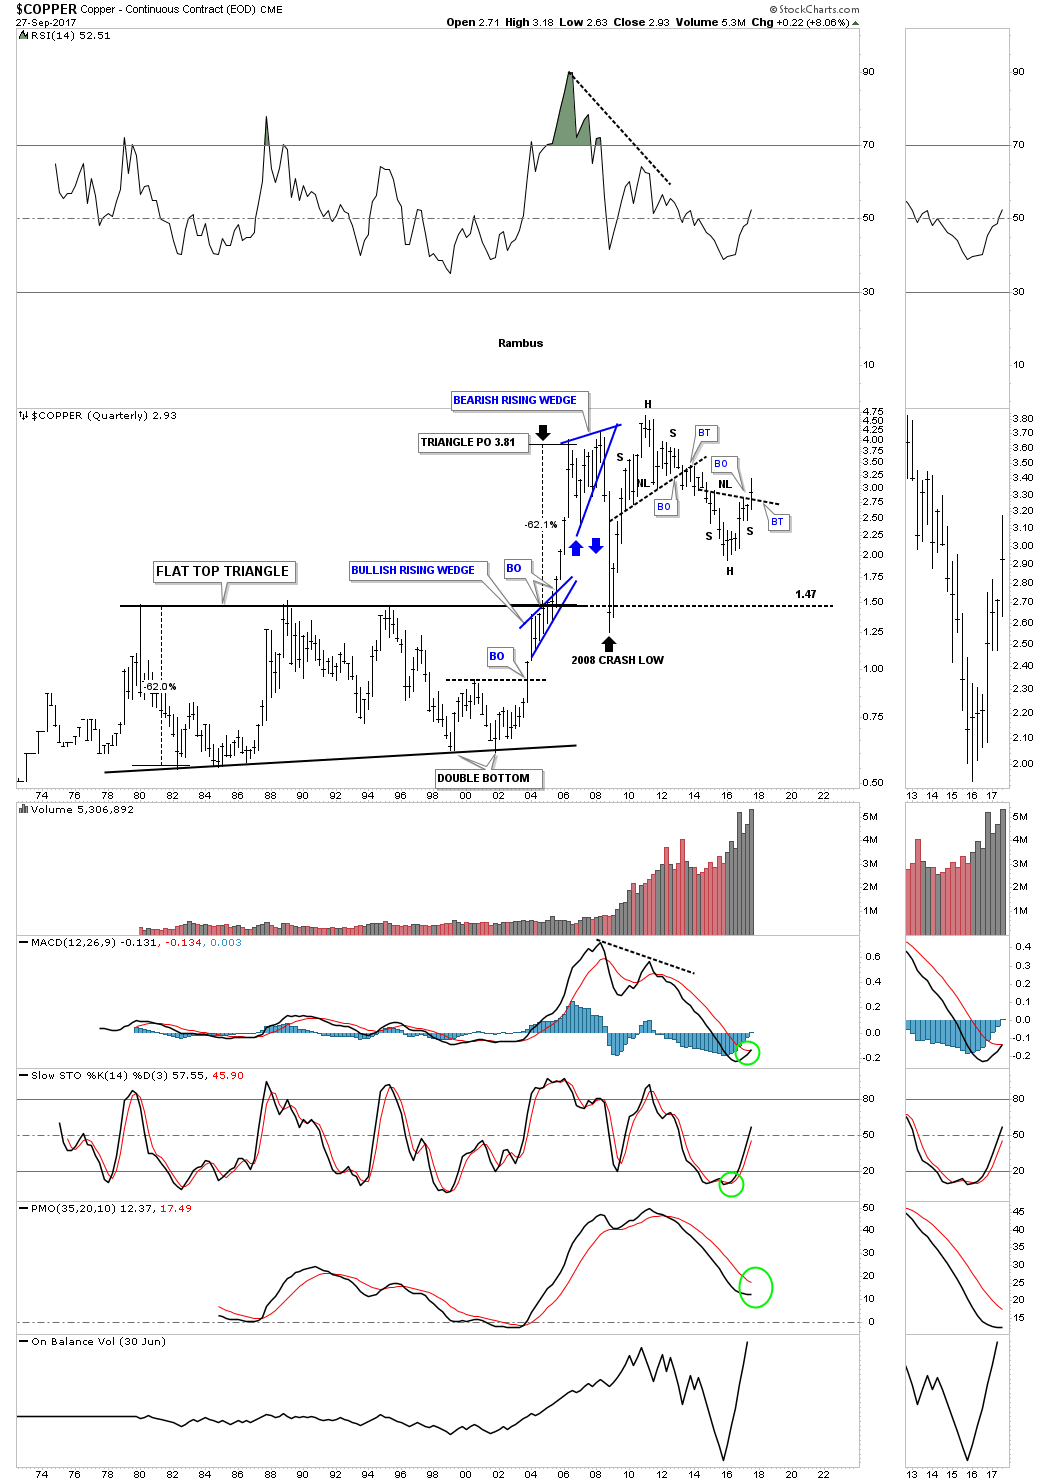
When one looks at this 45 year quarterly chart for Copper you can begin to see how our current H&S bottom fits into the very big picture. Note the beautiful H&S top that formed at the 2010 high. It took approximately 3 quarters for the breaking out and backtesting process to play itself out before the impulse move down began. Before we leave this chart Copper built out a 25 year flat top triangle which led to that strong impulse move up. Also note the blue bullish rising wedge which formed just below the top rail of that 25 year flat top triangle which gave Copper the energy it needed to finally take out that massive resistance line.
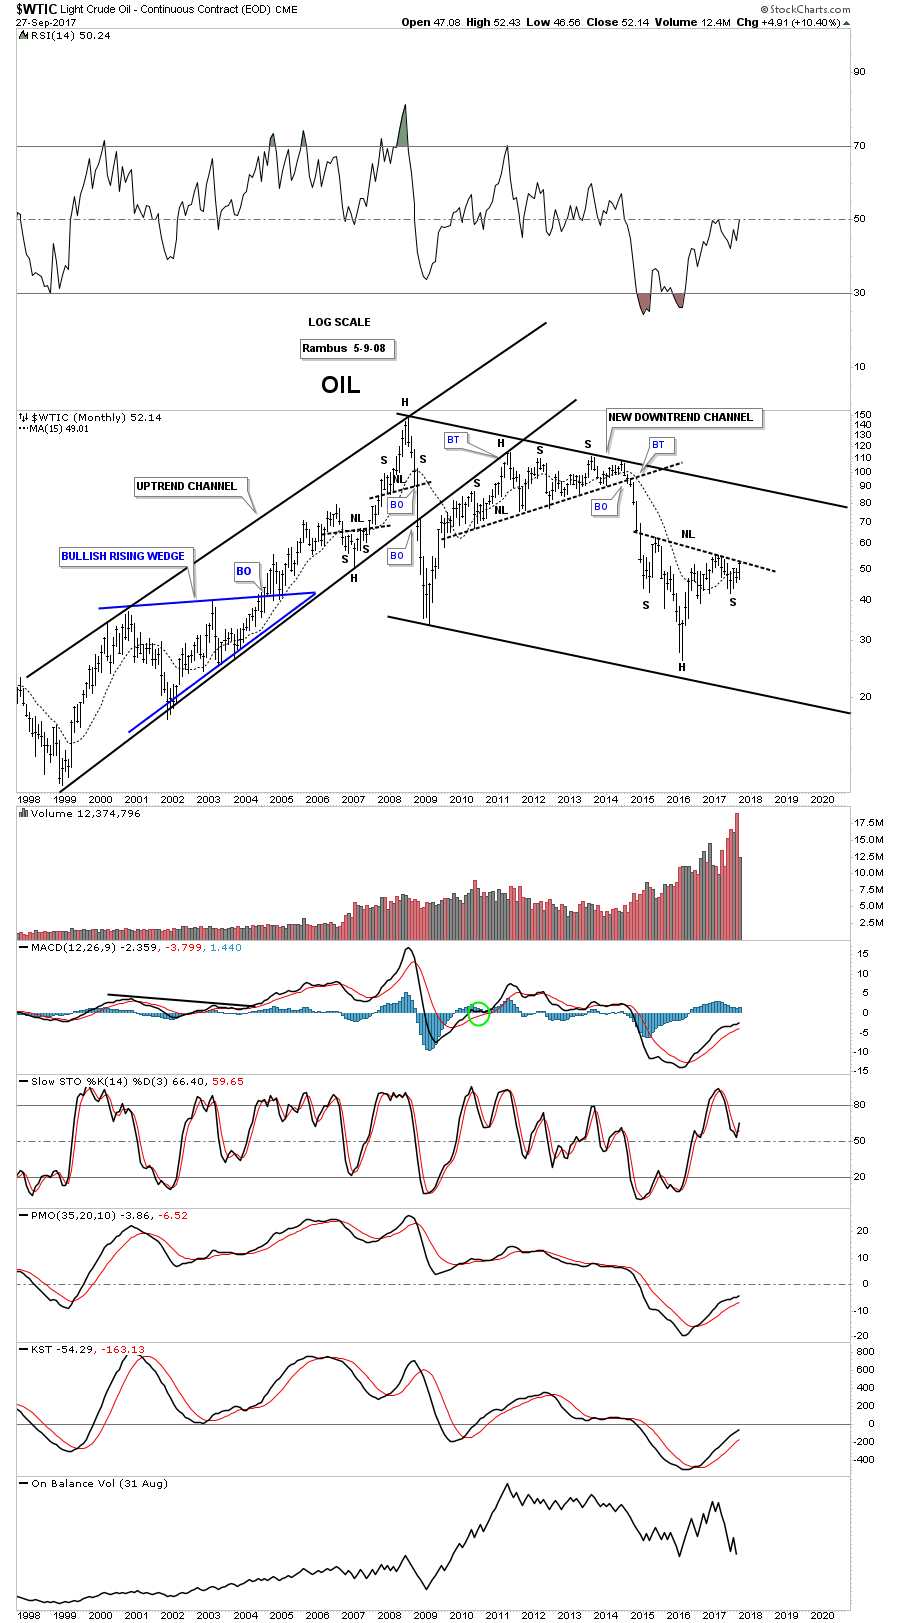
Another very important commodity is Oil, which is building out its own 3 year H&S reversal pattern after an almost 5 year decline. This weekly chart shows the price action is currently testing the neckline. Many times a line chart will give you an early heads up when a breakout is about to take place vs a bar chart.
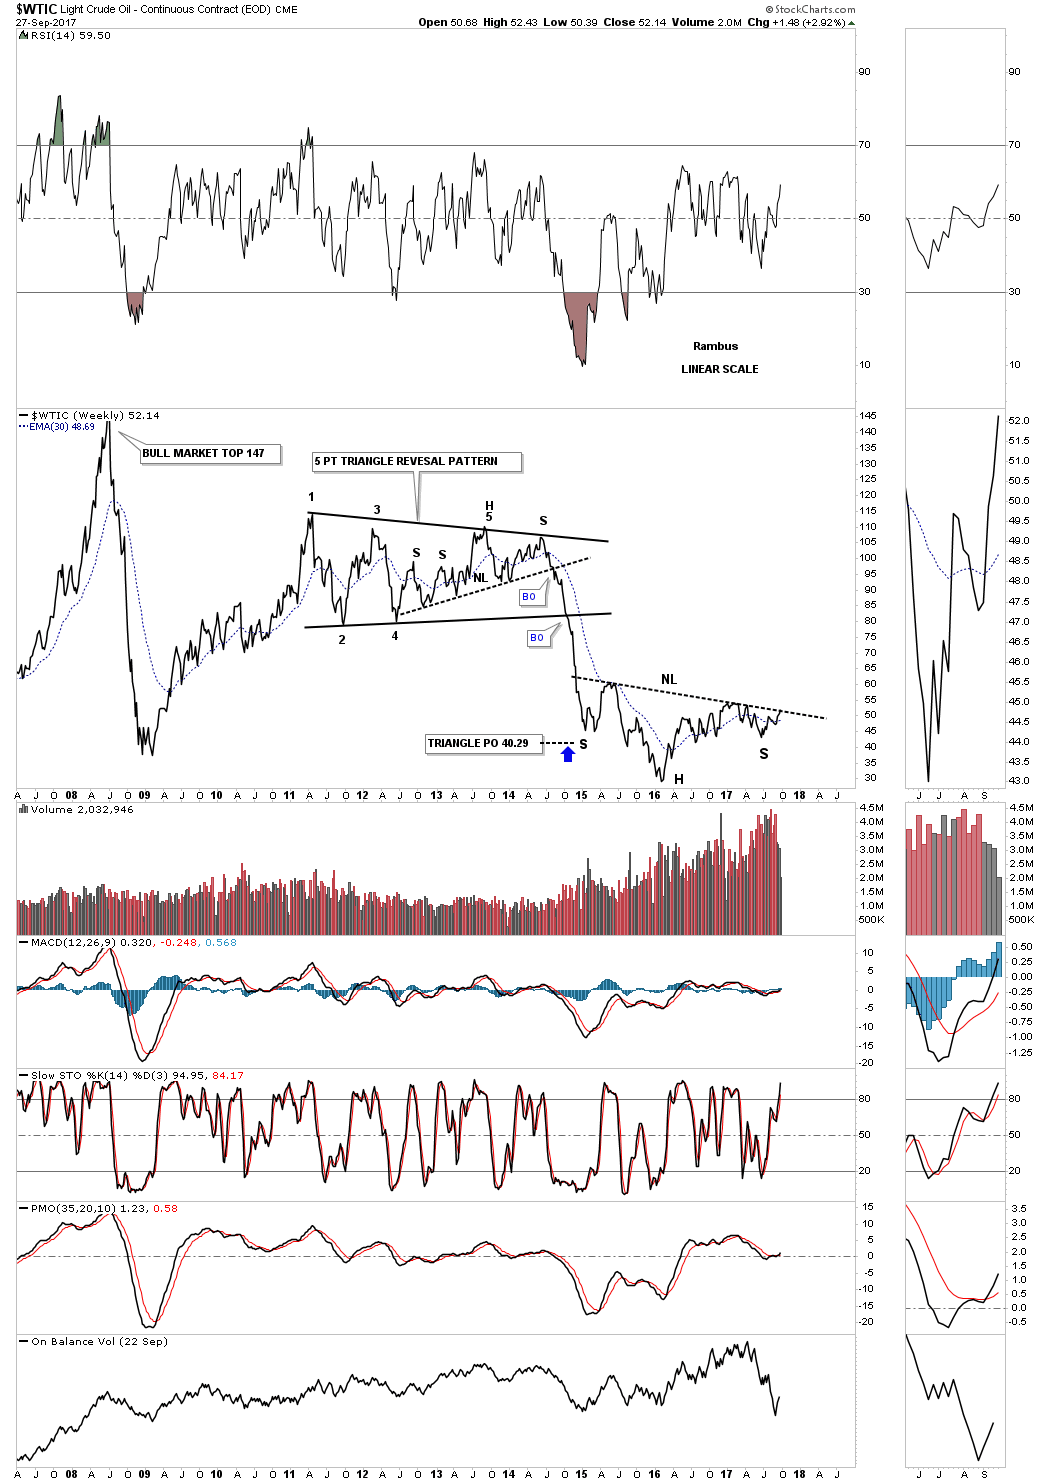
When looking at these H&S bottoms make a mental note of the price objective which is taken from the bottom of the head straight up to the neckline. That distance is then added to the breakout point to get a minimum price objective.
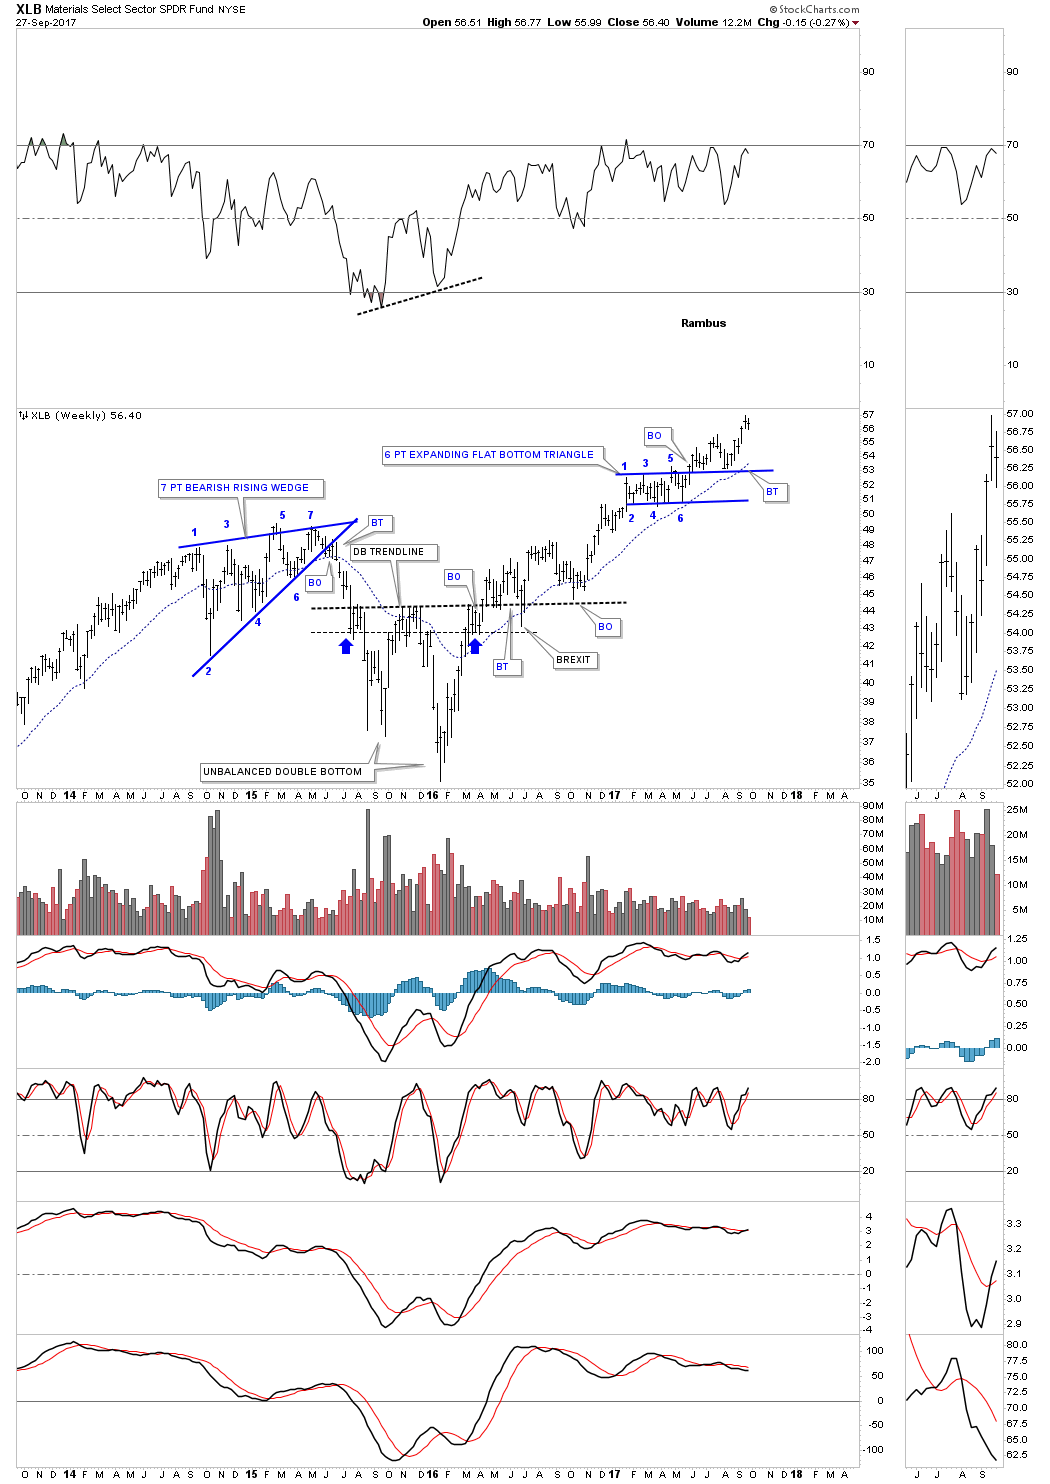
Next lets look at a weekly chart for the XLB, basic materials sector, which is hitting new all time highs.
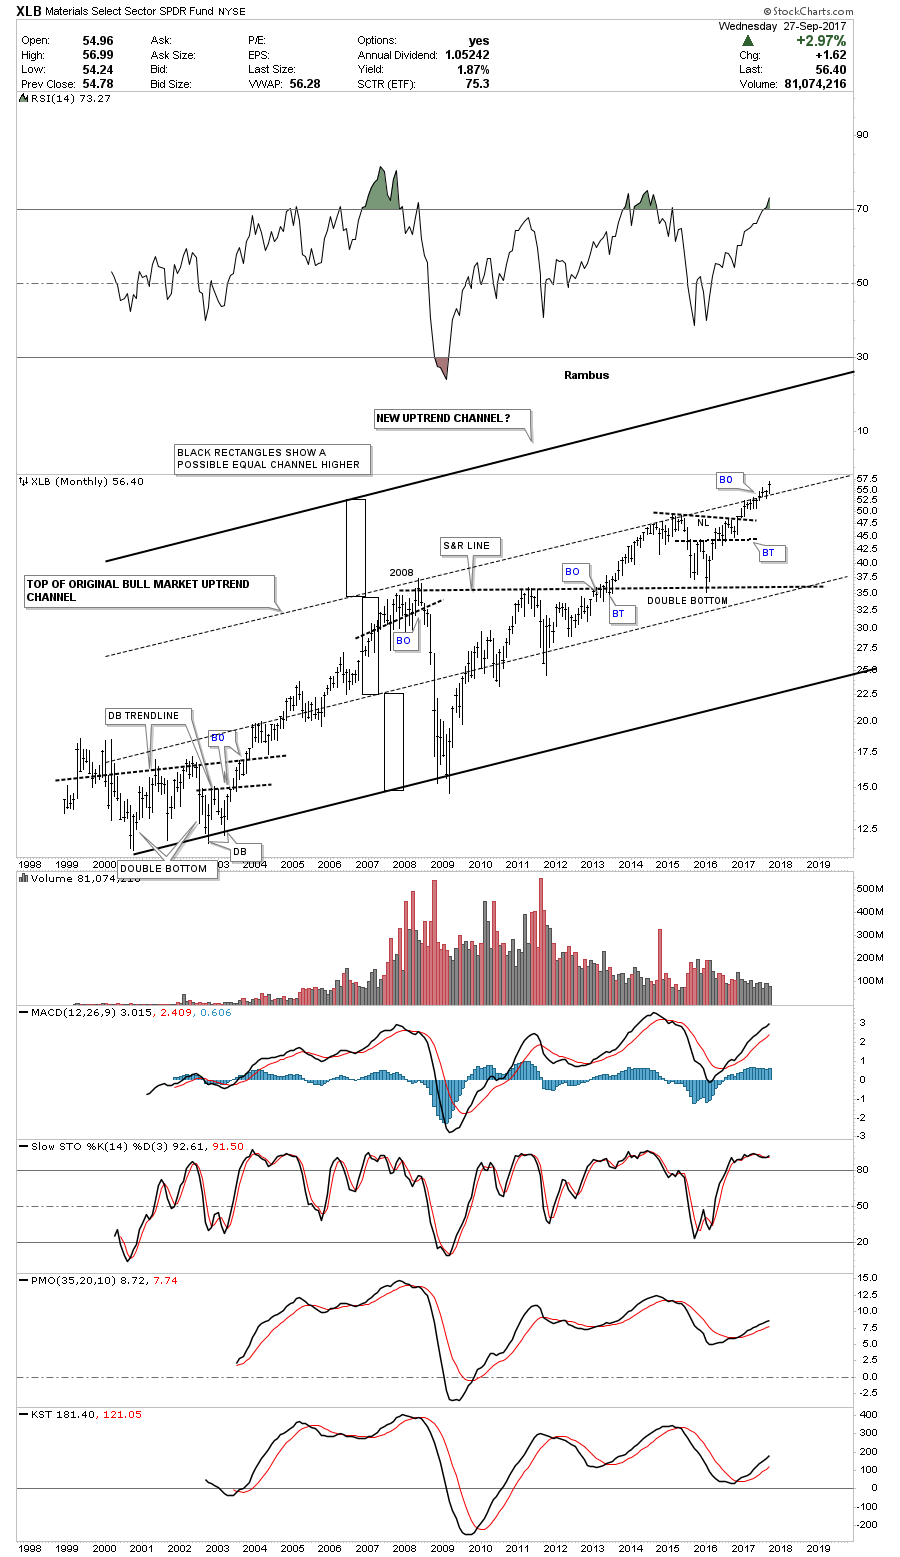
In the past we’ve looked at how the lower channel can morph into a bigger channel that can double in size. In the case for the XLB it looks like a possible 3rd equal channel maybe in the process of building out.
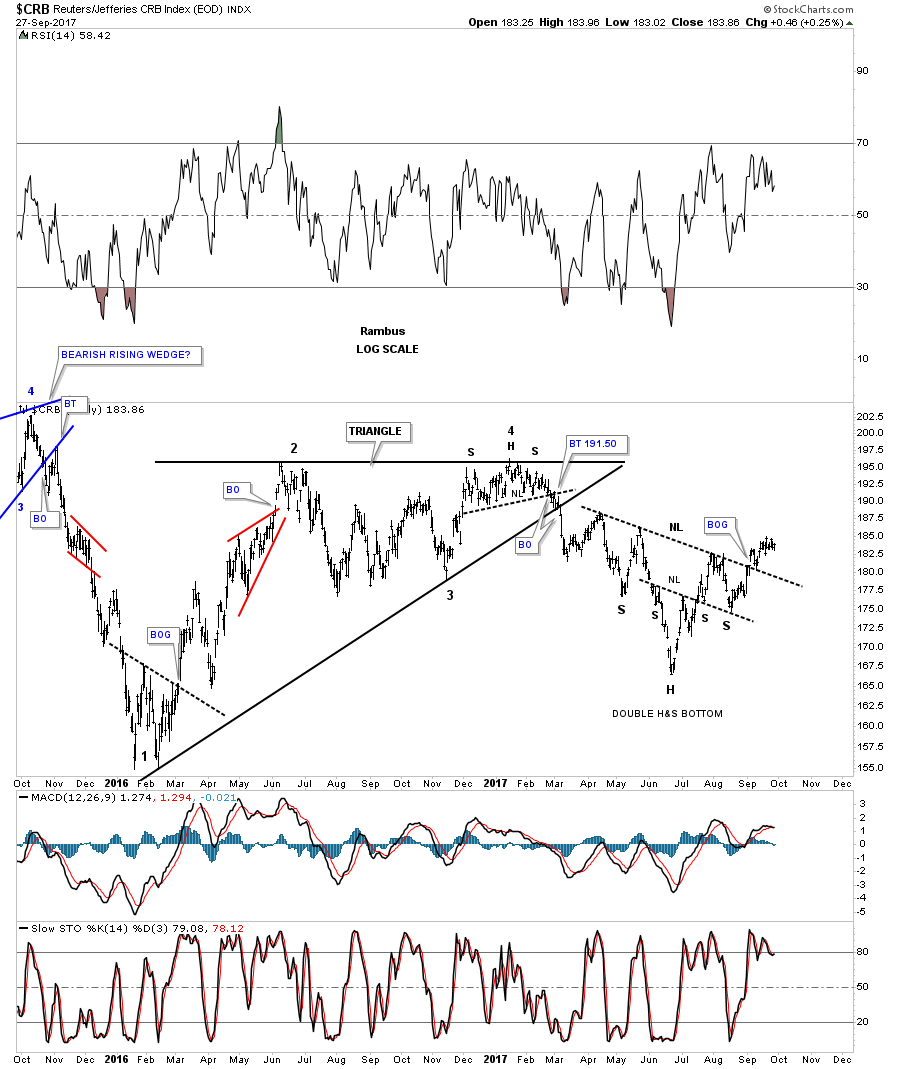
Next lets look at several different commodities indexes to see what they may be telling us. This first commodities index is the old CRB index which has built out a double H&S bottom that experienced a breakout gap above its neckline earlier this month.
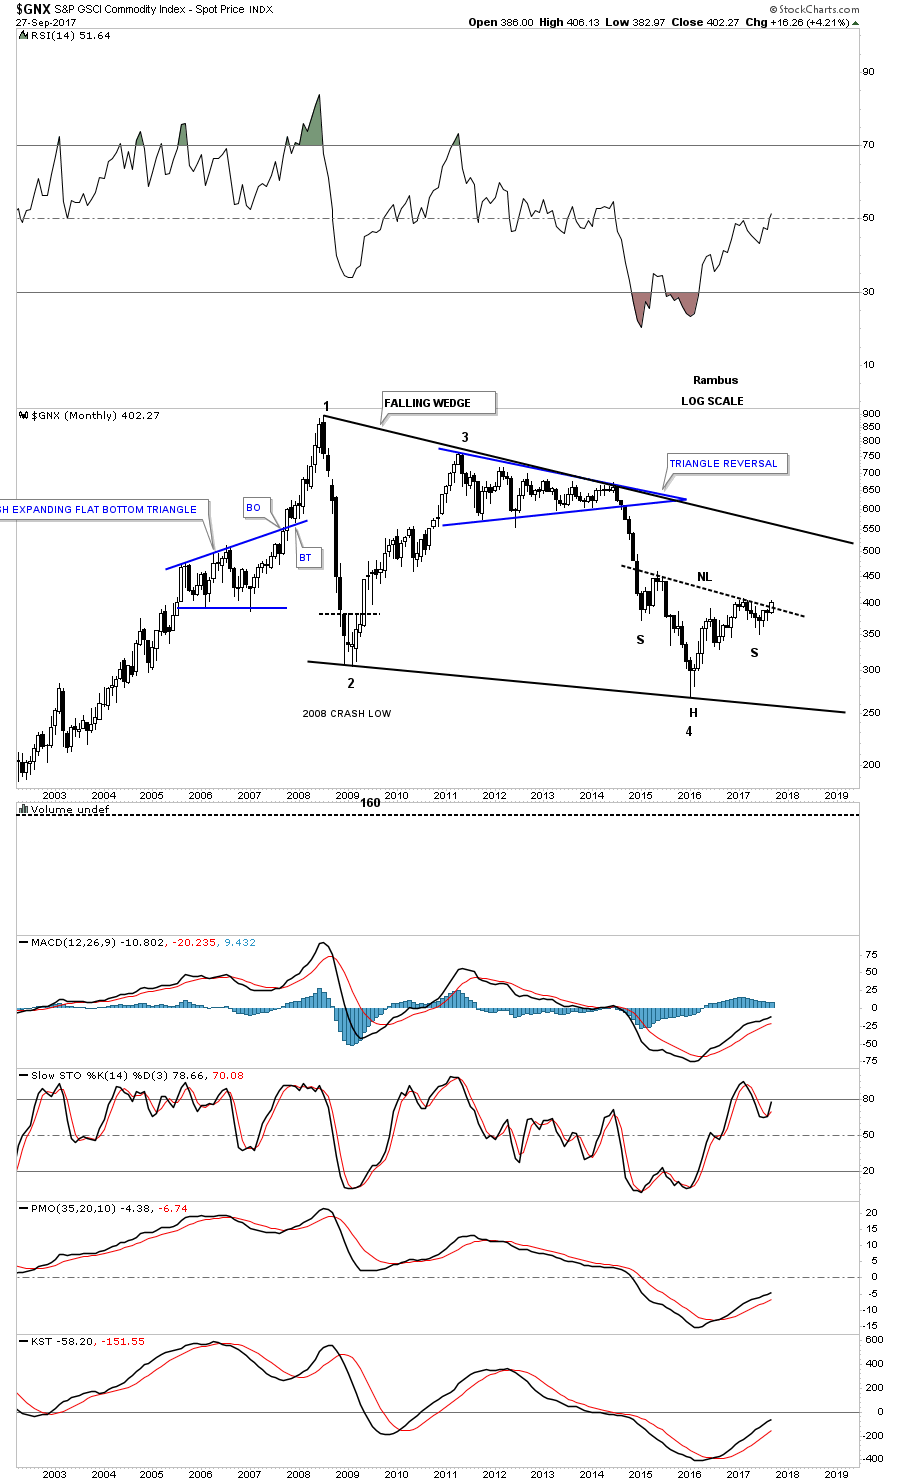
This next commodities index chart is monthly look at the $GNX which is in the process of breaking out above its neckline. Note how this H&S bottom is forming at the 4th reversal point in its 10 year falling wedge.
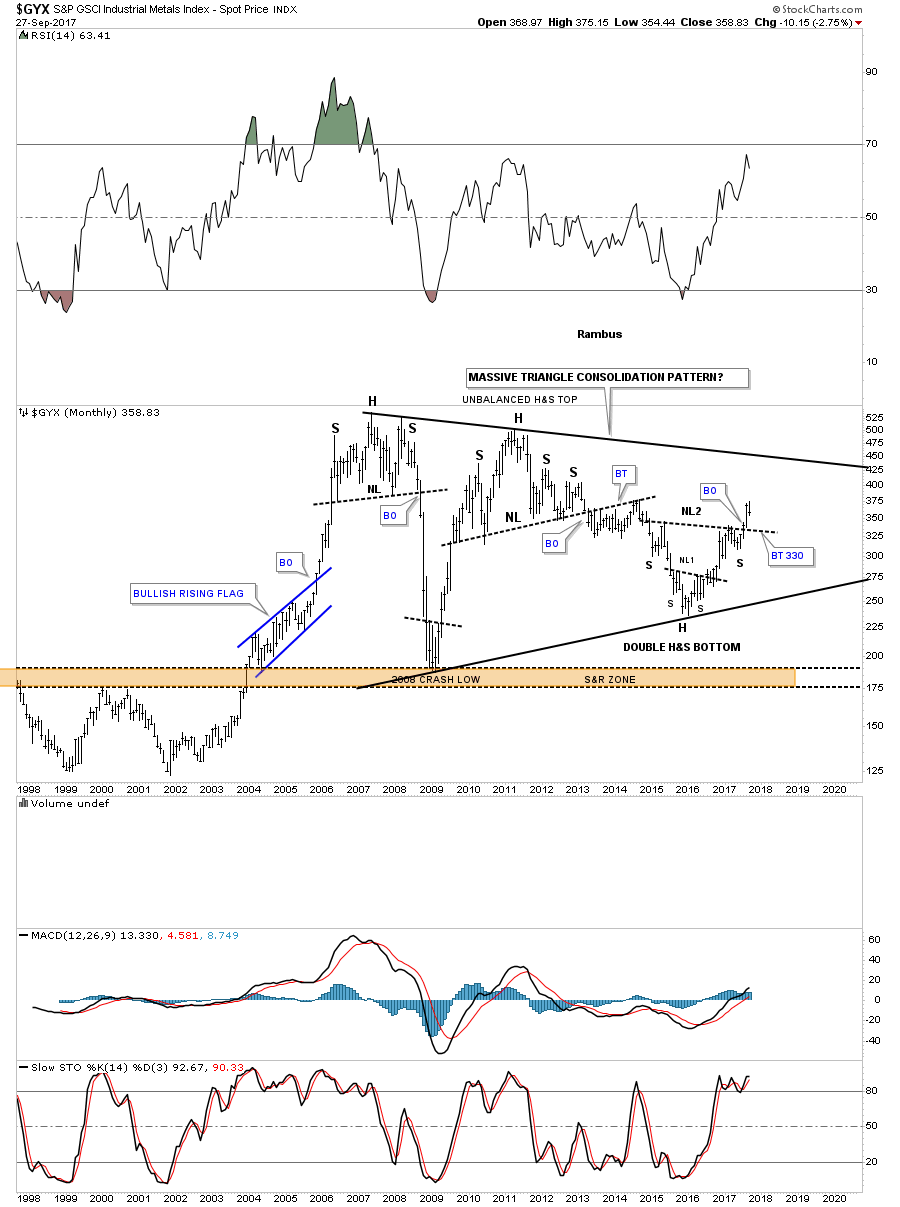
The $GYX, industrial metals index, is building out a double inverse H&S bottom at the 4th reversal point in its 10 year triangle. A backtest to the neckline would come in around the 320 area which should be expected, but not necessary.
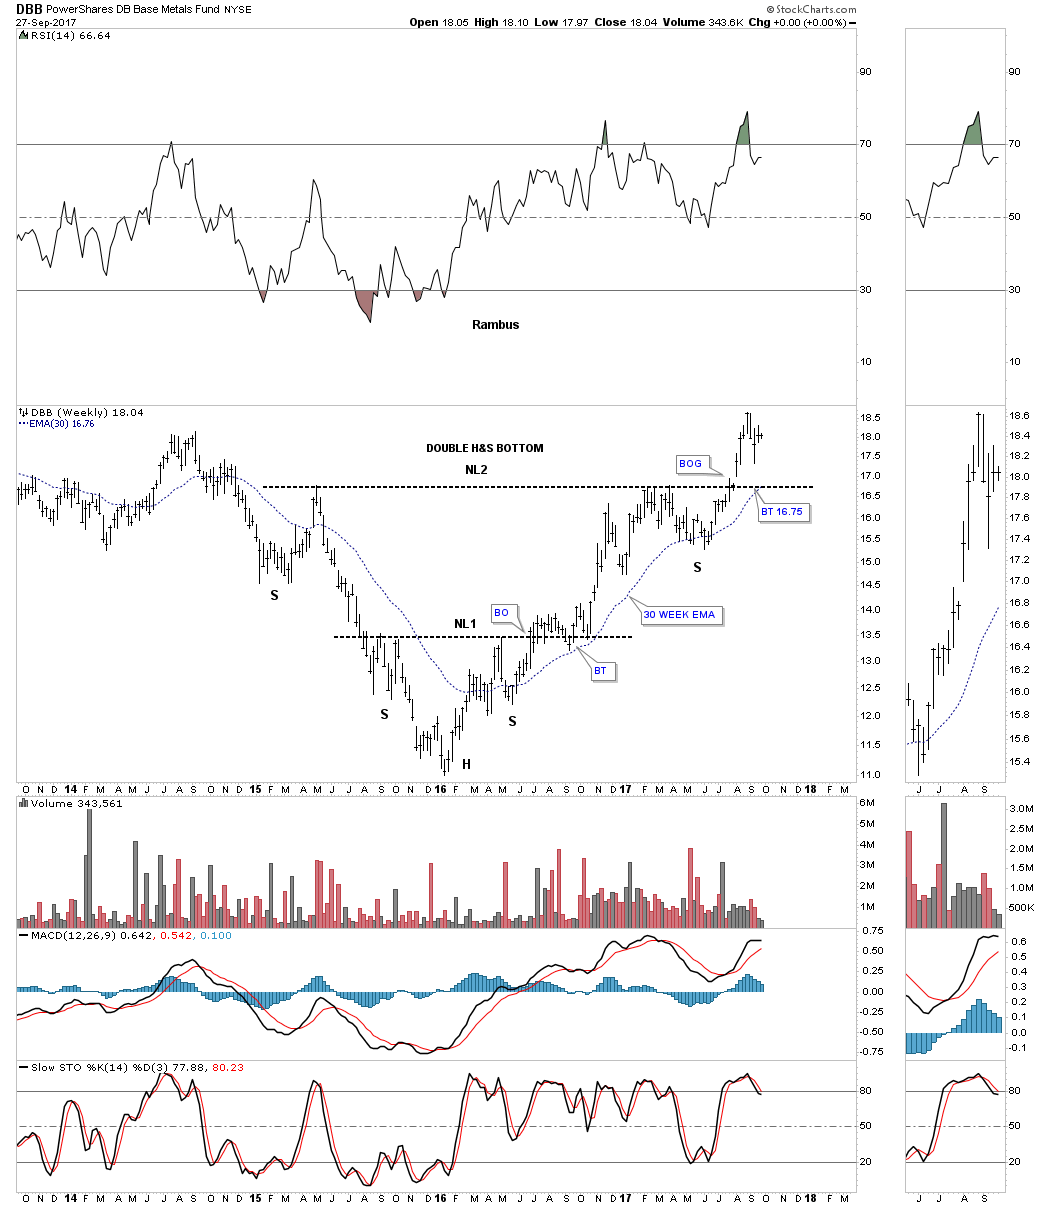
Another base metals index is the DBB which broke out of a double H&S bottom about 8 weeks ago with a breakout gap. A backtest to the neckline would come in around the 16.75 area along with the 30 week ema.
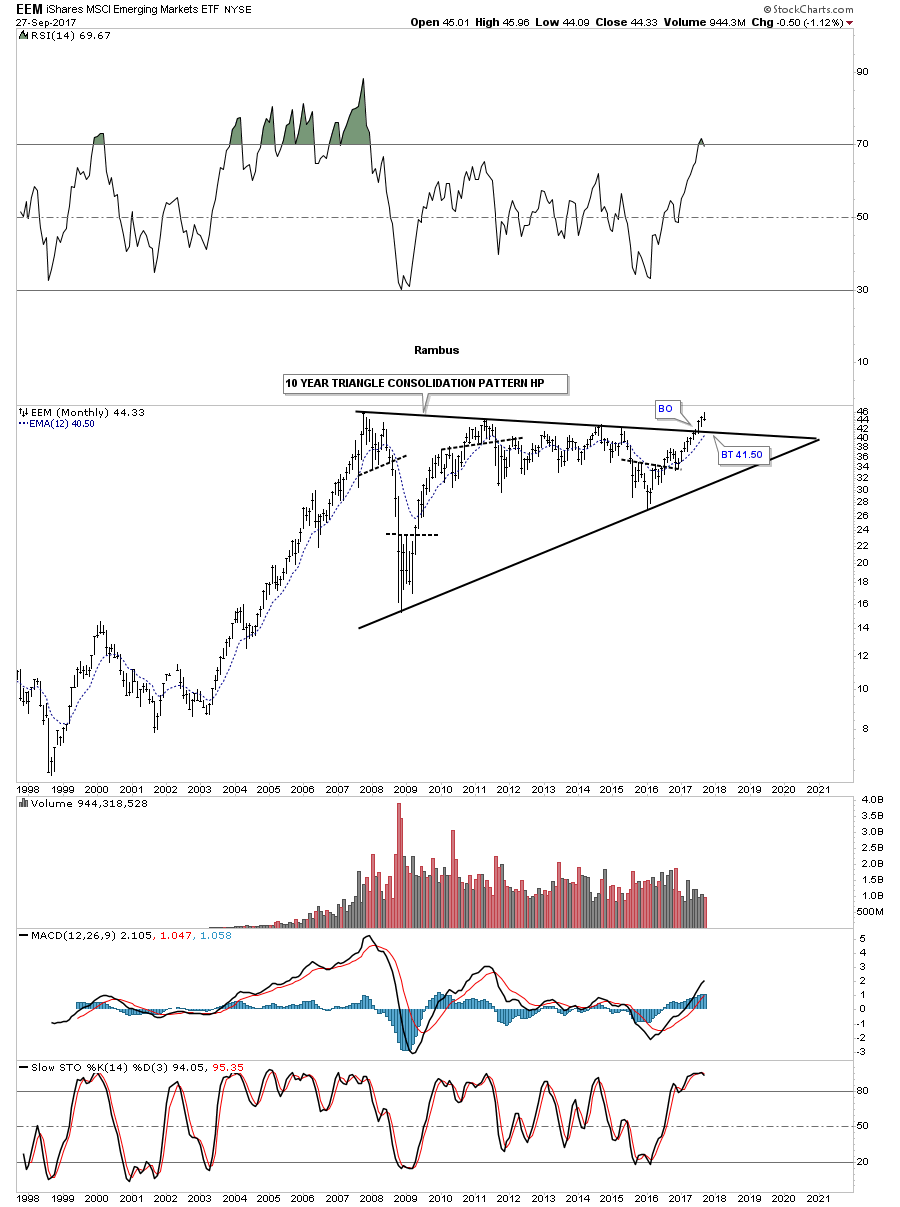
Now lets turn our attention to the emerging markets which is generally affected by the US dollar. The rule of thumb is that when the US dollar is weak it’s good for the emerging markets and vice a versa. Below is a 10 year look at the EEM, emerging market etf, which broke out of a massive 7 year expanding falling wedge. A backtest to the top rail would come in around the 41.85 area along with the 30 week ema.
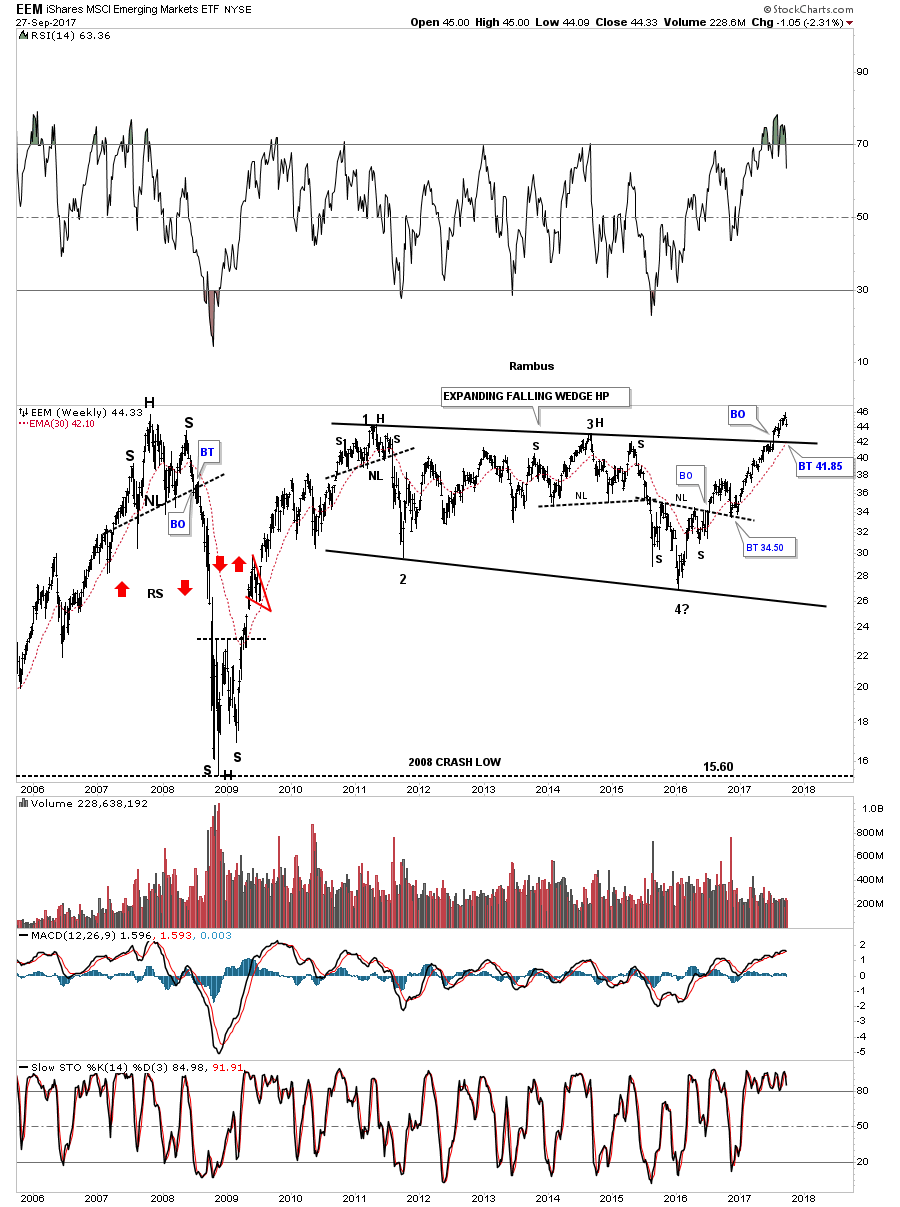
Believe it or not there is an even a bigger chart pattern building out on the EEM which is a 10 year triangle consolidation pattern. As you can see the breakout occurred 3 months ago with the possible backtest to the top rail in progress.
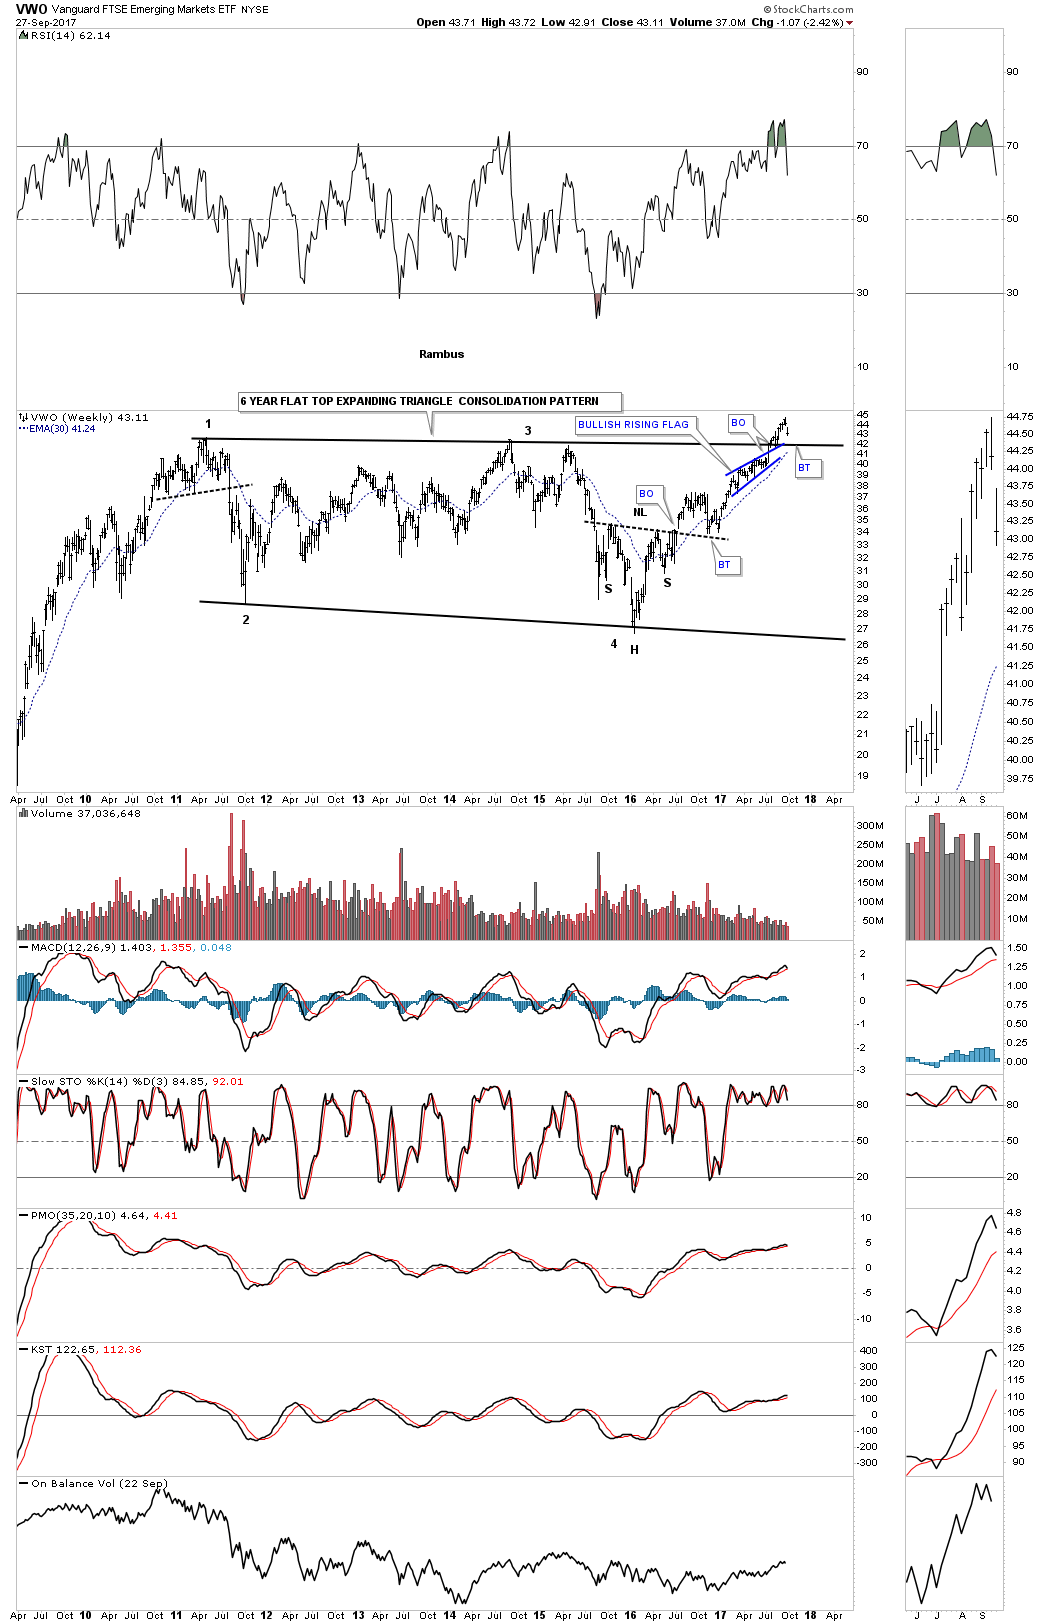
There is another emerging market etf I follow which is the VWO that broke out from its 6 year flat top expanding triangle and is now in the process of backtesting the top rail. Note how the blue bullish rising wedge formed just below the to rail just before the breakout. Classic Chartology.
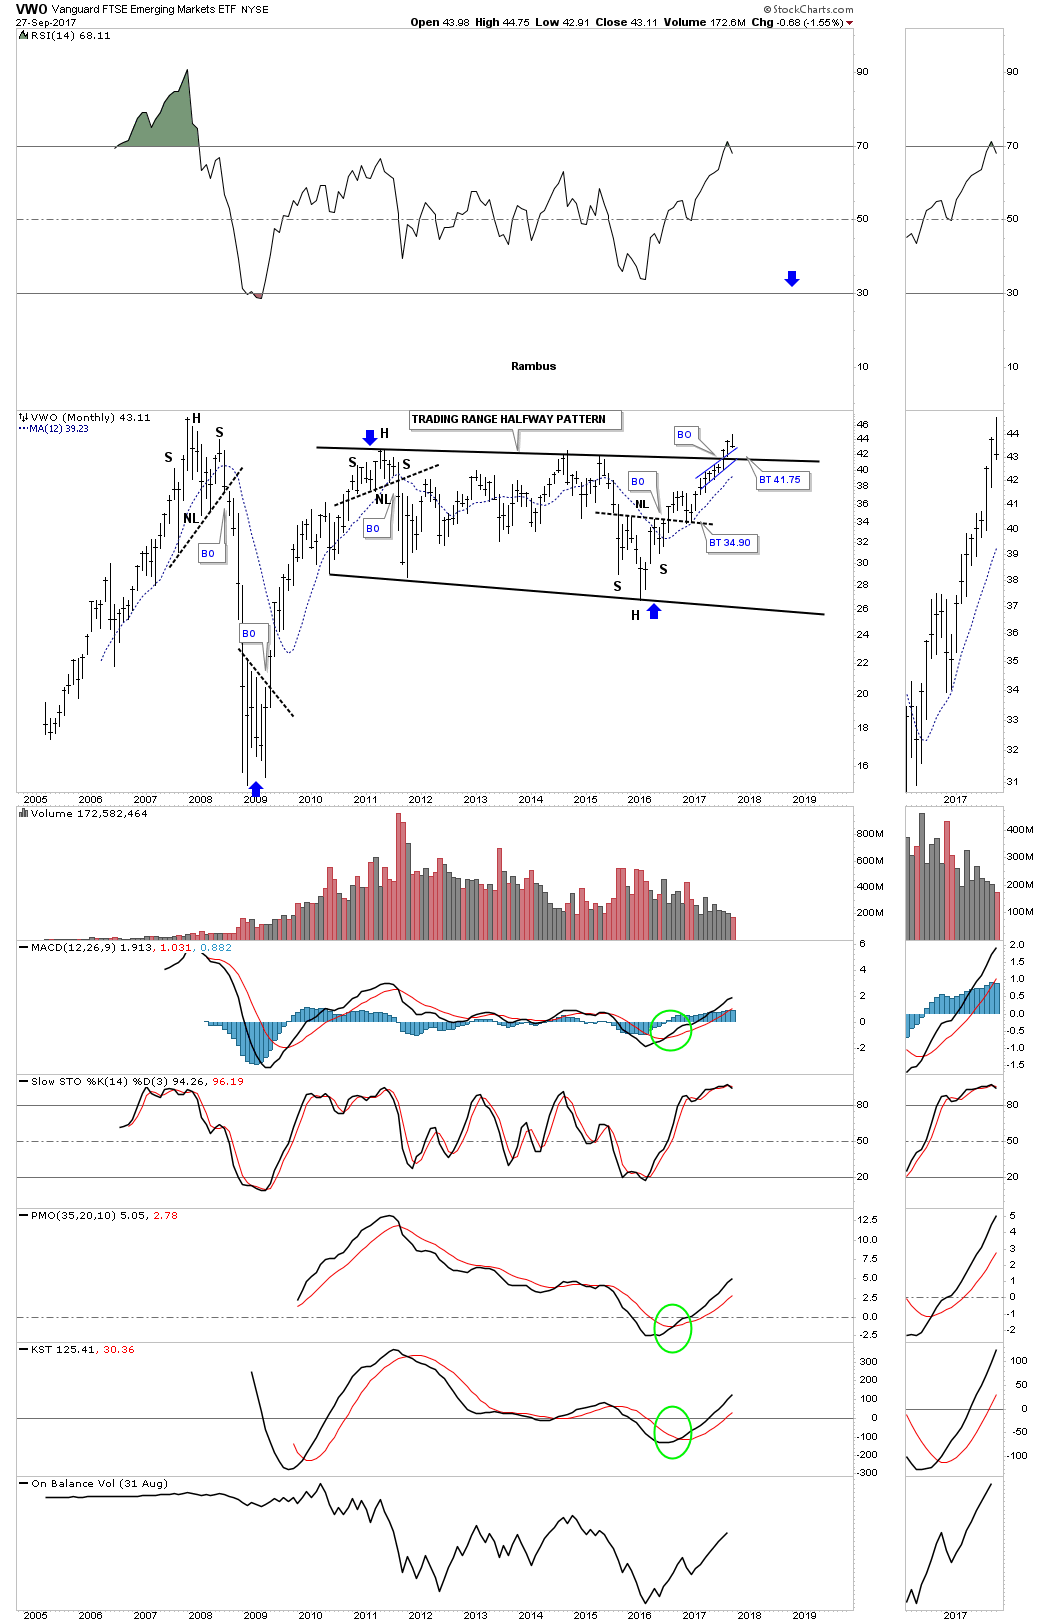
This monthly chart shows a complete backtest would come in around the 41.75 area.
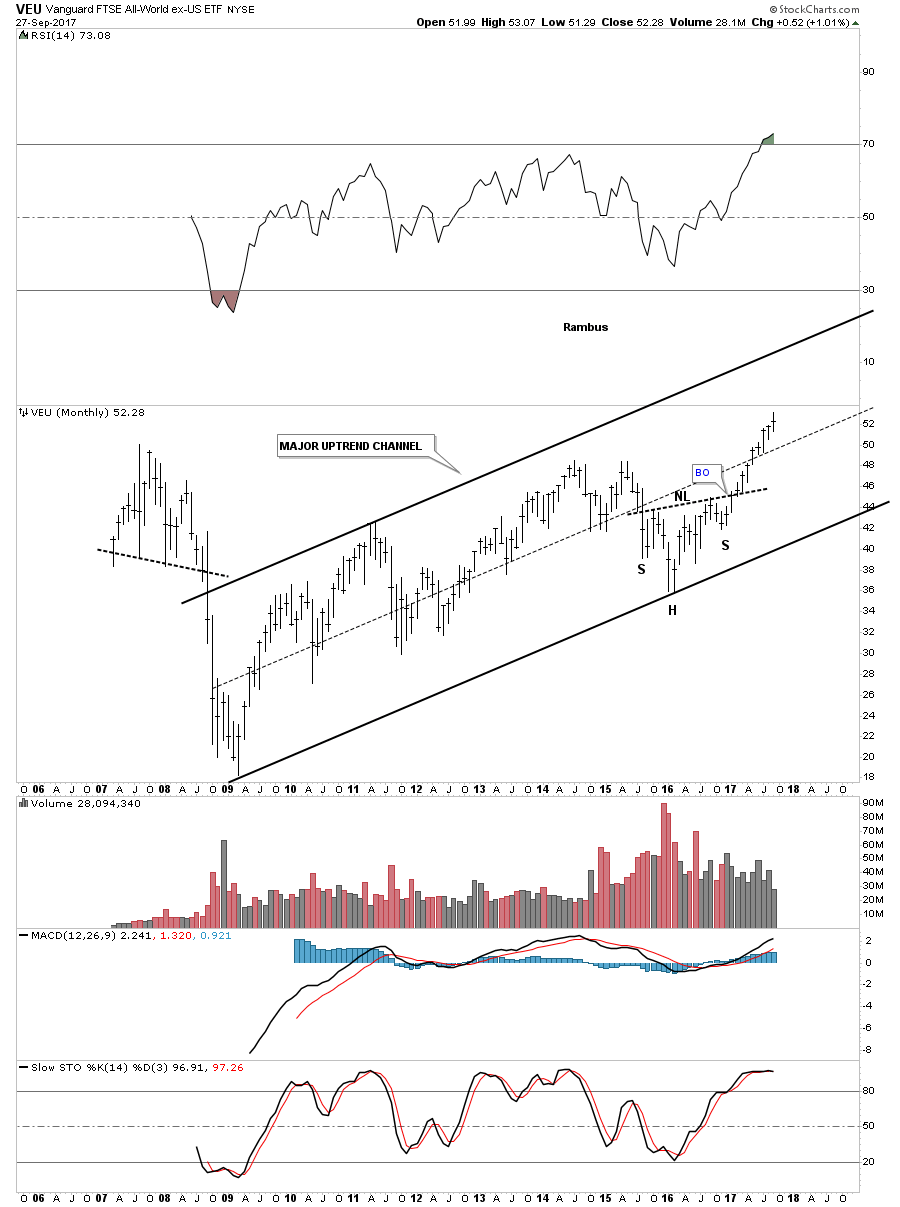
This last chart for tonight is a 10 year monthly look at the VEU which is an all world etf minus the US stock market. This chart gives you a good idea of how the rest of the world is doing, which looks very bullish as this index is making new all time highs within its 2009 bull market uptrend channel.
When looking at many of these commodity charts above you can see many H&S bottoms playing out on a large scale. Think of all the shares that had to trade by millions of investors to build out these reversal patterns. Regardless of what the US dollar is going to do these huge bottoms are going to be very difficult to change into something bearish. Trying to figure it all out from a fundamental point of view will be harder still. The patterns are there and until something changes these pattern, they are what they are. All the best…Rambus

-
I know Mike is a very solid investor and respect his opinions very much. So if he says pay attention to this or that - I will.
~ Dale G.
-
I've started managing my own investments so view Michael's site as a one-stop shop from which to get information and perspectives.
~ Dave E.
-
Michael offers easy reading, honest, common sense information that anyone can use in a practical manner.
~ der_al.
-
A sane voice in a scrambled investment world.
~ Ed R.
Inside Edge Pro Contributors

Greg Weldon

Josef Schachter

Tyler Bollhorn

Ryan Irvine

Paul Beattie

Martin Straith

Patrick Ceresna

Mark Leibovit

James Thorne

Victor Adair