
Energy & Commodities
Many of the reports published that cover oil consumption and how quickly consumers will embrace Electric Vehicles (EV) paint a far rosier outlook for the future of oil than the facts dictate. The reason is simple; most of these reports tend to be written or sponsored by big oil and so they tend to be biased. We are not stating that this is the end of oil, but its glory days are probably behind it. One thing is obvious; the peak oil theory experts are and were always full of rubbish. In fact, we penned several articles over the years covering this issue the latest of which was titled “peak oil debunked”.
Factors against big oil
Battery prices are plunging
The most expensive component in EV’s boils down to the battery. Battery prices have been plummeting at a very rapid rate. In 2016, Bloomberg noted that battery prices dropped 35%; bear in mind that was at the beginning of 2016. Battery prices have continued to plummet since then; in fact, the latest survey illustrates that battery prices have dropped 80% in just six years

John McElroy from Wards Auto penned an article where he states that several Experts at recent CES show stated that the DOE’s target of $125 per KW hour by 2022 might be conservative. They felt that the costs would drop below $100 before 2020 and shortly after that to around $80 per KW hour. Bloomberg goes on to state that by 2040, 35% of all vehicles sold would be electric, but this figure might be conservative.

If battery prices drop to below $100 per KW hour, then traditional cars could face stiff competition. Many experts believe that at $100 per Kwh is the point where the cost of the electric car becomes cost competitive with today’s internal combustion vehicles.
Lithium ion battery prices are now below $140 per KWh. Given the speed at which battery prices have dropped over the past six years, $80 could turn out to be a conservative target. If a price of $100 per kWh makes the EV competitive with today’s vehicles, then it appears that EV’s could put pressure on Big oil and the conventional auto industry a lot sooner than most experts are predicting.
The China factor
China is putting additional pressure on the Lithium Battery sector:
“According to Gaogong Industry Institute, some EV makers in China have proposed that battery vendors cut prices by 35-40% in 2017. Our China analyst Jack Lu sees this proposal as likely to proceed, as some battery vendors in China could still make a decent profit after such a cut.” Barrons
If such cost efficiencies are being achieved in 2017 and battery makers in China can still make a profit, it stands to reason that prices could easily drop another 50% between now and 2022. In fact, we feel that battery prices will probably be trading below $80 by 2020. Given the speed at which computing power is expanding every year, it is almost a given that engineers will find new ways to improve the efficiency of today’s battery while lowering its cost. Look at any new product; the initial cost was always high, but once mass production started, the cost plummeted.
Conclusion
New technology that’s gaining traction is nearly always disruptive, and those that fail to recognise its force are usually wiped out. Big oil assumes that demand will continue to rise due to higher automobile ownership globally. What they fail to recognise is that in the years to come, more individuals might opt for an EV as opposed to a car with an internal combustion engine.
EV technology has been around for a long time (over 150 years), but it never advanced because of its prohibitive cost. The cost has dropped, and EV’s have finally broken the 200-mile range barrier. With technological advances, the cost will continue to drop, and the range will continue to rise.
Big auto understands that change is coming and it’s coming fast; from Nissan (T:7201) to Ford (NYSE:F), auto manufacturers are spending billions gearing up for the future as they seem to understand that price is the only factor preventing many from embracing an EV. Ford is going to spend $4.5 billion from 2017-2020 on EV development. It is projecting that its electric SUV will have a range of 300 miles. Big Auto would not be spending billions if it did not foresee a massive change in the years to come.
Big oil could be facing a tumultuous future. However, this does not mean that oil prices are going to tank overnight. In Feb 2016, when oil was trading well below $30.00, we penned two articles on oil one in January 2016 and one in Feb 2016 where we stated that oil was likely to bottom and trend upwards.
While the outlook for big oil is not very bright in the long run, in the intermediate time frames, oil could continue to trend higher as it is still cheaper to buy a conventional oil powered car as opposed to one that is powered by a battery.
Final thought
Smart phones were almost unheard of 10 years ago; they were very expensive and clumsy. Today the prices have dropped so much that almost everyone has a smart phone. Most people could not imagine living without one. Could the same thing hold true for the electric vehicle of the future? Time will tell, but history proves that new technology is embraced the moment it becomes affordable; the current trajectory indicates that the most expensive component of an EV is going to continue dropping at a very rapid rate clip.

Briefly: In our opinion, full (150% of the regular full position) speculative short positions in gold, silver and mining stocks are justified from the risk/reward perspective at the moment of publishing this alert.
The biggest event of the previous week was the huge decline in the USD Index – the reaction of the precious metals market – especially the mining stocks – was very specific. What can we infer from the size and additional details of the metals and miners’ upswing?
Let’s take a look at the charts, starting with the USD Index (chart courtesy of http://stockcharts.com).
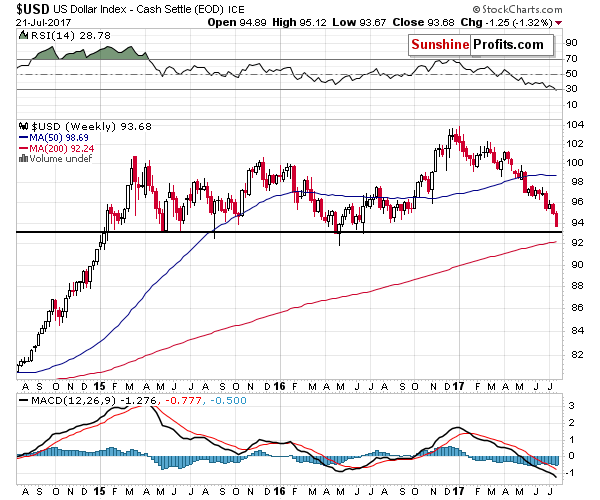
The USD Index broke below the late-2016 lows on Friday and there are a few things that we would like to stress. Firstly, the USD Index declined in an accelerated manner (reverse parabola), which is how the most volatile price swings end (remember the 2011 top in gold?). Secondly, the RSI indicator is the most oversold since the 2011 bottom (yes, the situation is so extreme at this point), while the fundamental picture still favors higher USD Index values (rising rates in the U.S. compared to expansive monetary policy in the EU and Japan, despite somewhat hawkish comments from Mario Draghi). Thirdly, while the USD broke through the short-term support levels, it is now approaching a long-term one – the 2015 and 2016 lows in terms of the weekly closing prices. They are just above the 93 level – about 0.6 below last week’s low. That’s only half of last week’s decline that would need to be seen for the USD to reach these key lows. In fact, just a repeat of Friday’s decline would almost be enough.
All of these factors point to a nearby reversal and the way that gold, silver, and – in particular – mining stocks have been reacting to the USD’s decline (to a limited extent) suggests that a reversal in the USD is likely to trigger a sharp decline in the precious metals sector.
Even if the USD was to repeat it’s Friday’s decline, would it be a good idea to bet on higher PM prices or even stay on the sidelines, especially given the recent show of volatility in silver?
All in all, our previous comments on the USD Index remain up-to-date:
Moving back to the current trend, let’s keep in mind that no market can move for long in a straight line up or down and there will be periodical corrections. Even within this short-term decline in the USD, there were corrective upswings. Let’s take a look at the most recent ones (one at the beginning of June and the second one at the end of June and the very beginning of July).
The USD Index moved higher by about an index point in each case – it turned out none of these rallies marked the end of the decline, but, the key question is how did the precious metals market reacted to these events. At the beginning of June, gold and silver declined substantially, then rallied back up a little when the USD resumed its downtrend, then declined again at the end of the June and it’s now moving back up as the USD continues to slide. Overall, however, gold is reacting strongly to the USD’s strength, even if it’s something temporary and relatively small, but it is reacting in a limited way to the USD’s short-term declines, even if they are significant. Overall, gold and silver remain in a downtrend even though the same thing is the case with the USD Index.
This means two things. Firstly, even if the short-term decline in the USD Index continues for some time, it will still be likely to be interrupted by corrective upswings, which will likely (just like was the case before) trigger bigger declines in the precious metals market – bigger than the preceding rallies.
Secondly, as soon as the USD Index forms the final bottom, and a big rally starts, gold and silver are likely to truly plunge – the size and sharpness of the decline in such a situation could be very significant.
Both things have one big implication for the precious metals investors – we could see either small rallies, or sizable declines, or enormous declines. This is a situation in which short positions appear appealing, not long ones.
Is there anything else that could point us to this direction besides the USD Index chart and comparing it to gold and silver prices? Yes.
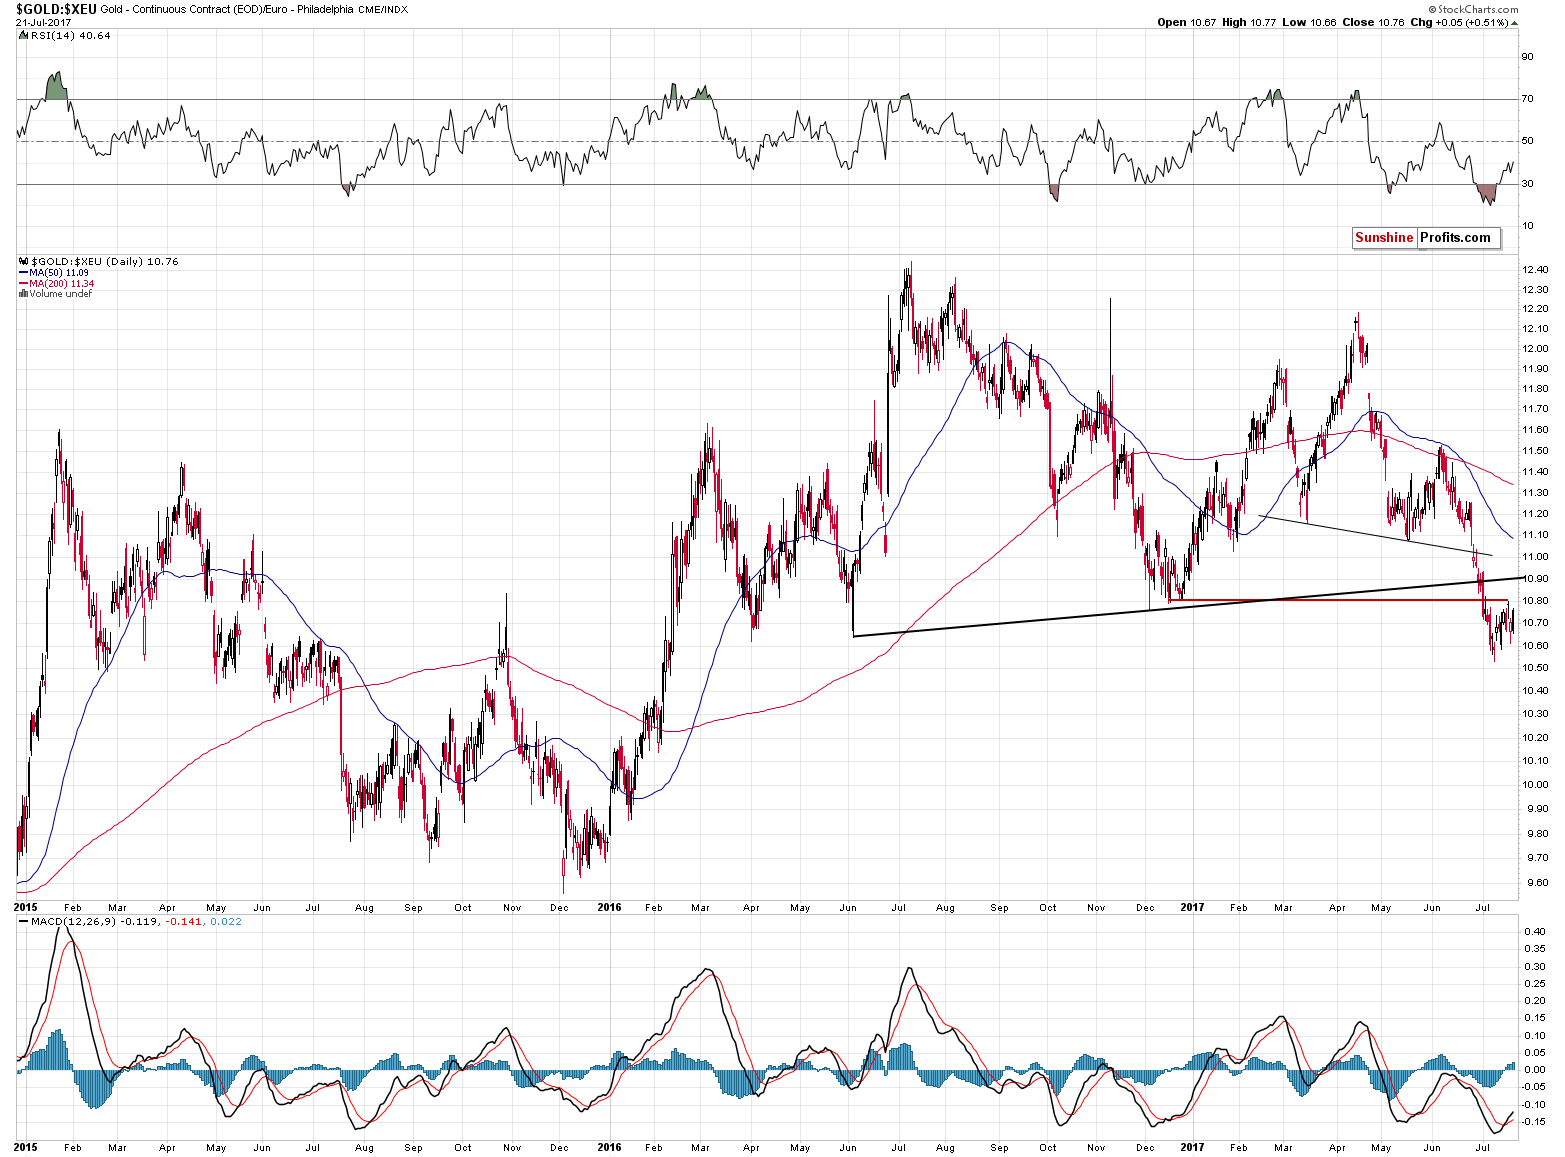
Friday’s session didn’t change the outlook in the case of gold’s price in terms of the euro and our previous comments remain up-to-date:
Gold priced in the euro has just verified its breakdown below the December 2016 low. The slide is now likely to continue. This means that gold’s underperformance relative to the USD Index is likely to continue and we could even see both decline simultaneously. That’s yet another reason for one not to view the decline in the USD Index as something significantly bearish.
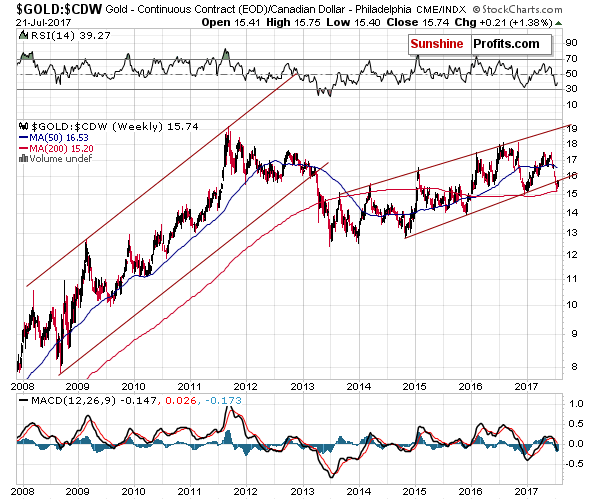
Gold’s performance in terms of the Canadian dollar is also bearish – the yellow metal broke below the long-term rising trend channel and verified this breakdown by moving back to it without breaking back above it. The breakdown was also confirmed in terms of weekly closing prices.
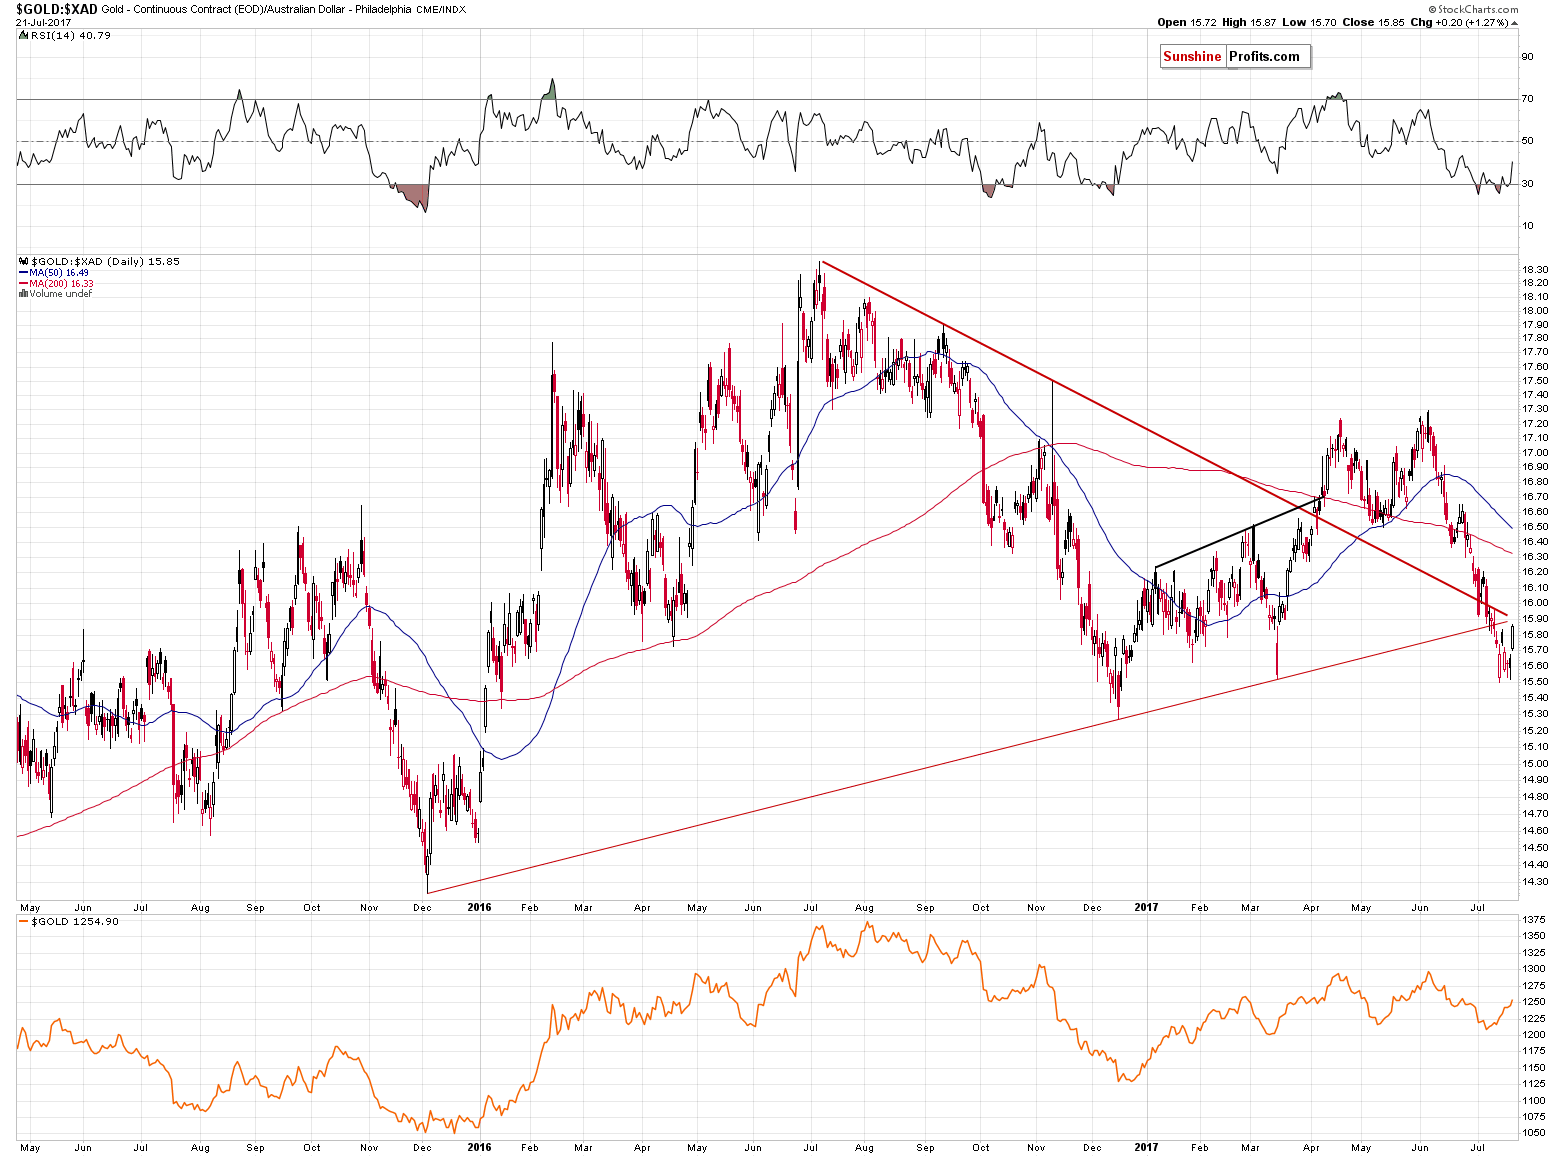
More or less the same is the case with gold priced in the Australian dollar. There was no trend channel in this case, but gold broke below 2 important support lines (one rising and one declining) anyway. Just like in the case of the breakdown in terms of the Canadian dollar, gold moved back to the previously broken lines but didn’t close the week back above them. The implications are bearish.
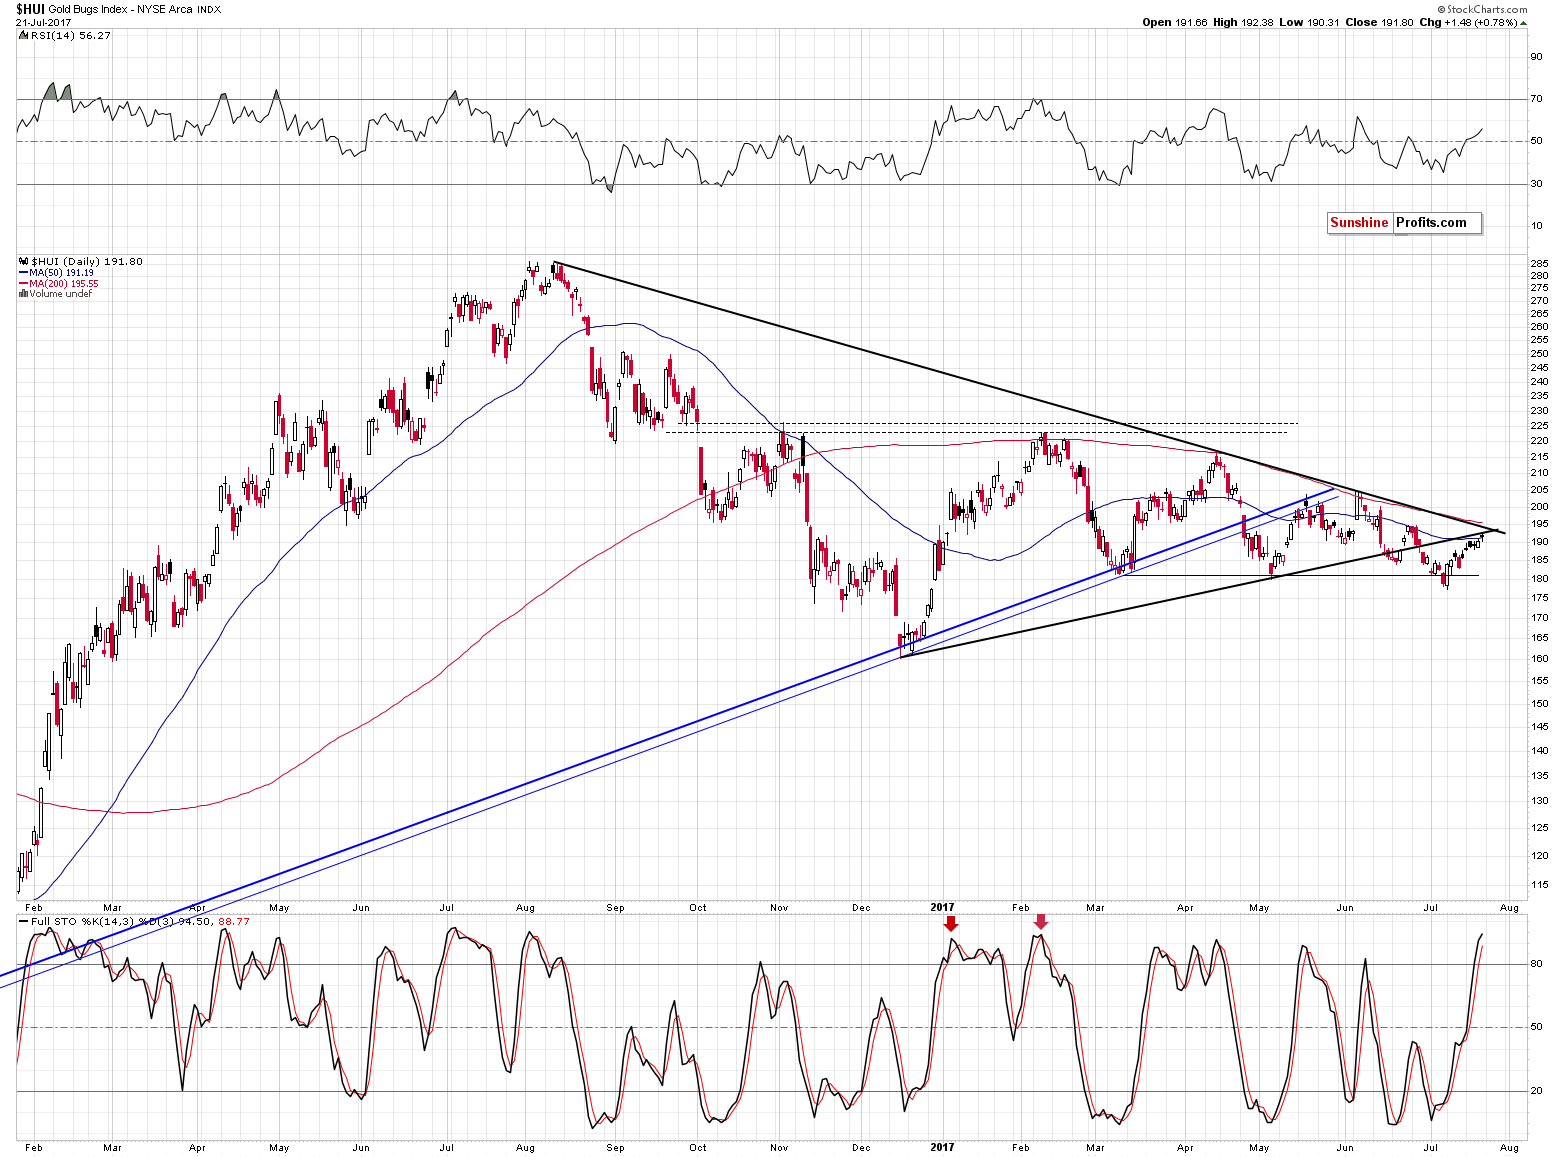
In the case of the gold stocks, we wrote the following on Friday:
The gold stocks’ reaction to yesterday’s decline in the USD and gold’s upswing was once again very weak. If a market doesn’t want to move in the way it “should” given what’s taking place in the case of its drivers (and there’s no doubt that the price of gold is the key driver behind gold stocks’ profits and thus prices), it is a strong indication that the market wants to move in the opposite direction and it’s waiting for a trigger.
For now, the trigger is absent as the USD Index continues to decline – however, the point is that since the USD Index is likely to reverse eventually which is likely to translate into a big plunge in miners and until it does… Miners don’t seem to be going anywhere. The nothing-or-big-decline situation is naturally a bearish one.
The above remains up-to-date as miners remain below two strong resistance lines – one declining one based on the August 2016, April 2017 and June 2017 highs and the second one based on the December 2016 and May 2017 lows. In a way, the entire July upswing in the miners was just a verification of the breakdown below the rising support black line.
The additional significant confirmation comes from the weekly volume readings.
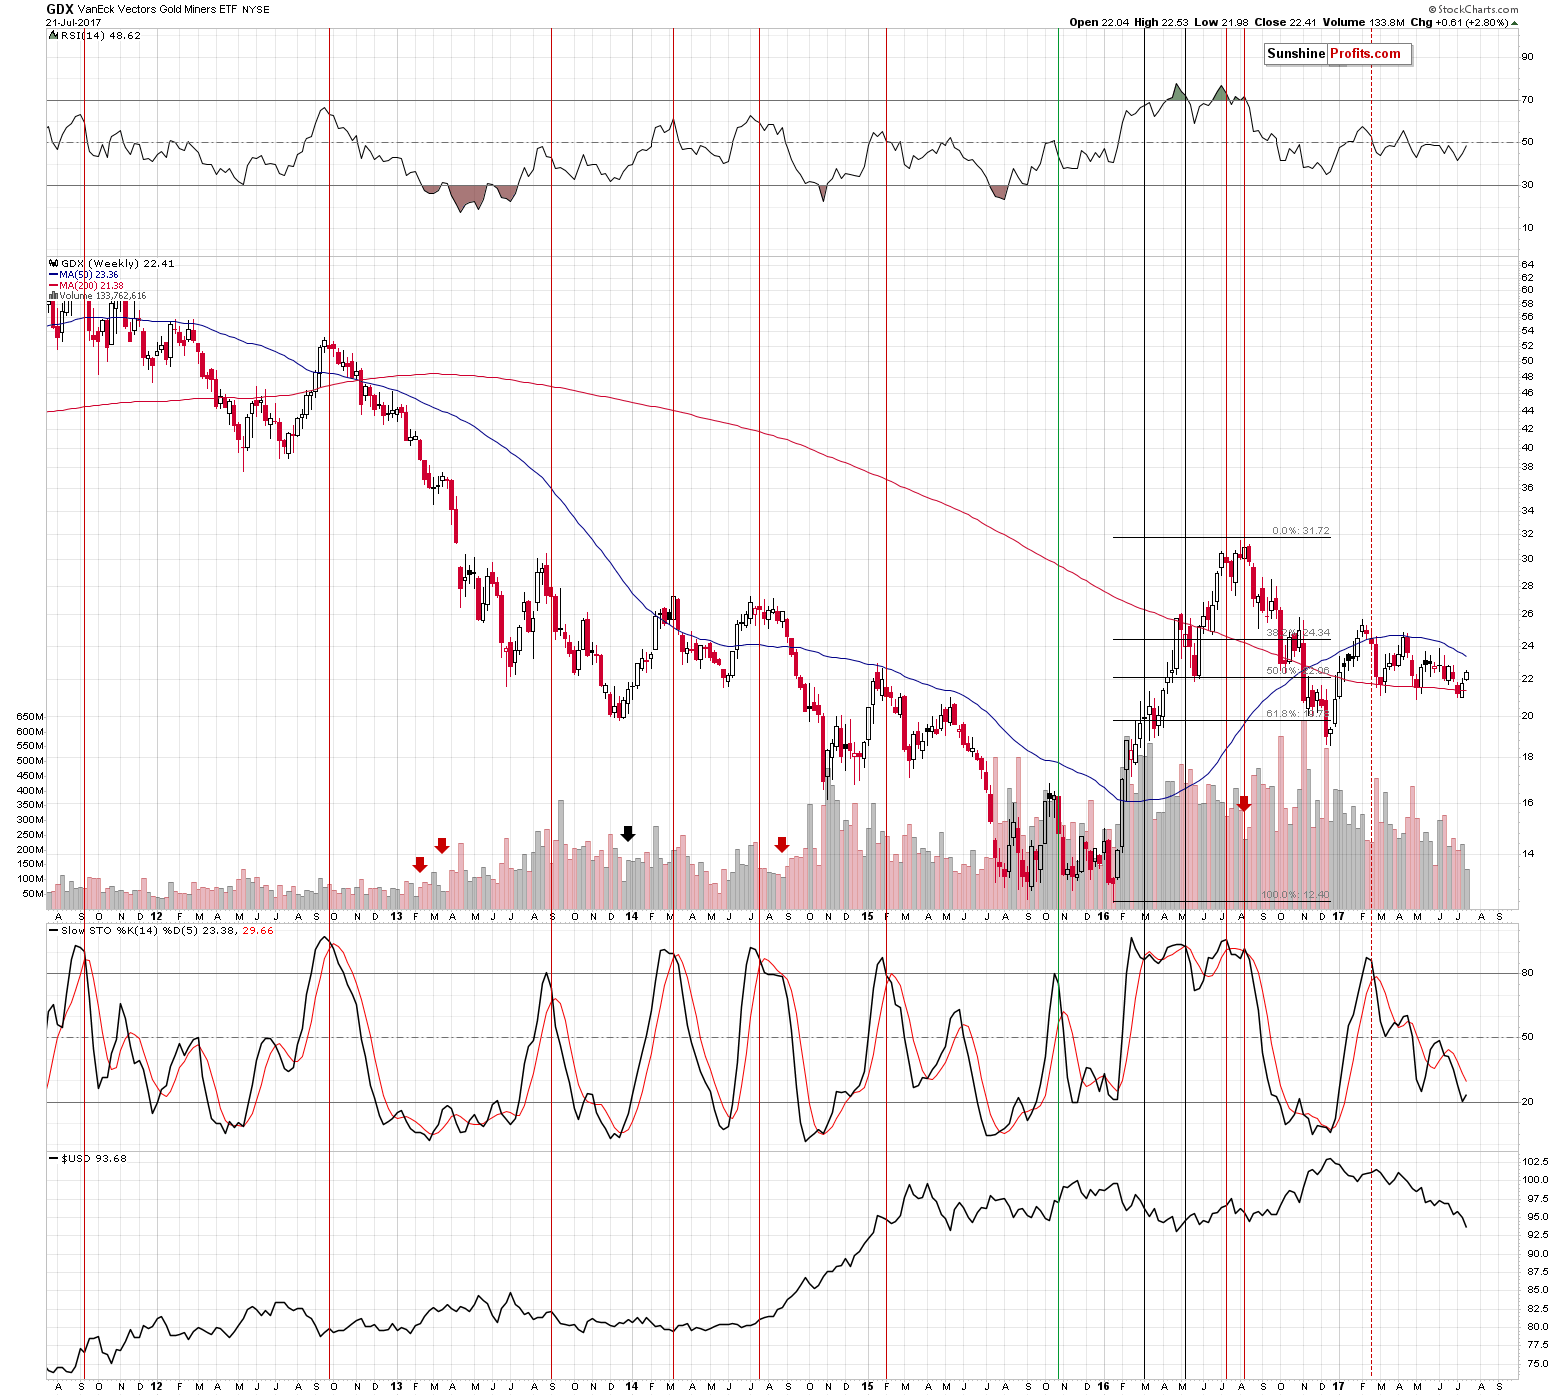
The volume that we saw last week was extremely low, especially when compared to the sizes of previous volumes. Theoretically, it’s a strong bearish sign as it shows that the buying power is next to non-existent.
We marked similar situations with red arrows – as you see, the weekly upswings that took place on very low volume were usually followed by huge declines. The only exception that we can see on the above chart (1 out of 5) is not quite comparable as it was the session right at the bottom and the current one is the second after the bottom, which changes a lot – the volume should be picking up right now, but it isn’t. Back in December 2013 it was the first candlestick of the rally – so the sellers might have given up and the buyers simply were able to push the market higher. Besides, trading is generally limited in the second half of December each year as it’s the holiday season.
So, it seems that in all comparable cases, huge declines followed the low-volume rallies in mining stocks – will this time be any different? It doesn’t seem likely. The efficiency of this signal alone is something that makes the outlook very bearish for the following weeks.
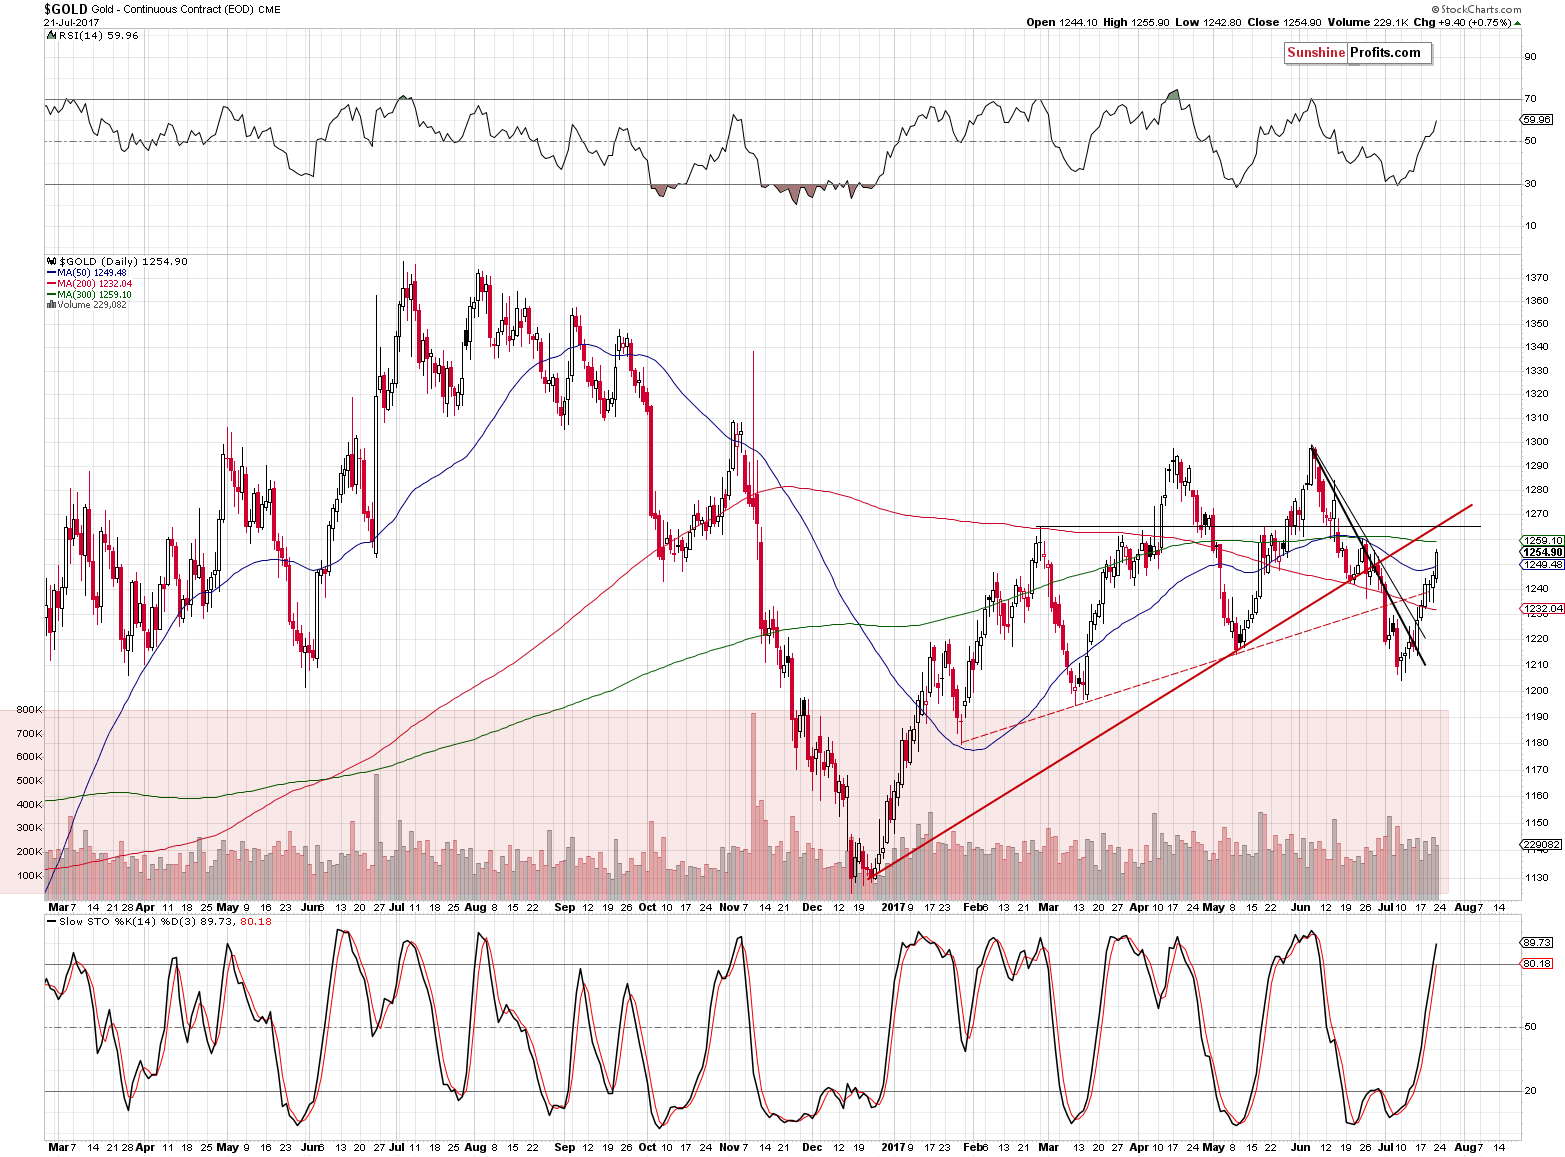
The precious metals are moving higher in terms of the USD, and their reaction continues to be limited – the moves may seem quite normal on the above charts, but gold and silver “should be” soaring given the reverse parabolic decline in the U.S. dollar.
Can gold and silver move higher temporarily? Yes, but very likely not much higher. Can gold and silver plunge shortly after reaching their tops and decline in a very volatile manner, similarly to what silver did recently? Naturally, that’s the key thing in the current situation – the downside potential is multiple times greater than the temporary upside potential.
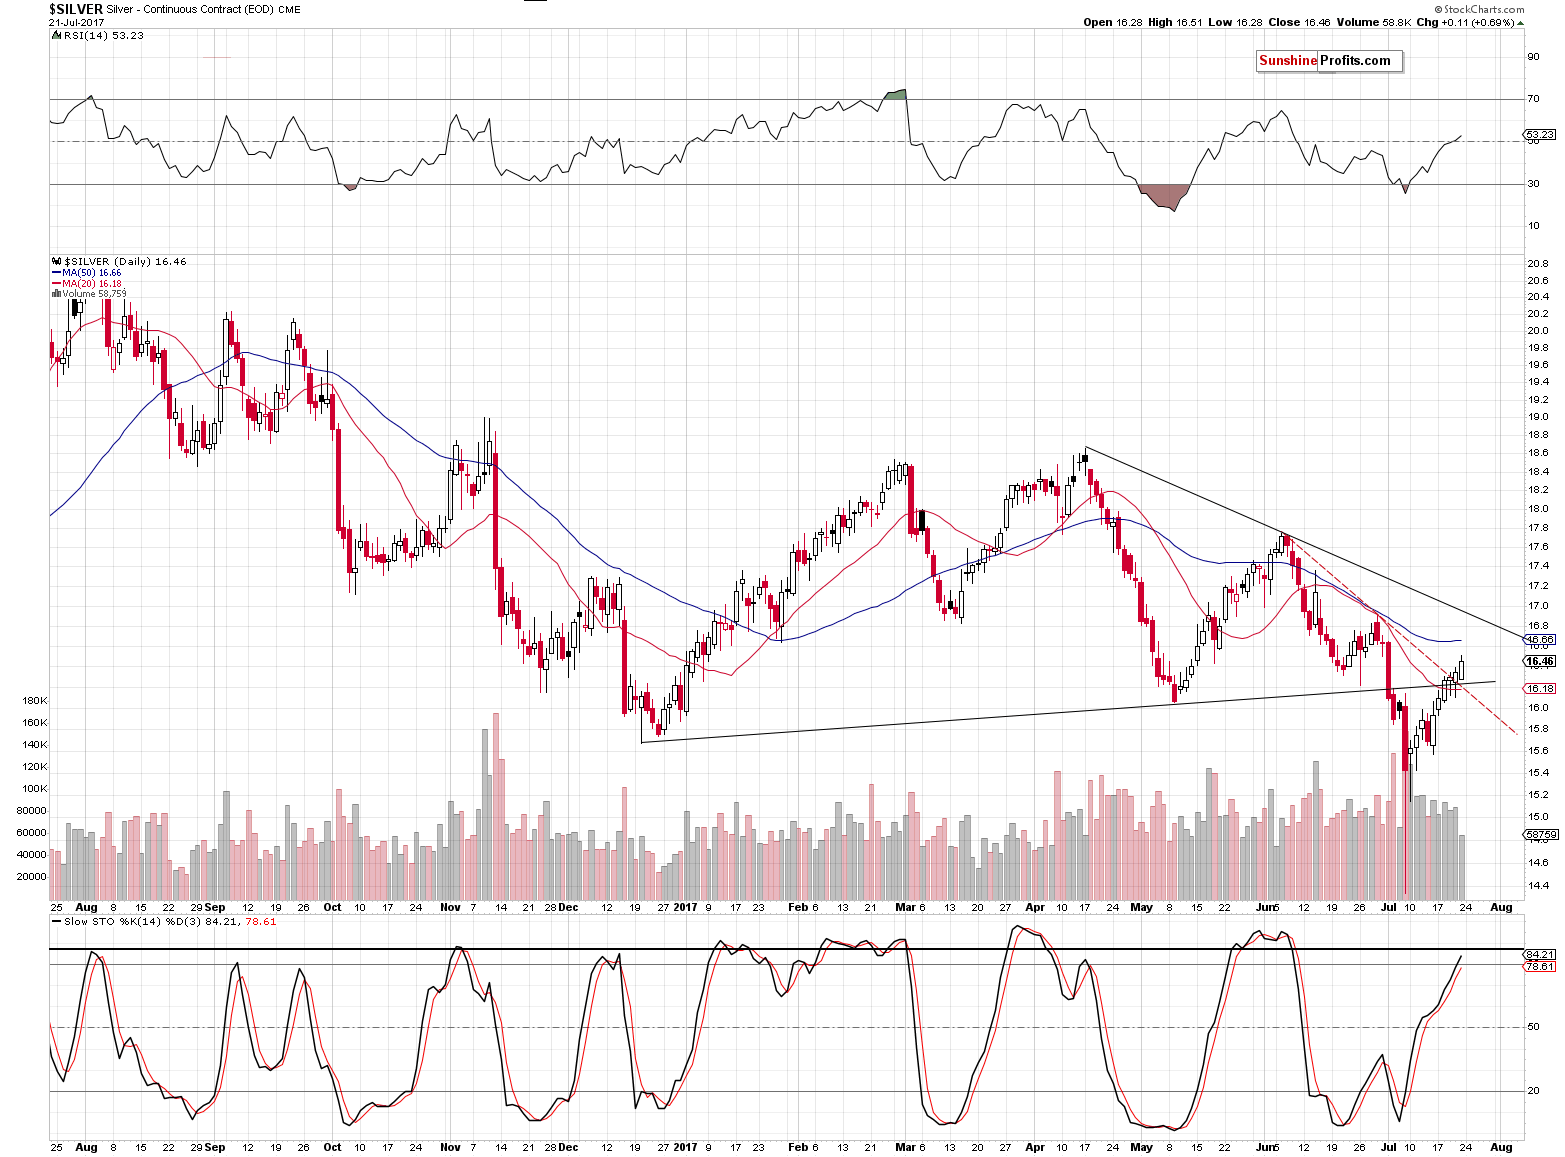
Gold could move to $1,265 or so (the previous top and the rising support line), but would that really matter if gold plunged over $150 shortly thereafter? The analogous price level for silver would be $16.90 and everyone saw recently just how fast silver could decline once it’s time for it.
Summing up, last week’s sessions didn’t invalidate multiple bearish points that we had made in our previous alerts and – despite the bullish nature of the week (after all, gold, silver and mining stocks closed higher last week than on the previously) – it was yet another case of the metals and miners’ underperformance given the action in the USD Index. The breakdowns in gold prices, in terms of currencies other than the U.S. dollar, were confirmed and we saw a major sell signal from the mining stocks – they rallied on very small volume last week, and in practically all similar cases from the recent past, this meant that a big decline was about to be seen. Any strength here is likely to be only temporary.
As always, we will keep you – our subscribers – informed.
To summarize:
Trading capital (supplementary part of the portfolio; our opinion): Short positions (150% of the full position) in gold, silver and mining stocks are justified from the risk/reward perspective with the following stop-loss orders and initial target price levels / profit-take orders:
- Gold: initial target price level: $1,063; stop-loss: $1,317; initial target price for the DGLD ETN: $81.88; stop-loss for the DGLD ETN $44.57
- Silver: initial target price: $13.12; stop-loss: $19.22; initial target price for the DSLV ETN: $46.18; stop-loss for the DSLV ETN $17.93
- Mining stocks (price levels for the GDX ETF): initial target price: $9.34; stop-loss: $26.34; initial target price for the DUST ETF: $143.56; stop-loss for the DUST ETF $21.37
In case one wants to bet on junior mining stocks’ prices (we do not suggest doing so – we think senior mining stocks are more predictable in the case of short-term trades – if one wants to do it anyway, we provide the details), here are the stop-loss details and initial target prices:
- GDXJ ETF: initial target price: $14.13; stop-loss: $45.31
- JDST ETF: initial target price: $417.04; stop-loss: $43.12
Long-term capital (core part of the portfolio; our opinion): No positions (in other words: cash)
Insurance capital (core part of the portfolio; our opinion): Full position
Thank you.
Sincerely,
Przemyslaw Radomski, CFA
Founder, Editor-in-chief, Gold & Silver Fund Manager
Since the Basic Materials sector is breaking out I would like to take an in-depth look at some of the stocks that make up the Basic Materials sector along with some commodities in general. Most commodities have had a tough go of it since they topped out in 2011, but there are some signs that they may be bottoming, which could lead to a substantial rally over the intermediate to the long term. As you will see some of the bottoming formations are very symmetrical while others are pretty ugly, but as long as they can make a higher high and higher low an uptrend is in place.
Lets start with the CRB index which built out a one year bearish rising wedge formation that broke to the downside in March of this year. The price action has been chopping to the downside and has gotten a bounce to the upside in late June. Normally the price objective of a rising wedge is down to the first reversal point where the pattern started to build out.
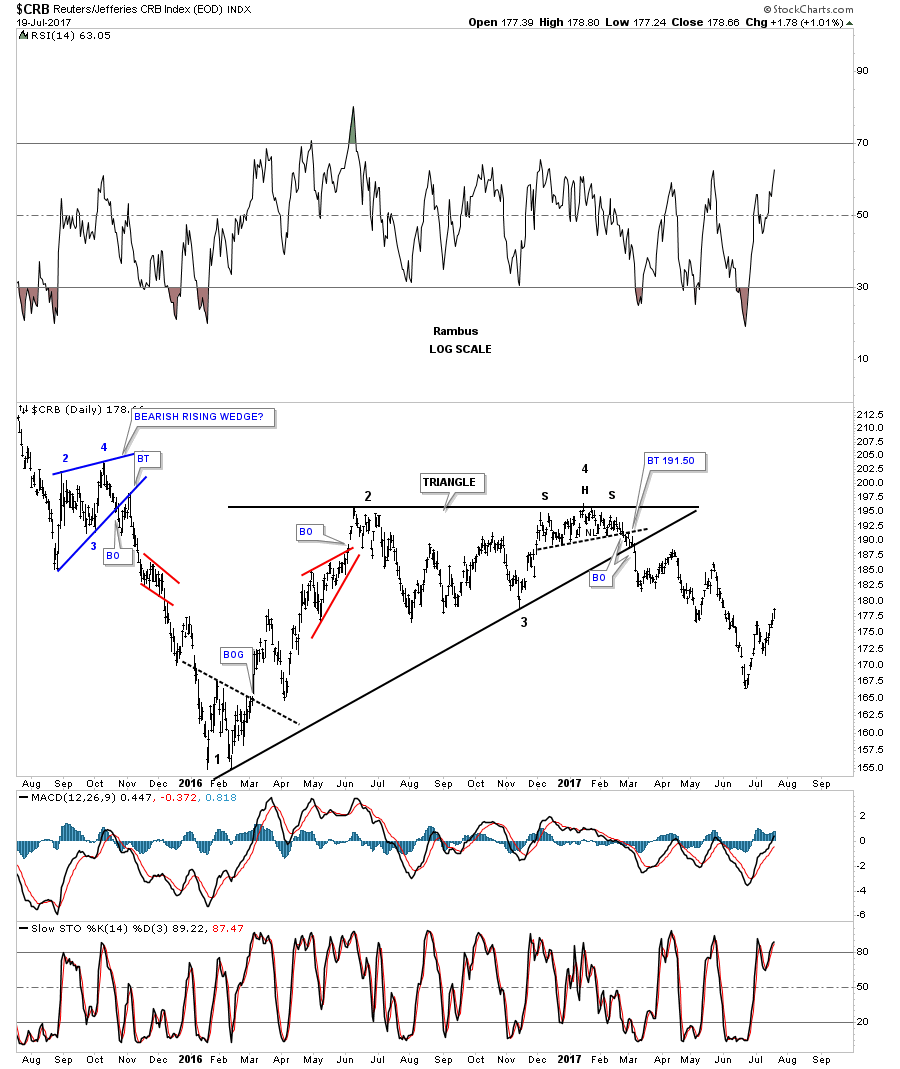
There is another pattern I’ve been keeping a close eye on which may have given us a good clue today that we may have a consolidation pattern building out which is forming above the January 2016 low. As you can see on this long term daily chart for the CRB index it has built out a sideways trading range which broke to the downside last month, which wasn’t a bullish development if one was bullish on this index.


Oil prices jumped almost 1.5 per cent on Wednesday, extending gains after a U.S. government report showed a bigger weekly draw than forecast in crude and gasoline stocks along with a surprise drop in distillate inventories.
The Energy Information Administration (EIA) said U.S. crude stocks fell 4.7 million barrels during the week ended July 14. , exceeding estimates for… CLICK HERE for the complete article
 In early May, 2017, we alerted our follwers to a trading opportunity that resulted in a nearly perfect Momentum Reversal Method (MRM) setup – this trade was MOBL (Mobileiron Inc). Now that the trade has completed, we wanted to share with you an example of how the MRM trading strategy works and how successful some of these setups can become. But first, lets take a bit of time to understand what ActiveTradingPartners.com is and how we provide benefit and services to our clients.
ActiveTradingPartners.com is a research and analytics firm that specialized in US Equities, ETFs and major Commodities analysis. Our objective is to continually provide updated research and analytics for our members as well as to actively deploy our specialized Momentum Reversal Method (MRM) trading strategy for our members use and benefit. As many of you may remember, on June 11 2017, we posted our research that the “NASDAQ would sell off” and the “VIX would SPIKE” on or near June 29th, 2017. How many of you would have loved to know that we predicted a 6% swing in the NASDAQ and a 52% swing in the VIX two weeks in advance on the EXACT DAY it happened?
What we are trying to illustrate to you is that we attempt to provide value beyond our trading signals and beyond our daily updates. We attempt to keep you aware of what is likely to happen in the global markets and how these swings can be advantageous for you as traders/investors. So, before we get sidetracked on the extras we provide, lets focus on this MOBL trade.
MOBL began to appear on our MRM alerts in early April 2017. As with many of the MRM type of setups, they begin can sometimes start to alert us to setups days or weeks in advance of the actual move. In this case, classic technical and Fibonacci analysis assisted in confirming our MRM trigger. The MRM setup was valid and we simply wanted to watch the MRM setup for signs of price volume/rotation. We often use this price/volume rotation trigger as a means of setting up entry functions for pending MRM triggers.
In early May 2017, the price/volume rotation trigger was complete and now we had a valid entry into MOBL with projected targets of $5.45 and $6.25. Our analysts identify the targets based on recent price action, where our entry is located and current price/volume rotation levels. In other words, if we believe the move will be short-term, then we will adjust our targets to focus on immediate objectives. If we believe the move will be a bit longer-term, then we will adjust our targets to focus on that objective.
Just to be clear, everything originates from the MRM trigger. We may see 20 or 30 of these triggers each week. From there, price confirmation MUST occur or have already happened in order for it to be considered for our ATP members. Additionally, we attempt to gauge the overall global markets in terms of risk parameters for each MRM setup/trigger. If the US majors or global markets are weak and fearful, then we’ll address that risk by being more selective of our MRM triggers and setups. If our analysts believe the US and global markets are going to continue to trend, then we may widen our risk parameters a bit more.
On May 11th, 2017, we issued a BUY Swing Trade Alert for MOBL @ $4.65 for a FULL Position. This exact alert read as follows:
Buy Symbol: MOBL
Max Buy Price: $4.85 or lower
Position Size: FULL
Stop loss: Close below $3.95
Target: $5.45, then $6.25 objective for a 17~35%+ swing potential
Enter FULL position below $4.85 today. A move above $5.35 is expected with a potential for a move above $6.50 later.
As you can see from these charts, we executed the MOBL trade flawlessly. The first target was hit only 6 trading days after entry for a +17% gain. The second target took a bit longer, but it was eventually hit 26 trading days after entry (about one month after entry). It was just prior to the second target being hit that our research team indicated that MOBL could run much higher and that we should alert our members that we are going to use Target #2 as a stop adjustment and attempt to let this position run. Typically, we get about 2~4 of these types of trades each calendar year for our members – you know, the big breakout runners that can turn into 30%, 50%, 120% or more.
In early May, 2017, we alerted our follwers to a trading opportunity that resulted in a nearly perfect Momentum Reversal Method (MRM) setup – this trade was MOBL (Mobileiron Inc). Now that the trade has completed, we wanted to share with you an example of how the MRM trading strategy works and how successful some of these setups can become. But first, lets take a bit of time to understand what ActiveTradingPartners.com is and how we provide benefit and services to our clients.
ActiveTradingPartners.com is a research and analytics firm that specialized in US Equities, ETFs and major Commodities analysis. Our objective is to continually provide updated research and analytics for our members as well as to actively deploy our specialized Momentum Reversal Method (MRM) trading strategy for our members use and benefit. As many of you may remember, on June 11 2017, we posted our research that the “NASDAQ would sell off” and the “VIX would SPIKE” on or near June 29th, 2017. How many of you would have loved to know that we predicted a 6% swing in the NASDAQ and a 52% swing in the VIX two weeks in advance on the EXACT DAY it happened?
What we are trying to illustrate to you is that we attempt to provide value beyond our trading signals and beyond our daily updates. We attempt to keep you aware of what is likely to happen in the global markets and how these swings can be advantageous for you as traders/investors. So, before we get sidetracked on the extras we provide, lets focus on this MOBL trade.
MOBL began to appear on our MRM alerts in early April 2017. As with many of the MRM type of setups, they begin can sometimes start to alert us to setups days or weeks in advance of the actual move. In this case, classic technical and Fibonacci analysis assisted in confirming our MRM trigger. The MRM setup was valid and we simply wanted to watch the MRM setup for signs of price volume/rotation. We often use this price/volume rotation trigger as a means of setting up entry functions for pending MRM triggers.
In early May 2017, the price/volume rotation trigger was complete and now we had a valid entry into MOBL with projected targets of $5.45 and $6.25. Our analysts identify the targets based on recent price action, where our entry is located and current price/volume rotation levels. In other words, if we believe the move will be short-term, then we will adjust our targets to focus on immediate objectives. If we believe the move will be a bit longer-term, then we will adjust our targets to focus on that objective.
Just to be clear, everything originates from the MRM trigger. We may see 20 or 30 of these triggers each week. From there, price confirmation MUST occur or have already happened in order for it to be considered for our ATP members. Additionally, we attempt to gauge the overall global markets in terms of risk parameters for each MRM setup/trigger. If the US majors or global markets are weak and fearful, then we’ll address that risk by being more selective of our MRM triggers and setups. If our analysts believe the US and global markets are going to continue to trend, then we may widen our risk parameters a bit more.
On May 11th, 2017, we issued a BUY Swing Trade Alert for MOBL @ $4.65 for a FULL Position. This exact alert read as follows:
Buy Symbol: MOBL
Max Buy Price: $4.85 or lower
Position Size: FULL
Stop loss: Close below $3.95
Target: $5.45, then $6.25 objective for a 17~35%+ swing potential
Enter FULL position below $4.85 today. A move above $5.35 is expected with a potential for a move above $6.50 later.
As you can see from these charts, we executed the MOBL trade flawlessly. The first target was hit only 6 trading days after entry for a +17% gain. The second target took a bit longer, but it was eventually hit 26 trading days after entry (about one month after entry). It was just prior to the second target being hit that our research team indicated that MOBL could run much higher and that we should alert our members that we are going to use Target #2 as a stop adjustment and attempt to let this position run. Typically, we get about 2~4 of these types of trades each calendar year for our members – you know, the big breakout runners that can turn into 30%, 50%, 120% or more.

When all was said and done, Our VIX/NASDAQ analysis was perfect and the rotation in the tech markets resulted in our MOBL trade getting stopped out July 3rd, 2017 @ $5.85 for a +25.6% gain. This single trade resulted in a +$4000 total return for our members – this one trade will cover their ActiveTradingPartners.com membership for almost FOUR YEARS. Believe it or not, we are expecting MOBL to generate another MRM setup soon that could allow us to re-enter this trade for the next run higher.


-
I know Mike is a very solid investor and respect his opinions very much. So if he says pay attention to this or that - I will.
~ Dale G.
-
I've started managing my own investments so view Michael's site as a one-stop shop from which to get information and perspectives.
~ Dave E.
-
Michael offers easy reading, honest, common sense information that anyone can use in a practical manner.
~ der_al.
-
A sane voice in a scrambled investment world.
~ Ed R.
Inside Edge Pro Contributors

Greg Weldon

Josef Schachter

Tyler Bollhorn

Ryan Irvine

Paul Beattie

Martin Straith

Patrick Ceresna

Mark Leibovit

James Thorne

Victor Adair