
Energy & Commodities
Yesterday’s session was not like the previous ones – in the previous days, the precious metals sector moved lower together and mining stocks were leading the way. Yesterday, gold and silver declined, but miners were barely affected. Does this strength indicate a likely turnaround?
Miner’s Outperformance
In short, that’s not likely. Miners had a very good reason to rally. The general stock market soared yesterday and mining stocks, being stocks themselves were positively affected by this development. This is something that happens quite often, but let’s keep in mind that this effect is usually temporary. Ultimately, the gold stocks’ profits depend on the price of gold and thus this is the key driver of the miners’ prices. Let’s see exactly how much the mentioned markets moved (chart courtesy of http://stockcharts.com).
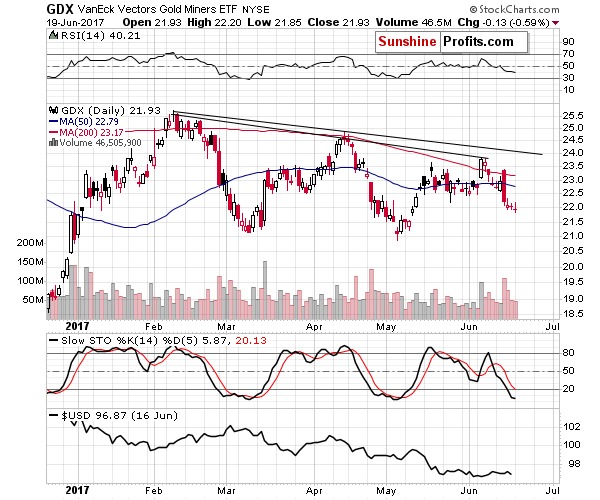
The GDX ETF was down by 13 cents which is next to nothing. The volume was rather average and the entire session was yet another day of a post-decline pause.
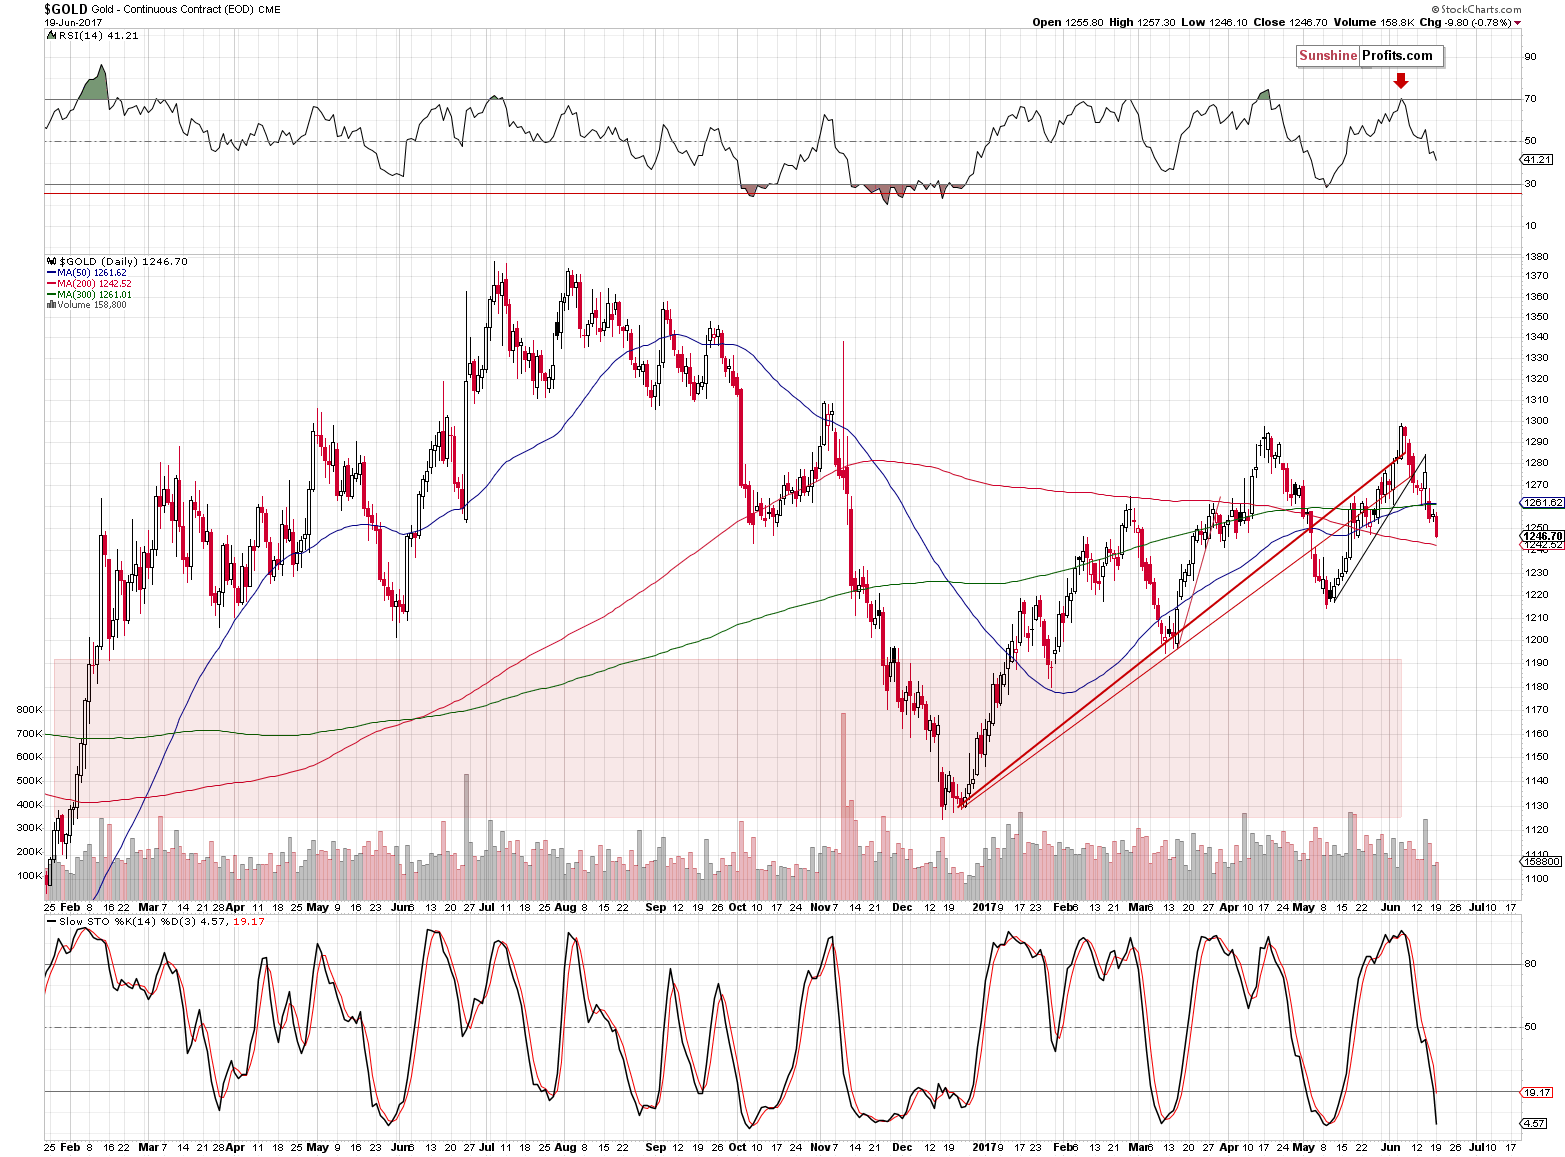
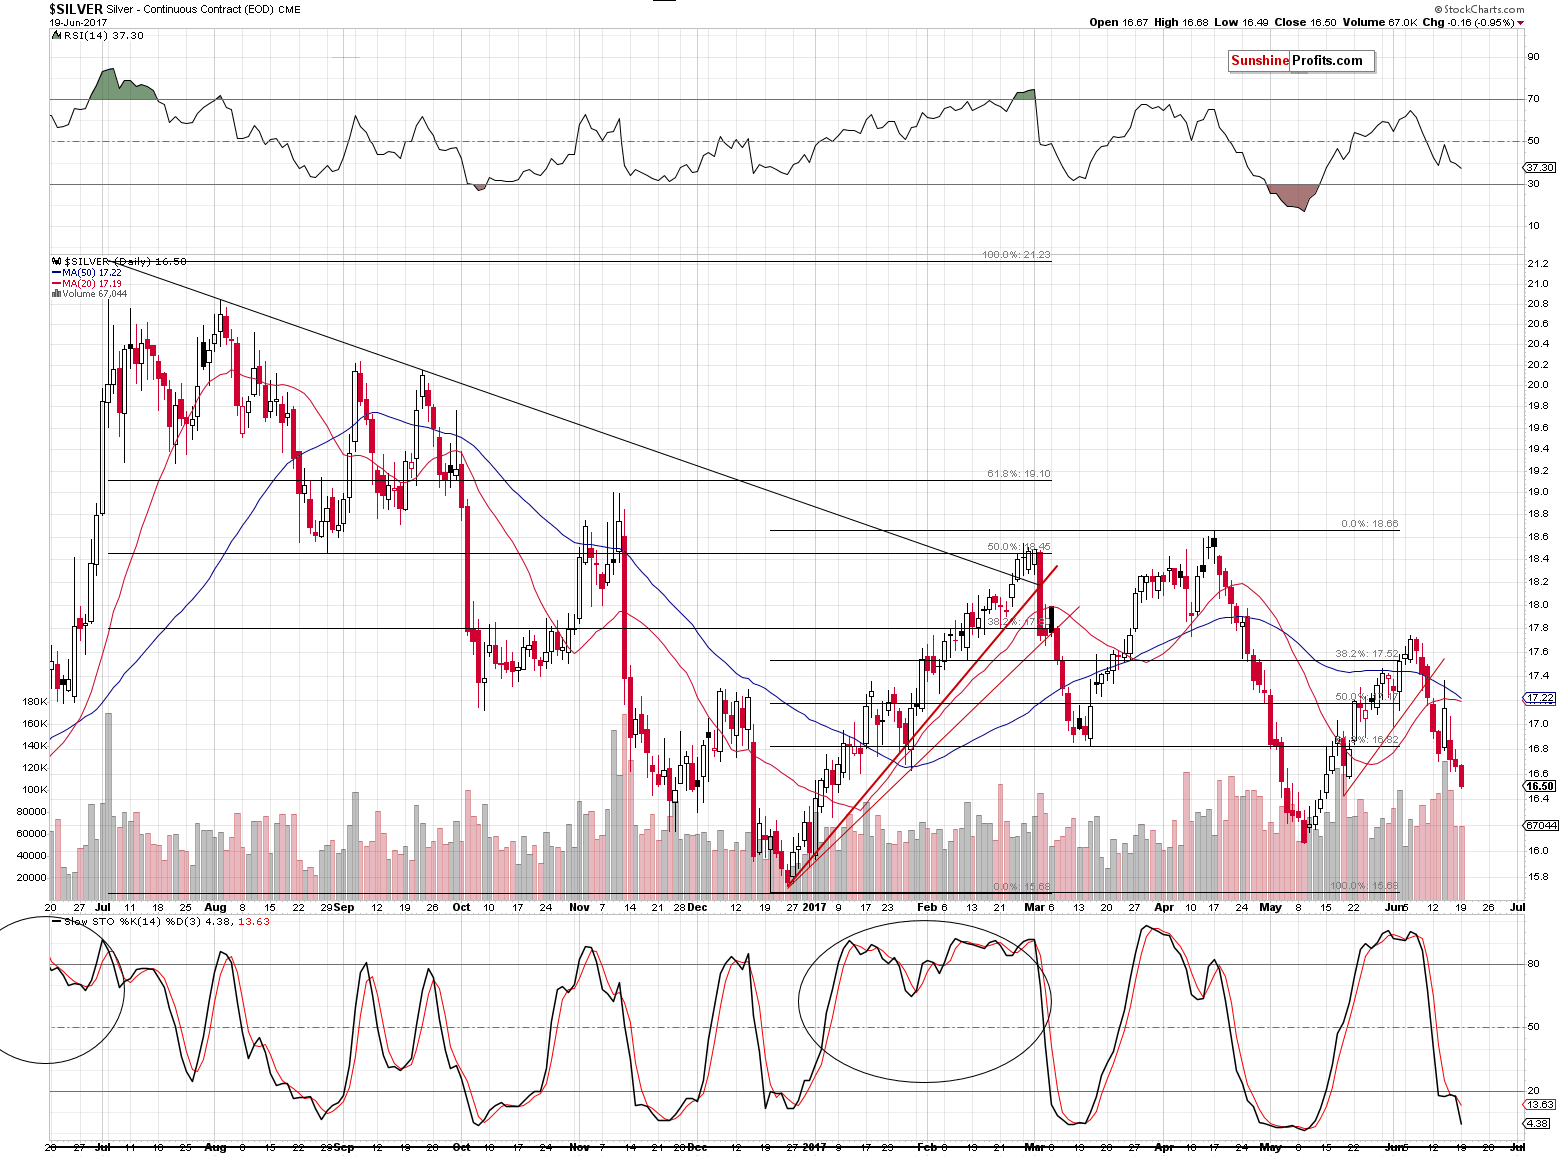
Gold and silver both declined quite visibly, so the pause in mining stocks is no longer neutral by itself – it might appear bullish as the miners’ lack of decline despite gold and silver’s declines means that the former outperformed.
Likely Reason Behind Miners’ Strength
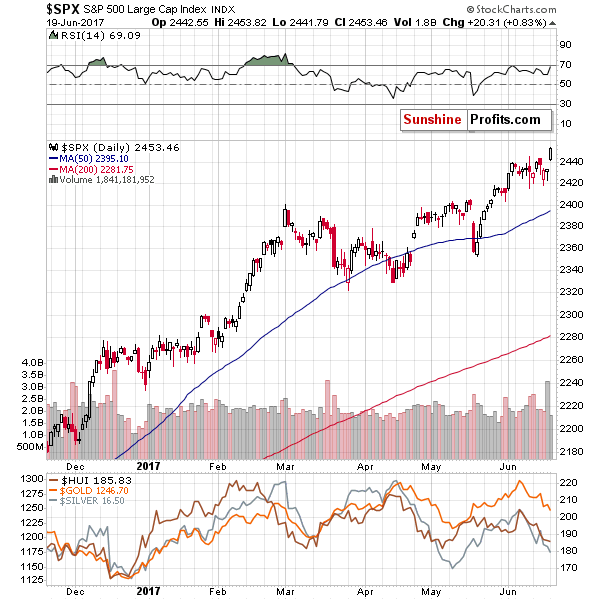
The action in the S&P 500 Index, however, makes the action in mining stocks neutral once again. The broad market moved sharply higher to new highs, which is both: important and very visible. Consequently, it’s no wonder that this tide lifted also the boat with mining stocks and the miners’ “strength” is therefore not a true sign of strength. This, in turn, means that there are generally no bullish implications of the mining stocks’ lack of decline, despite it might look so at first sight.
Summing up, the lack of decline in mining stocks doesn’t seem to have any bullish implications as miners had a very good reason for it in the form or a rallying stock market – the lack of decline in the former is therefore not a sign of strength and not a bullish development. Naturally, the above could change in the coming days and we’ll keep our subscribers informed, but that’s what appears likely based on the data that we have right now. If you enjoyed reading our analysis, we encourage you to subscribe to our daily Gold & Silver Trading Alerts.
Thank you.
Sincerely,
Przemyslaw Radomski, CFA
Founder, Editor-in-chief, Gold & Silver Fund Manager

 The U.S. PetroDollar system is in serious trouble as the Middle East’s largest oil producer continues to suffer as the low oil price devastates its financial bottom line. Saudi Arabia, the key player in the PetroDollar system, continues to liquidate its foreign exchange reserves as the current price of oil is not covering the cost to produce oil as well as finance its national budget.
The PetroDollar system was started in the early 1970’s, after Nixon dropped the Gold-Dollar peg, by exchanging Saudi Oil for U.S. Dollars. The agreement was for the Saudi’s only to take U.S. Dollars for their oil and reinvest the surpluses in U.S. Treasuries. Thus, this allowed the U.S. Empire to continue for another 46 years, as it ran up its ENERGY CREDIT CARD.
And run up its Energy Credit Card it most certainly did. According to the most recent statistics, the total cumulative U.S. Trade Deficit since 1971, is approximately $10.5 trillion. Now, considering the amount of U.S. net oil imports since 1971, I calculated that a little less than half of that $10.5 trillion cumulative trade deficit was for oil. So, that is one heck of a large ENERGY CREDIT CARD BALANCE.
Regardless… the PetroDollar system works when an oil exporting country has a “SURPLUS” to reinvest into U.S. Treasuries. And this is exactly what Saudi Arabia has done up until 2014, when it was forced to liquidate its foreign exchange reserves (mostly U.S. Treasuries) when the price of oil fell below $100:

So, as the price of oil continued to decline from the mid 2014 to the latter part of 2016, Saudi Arabia sold off 27% of its foreign exchange reserves. However, as the oil price recovered at the end of 2016 and into 2017, this wasn’t enough to curtail the continued selling of Saudi’s foreign exchange reserves. The Kingdom liquidated another $36 billion of its foreign exchange reserves in 2017:

According to the Zerohedge article, Economists Puzzled By Unexpected Plunge In Saudi Foreign Exchange Reserves:
The stabilization of oil prices in the $50-60/bbl range was meant to have one particular, material impact on Saudi finances: it was expected to stem the accelerating bleeding of Saudi Arabian reserves. However, according to the latest data from Saudi Arabia’s central bank, aka the Saudi Arabian Monetary Authority, that has not happened and net foreign assets inexplicably tumbled below $500 billion in April for the first time since 2011 even after accounting for the $9 billion raised from the Kingdom’s first international sale of Islamic bonds.
….. Whatever the reason, one thing is becoming clear: if Saudi Arabia is unable to stem the reserve bleeding with oil in the critical $50-60 zone, any further declines in oil would have dire consequences on Saudi government finances. In fact, according to a presentation by Sushant Gupta of Wood Mackenzie, despite the extension of the OPEC oil production cut, the market will be unable to absorb growth in shale production and returning volumes from OPEC producers after cuts until the second half of 2018. Specifically, the oil consultancy warns that due to seasonal weakness in Q1 for global oil demand, the market will soften just as cuts are set to expire in March 2018.
The Saudi’s have two serious problems:
- As the Saudi’s cut their oil production due to the OPEC agreement, the U.S. shale energy companies ramp up production because they are able to produce oil by shifting any losses to Brain-Dead investors looking for a higher yield. This destroys the ability for OPEC to drain global oil inventories, so the oil price continues to trend lower. Which means the Saudi’s may have to liquidate even more foreign exchange reserves in the future on lower oil prices. Rinse and Repeat.
- The Saudis are planning a 5% IPO – Initial Public Offering in 2018 of their estimated $2 trillion of their oil reserves and are hoping to get $200 billion. However, energy analysts Wood Mackenzie estimates that the value of the reserves are more like $400 billion, not $2 trillion. This is due to all the costs, royalties and 85% income tax to support the Saudi Government and the 15,000 members of the Royal Saudi Family. Thus, Wood Mackenzie doesn’t believe there will be much in the way of dividends left over.
That being said, I highly doubt the Saudi’s have the 266 billion barrels of oil reserves stated in the new 2016 BP Statistical Review. The Saudi’s produce about 4.5 billion barrels of total oil liquids per year. Thus, their reserves should last them nearly 60 years.
Now… why on earth would Saudi Arabia sell a percentage of its oil reserves if it has 60 more years of oil production in the future???? Something just doesn’t pass the smell test. Is it worried about lower oil prices, or maybe it may not have all the reserves that it states?
Either way… it is quite interesting that Saudi Arabia continued to liquidate its foreign exchange reserves in April even though the price of oil was above $53 for the majority of the month. I believe the Kingdom of Saud is in BIG TROUBLE. That is why they are trying to sell an IPO to raise much needed funds.
As Saudi Arabia continues to liquidate more of its foreign exchange reserves, it means serious trouble for the PetroDollar system. Again… without “SURPLUS” funds, the Saudi’s can’t purchase U.S. Treasuries. Actually, for the past three years, Saudi Arabia has been selling a lot of its U.S. Treasuries (foreign exchange reserves) to supplement the shortfall in oil revenues.
If the oil price continues to trend lower, and I believe it will, Saudi Arabia and the PetroDollar system will be in more trouble. The collapse of the PetroDollar system would mean the end of the U.S. Dollar supremacy and with it, the end of gold market intervention.
Check back for new articles and updates at the SRSrocco Report.

 The latest selloff in oil prices have left speculators in a predicament: The fundamentals continue to look poor with unimpressive drawdowns in crude oil stocks, but there is a general consensus that the extension of the OPEC deal should push the market towards a rebalancing over the next few quarters.
What that means for short-term movements in prices is unclear. The unpredictability of today’s oil market is leaving some investors burned by unexpected price gyrations. For example, just ahead of the recent selloff in prices last week, oil traders bought up bets on rising prices. Hedge funds and other money managers increased their bullish bets by 7.3 percent for the week ending on June 6, but prices plunged by 5 percent a day later.
Traders looking for some direction might want to consider the futures market, where a contango structure has reemerged. A contango, in which near-term oil futures trade at a discount to futures dated further out, is a symptom of oversupply. For example, two weeks ago, futures for December 2017 traded at a $1 per barrel discount compared to contracts for delivery in December 2018. That discount ballooned to $1.49 per barrel last week, according to Bloomberg, a sign that investors are growing more pessimistic about oversupply conditions this year. “Brent spreads are getting clobbered,” Amrita Sen, chief oil market analyst at consultants Energy Aspects Ltd., told Bloomberg. “The Atlantic Basin is awash in light crudes from Nigeria and Libya.”
The December 2017-December 2018 spread is now deeper into contango territory than at any point since the original OPEC deal back in late 2016. In recent months the spread was positive – that is, the December 2017 contract traded at a premium compared to contracts a year later, a situation known as backwardation.
Several investment banks have insisted that OPEC’s best hope at draining inventories was to do just that: Induce a state of backwardation into the market. By driving up near-term prices while pushing down the back end of the futures curve, the argument goes, OPEC could scare off shale drilling. Producers would be deprived of finance by skittish lenders, and they would be reluctant to drill if they expected prices to be lower in the future. OPEC could achieve this state of backwardation by maintaining cuts this year while also signaling production growth in the future.
If that is the strategy, so far it has not succeeded. The reemergence of the contango reflects concerns about the glut persisting through this year.
Meanwhile, investors are growing wary of an energy market that continues to spurn them. Energy companies have been among the worst performing stocks in 2017. The poor results are leading to an exodus of capital from energy-linked exchange-traded funds (ETFs). Over the past three months, more than $300 million have been pulled out of energy ETFs, according to Bloomberg, which will likely result in the first quarterly outflow of capital from energy ETFs in more than two years. “People are re-allocating money to sectors that are performing better, technology or health-care, versus sitting on a sector like energy that’s down 10 plus percent,” Jeff Carbone, managing partner of Cornerstone Financial Partners, told Bloomberg. “We’re bottoming, but what pushes it higher? That’s the hard part.”
The flip side is that some think that the selloff in energy is overdone. That is exactly why hedge funds and other money managers bought up a greater net-long position in early June, even though some might feel they got in at the wrong time. Nevertheless, the cratering of oil prices last week has opened up a buying opportunity. “When you start to approach $45 a barrel in WTI, you’re in an area where you do find some price support and I think there has been some evidence last week of investment flows coming back into crude oil,” Petromatrix strategist Olivier Jakob said in a Reutersinterview. Jakob cautioned that the room on the upside could still be limited. “You have to be careful not to be too optimistic for now,” he said. “Physical differentials are still under pressure and the time structure is still under pressure in Brent. It’s a bit premature to call for much higher oil prices.”
So what happens next depends on who you ask. Market fundamentals look weak but some traders see attractive entry points.
Also from OilPrice.com: North American Pipeline Capacity Crisis Looms Large
There is something happening in the commodities complex that has been going on for awhile now that needs to be addressed tonight. A subtle change actually started earlier this year and has been gaining momentum especially in the energy sector. I know for a lot of you, with the weak US dollar, you are thinking, “how could commodities be declining,” which goes against everything you have learned about how the markets are supposed to work. If the markets always behaved like everyone thinks they should then there would be no markets, because everyone can’t be right. That’s the nature of the beast we’re trying to tame.
Tonight I would like to show you some bearish rising wedges which have formed all over the place in the commodities complex. Many of the rising wedges took over a year to build out so that sets up a healthy decline. The bigger the pattern the bigger the move.
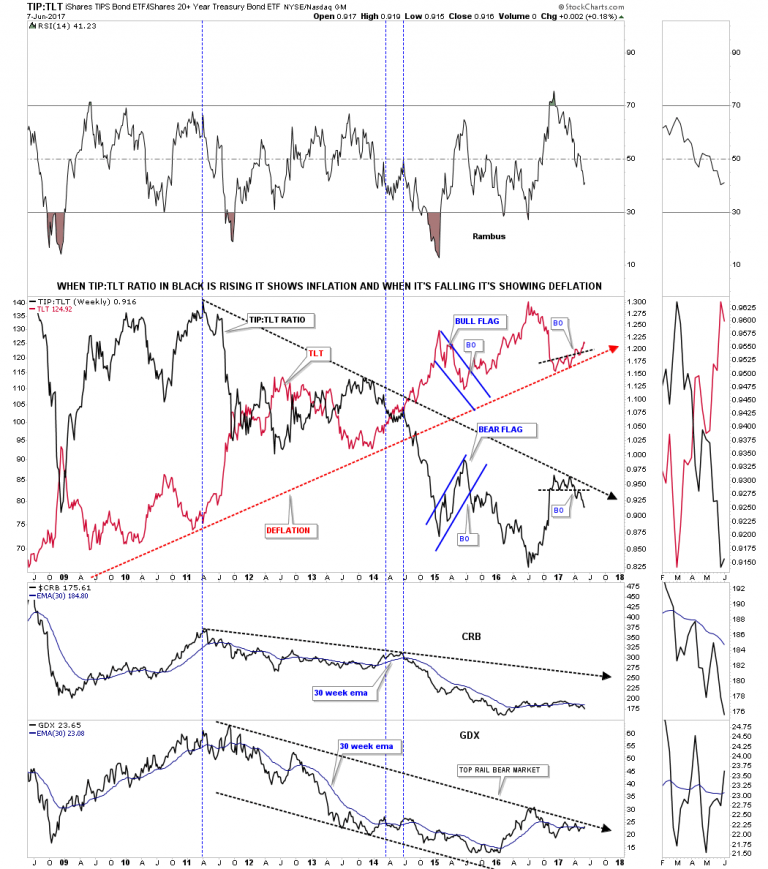
This first chart tonight is the ratio combo chart using the TIP:TLT to gauge if we are experiencing inflation or deflation. Earlier this year the ratio in black formed a small topping pattern just below the black dashed trendline, then had a quick backtest, and is now starting to gain momentum to the downside. When the ratio in black is falling it shows deflation. The CRB index along with the GDX are still in a downtrend with the CRB index being weaker than the GDX, as show by the 30 week ema.

Surprising no one, President Donald Trump announced his decision to withdraw the U.S. from the Paris climate agreement last week, highlighting the depth of his commitment to keep “America First.” Also surprising no one, the media is making much of the fact that the U.S. now joins only Nicaragua and Syria in refusing to participate in the accord.
Trump was under intense pressure from business leaders, politicians on both sides of the aisle, environmental activists, members of his Cabinet—even his own daughter Ivanka, reportedly—to stay in the agreement, but he made his decision with the American worker in mind. The Paris accord, Trump said, “is simply the latest example of Washington entering into an agreement that disadvantages the United States,” leaving American workers and taxpayers “to absorb the cost in terms of lost jobs, lower wages, shuttered factories and vastly demised economic production.”
This is the assessment of Secretary of Commerce Wilbur Ross, who went on Fox News to defend the decision. “Any time that people are taking money out of your pocket and you make them put it back in, they’re not going to be happy,” Ross said, making a similar argument to the one that prompted the Brexit referendum last year.
Just as many Brits were tired of following rules passed down from unelected officials in Brussels, many Americans have feared the encroachment of global environmentalists’ socialist agenda, which they believe threatens to usurp their freedom.
A thought-provoking article from FiveThirtyEight outlines how climate science became a partisan issue over the last 30 years in the U.S. It was the fall of the Soviet Union in the early 1990s, the article argues, that brought on a significant partisan shift in attitude, with conservative thinkers beginning to see the regulations that went along with environmentalism as the new scourge.
No, the Sky Isn’t Falling
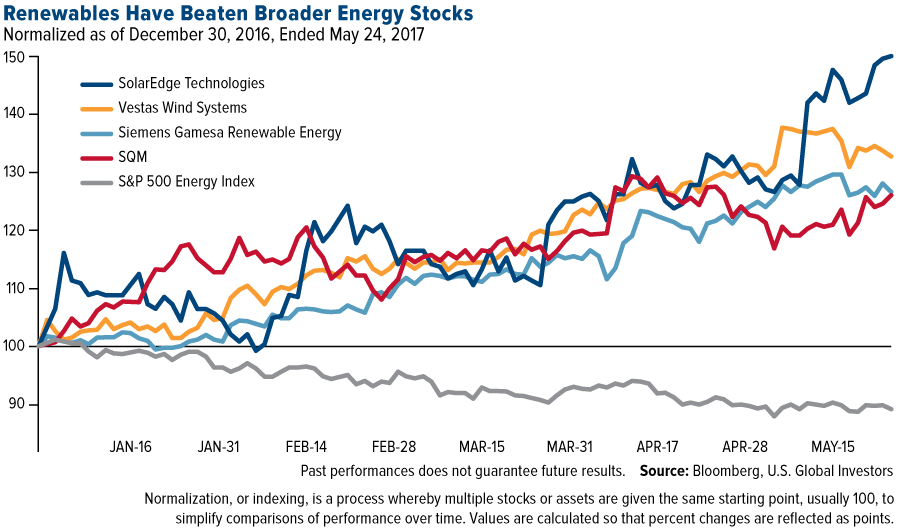
Despite the withdrawal, I believe that the U.S. will not stop innovating and being a world leader in renewable energy—even while oil and natural gas production continues to surge. As the president himself said, we will still “be the cleanest and most environmentally friendly country on Earth.”
Recently I shared with you that we’re seeing record renewable capacity growth here in the U.S., with solar ranking as the number one source of net new electric generating capacity in 2016. In the first quarter of 2017, wind capacity grew at an impressive 385 percent over the same period last year. The “clean electricity” sector now employs more people in the U.S. than fossil fuel electricity generation, according to the 2017 Energy and Employment Report.
This was all accomplished not because of an international agreement but because independent communities, markets and corporations demanded it. Solar and wind turbine manufacturers will likely continue to perform well in the long term as renewable energy costs decline and battery technology improves.
Clearly people’s attitudes toward climate change—and its impact on business operations—are changing. This week, Exxon Mobil shareholders voted to require the company to disclose more information about how climate change and environmental regulations might affect its global oil operations. The energy giant—along with its former CEO, Secretary of State Rex Tillerson—favored staying in the climate deal.
At the same time, markets reacted positively to the exit, with the S&P 500 Index, Dow Jones Industrial Average and NASDAQ Composite Index all closing at record highs on Thursday following Trump’s announcement.

So What Does This Mean?
The question now is what investment implications, if any, the withdrawal might trigger.
The short answer is no one knows exactly what happens now. There’s already speculation that some countries might act to raise “carbon tariffs” on U.S. exports, increasing the cost of American-made goods “to offset the fact that U.S. manufacturers could make products more cheaply because they would not have to abide by Paris climate goals,” according to Politico. German chancellor candidate Martin Schulz has said that, should he be elected in September, he would refuse to “engage with the U.S. in transatlantic trade talks.” Schulz’s comments are not that far removed from those of his political rival, incumbent Angela Merkel, who called Trump’s decision “extremely regrettable.”
This has the potential to widen the rift that’s been forming between the U.S. and Germany since Trump took office. Recall that Trump refused to shake Merkel’s hand during her Washington visit in March. More recently, the president reportedly called the Germans “bad, very bad,” adding that he would stop them from selling millions of cars in the U.S.
One of the biggest winners of the withdrawal could be China. Just as the Asian giant is poised to benefit from the U.S. distancing itself from multilateral free-trade agreements such as NAFTA and the Trans-Pacific Partnership (TPP), it’s also in a position to brand itself as the world’s leader in renewable energy. Last week, Chinese Premiere Li Keqiang met with European Union (EU) officials in Brussels to discuss trade between the two world superpowers, but they also took the time to condemn the U.S. president’s actions, with European Council president Donald Tusk saying that the Paris agreement’s mission would continue, “with or without the U.S.”
 |
China might be the largest carbon emitter right now—it overtook the U.S. a decade ago—but it’s also the biggest investor in renewable energy generation, with $361 billion being spent between now and 2020. The country just fired up the world’s largest floating solar power plant in what used to be a coal mine, now flooded. The plant will provide as much as 40 megawatts (MW) of power to Huainan, China, home to more than 2.3 million people.
European Manufacturers Have Strongest Jobs Growth in 20 Years
On the same day President Trump shared his decision, new purchasing manager’s index (PMI) data was released, and just like last month, European manufacturers were the big surprise. The EU manufacturing sector strengthened its expansion for the ninth straight month in May, reaching a 73-month high of 57, right in line with expectations. Jobs growth grew to an incredible 20-year high.
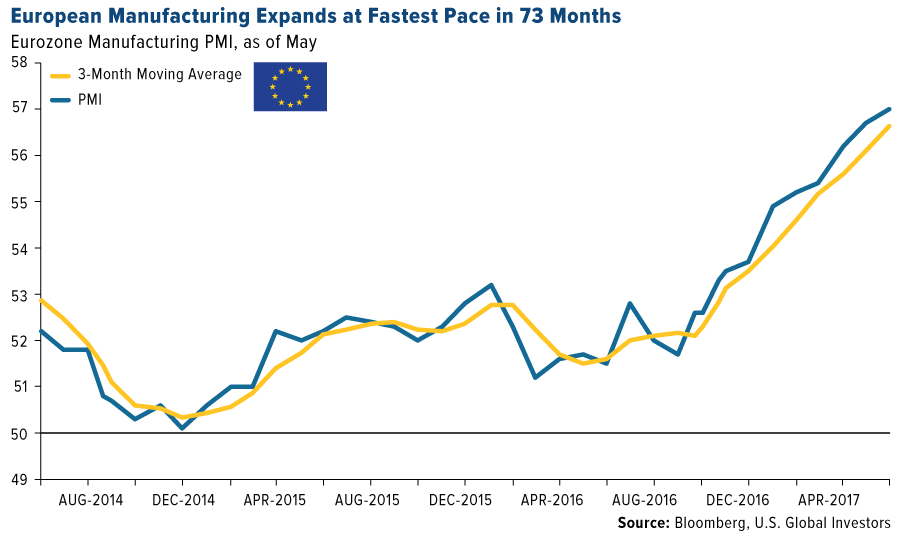
Germany led the group with a PMI of 59.5. Of the eight EU countries that are monitored, only Greece fell short of expansion.
The U.S., meanwhile, slipped from 52.8 in April to 52.7 in May, posting the weakest improvement in business conditions in eight months, before the election. China fared even worse, falling from 50.3 to 49.6, signaling a slight deterioration in its manufacturing sector for the first time in almost a year.
Some links above may be directed to third-party websites. U.S. Global Investors does not endorse all information supplied by these websites and is not responsible for their content. All opinions expressed and data provided are subject to change without notice. Some of these opinions may not be appropriate to every invest.
Holdings may change daily. Holdings are reported as of the most recent quarter-end. The following securities mentioned in the article were held by one or more accounts managed by U.S. Global Investors as of 03/31/2017: Exxon Mobil Corp., SolarEdge Technologies Inc., Vestas Wind Systems A/S, Gamesa Corp. Tecnologica SA, Sociedad Quimica y Minera de Chile.
The Dow Jones Industrial Average is a price-weighted average of 30 blue chip stocks that are generally leaders in their industry. The S&P 500 Stock Index is a widely recognized capitalization-weighted index of 500 common stock prices in U.S. companies. The Nasdaq Composite Index is a capitalization-weighted index of all Nasdaq National Market and SmallCap stocks. The S&P 500 Energy Index is a capitalization-weighted index that tracks the companies in the energy sector as a subset of the S&P 500.
The Purchasing Manager’s Index is an indicator of the economic health of the manufacturing sector. The PMI index is based on five major indicators: new orders, inventory levels, production, supplier deliveries and the employment environment.

-
I know Mike is a very solid investor and respect his opinions very much. So if he says pay attention to this or that - I will.
~ Dale G.
-
I've started managing my own investments so view Michael's site as a one-stop shop from which to get information and perspectives.
~ Dave E.
-
Michael offers easy reading, honest, common sense information that anyone can use in a practical manner.
~ der_al.
-
A sane voice in a scrambled investment world.
~ Ed R.
Inside Edge Pro Contributors

Greg Weldon

Josef Schachter

Tyler Bollhorn

Ryan Irvine

Paul Beattie

Martin Straith

Patrick Ceresna

Mark Leibovit

James Thorne

Victor Adair