Tonight I would like to update some charts for Natural Gas and oil which appear to be building out a topping formation. If these patterns play out there is a lot of room to the downside we can take advantage of. There has been a lot of backing and filling, but it looks like this may be coming to an end and we may finally get the impulse move down.
$NATGAS has been building out a 1 year H&S topping pattern and just recently completed the high for the right shoulder. This daily chart shows a blue 5 point bearish rising flag that broke below the bottom rail today. A backtest to the underside of the 5 point bearish rising flag would come in around the 3.18 area which would represent a low risk entry point to go short natural gas. The possible neckline is still quite a bit lower which would be another low risk entry point if the neckline gives way.

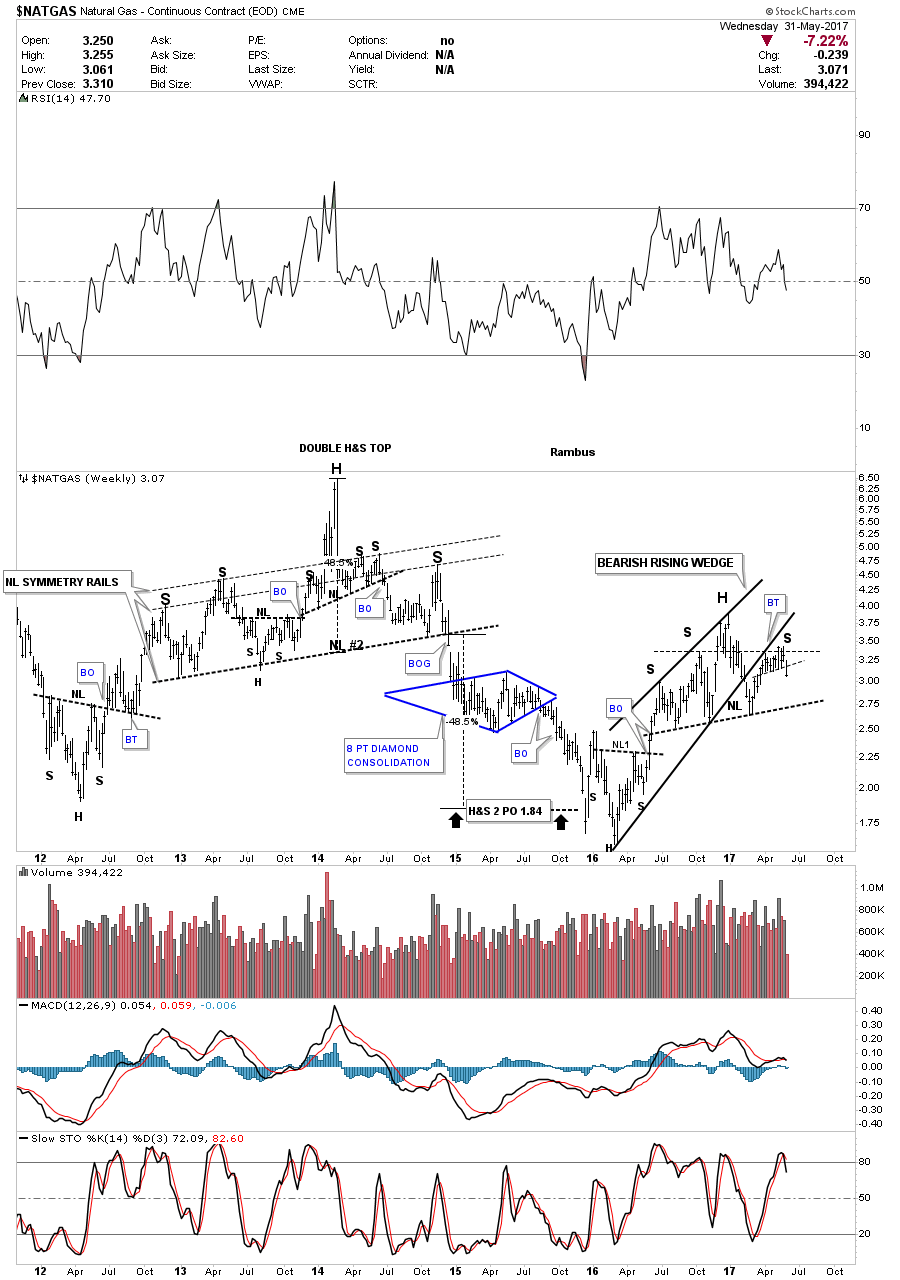
This next chart is a weekly look which shows a classic H&S top forming with the left shoulder and head building out inside the rising wedge, and the right shoulder forming on the backtest to the bottom rail of the rising wedge. Note how long the backtesting process took before it was finally completed. Most folks would have given up and moved on to something else, but sometimes having some patience can be rewarding. Patience would also have been required when the very symmetrical 2 year triple H&S top broke down and began consolidating the first leg down, building out the blue diamond. Each reversal $NATGAS has had since 2012 was accompanied by a H&S reversal pattern. As you can see, if our current H&S top plays out this move down is just getting started.
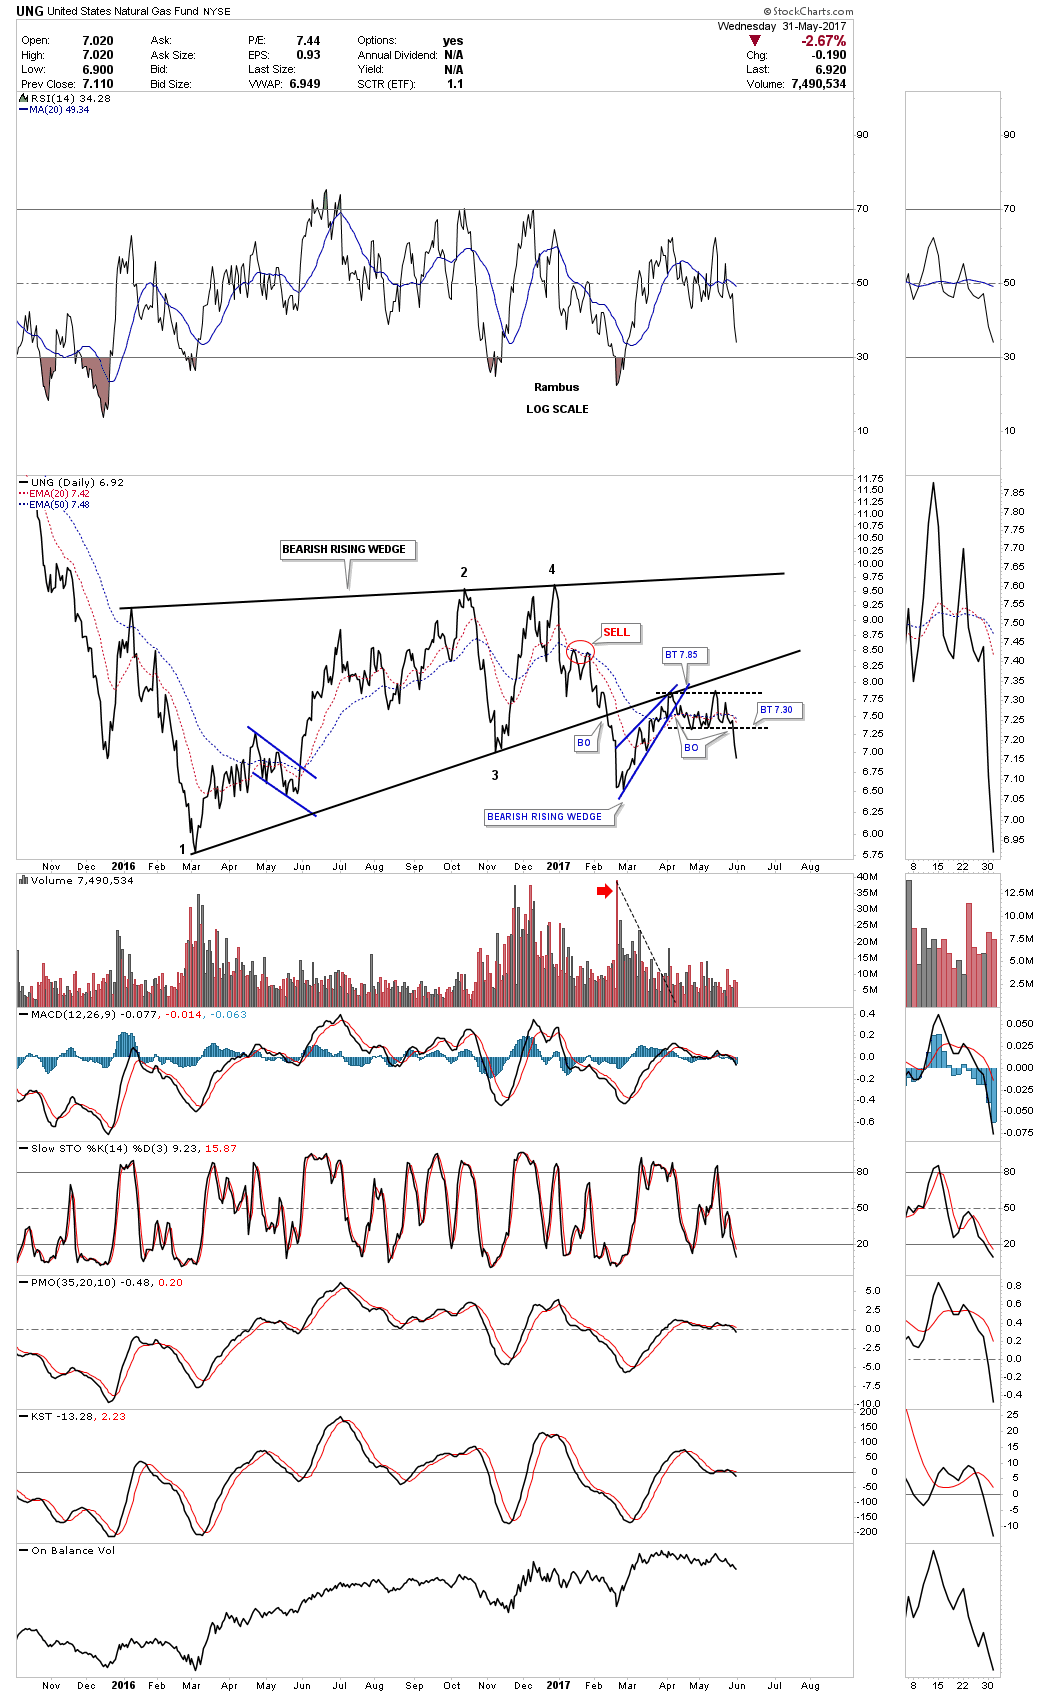
Lets now look at UNG, natural gas fund, that is the best proxy for either going short or long one of the etf’s for natural gas. This 1 1/2 year daily line chart shows the bearish rising wedge with the smaller blue bearish rising wedge which formed the backtest to the bottom rail. Even after the backtest was completed at 7.85 UNG still didn’t want to go down and traded sideways, creating a double top just below the bottom rail of the black rising wedge. Finally this week the price action is starting to fall breaking below the double top trendline at 7.30. The price objective at a minimum would be down to the first reversal point in the one year bearish rising wedge at the 5.75 area.
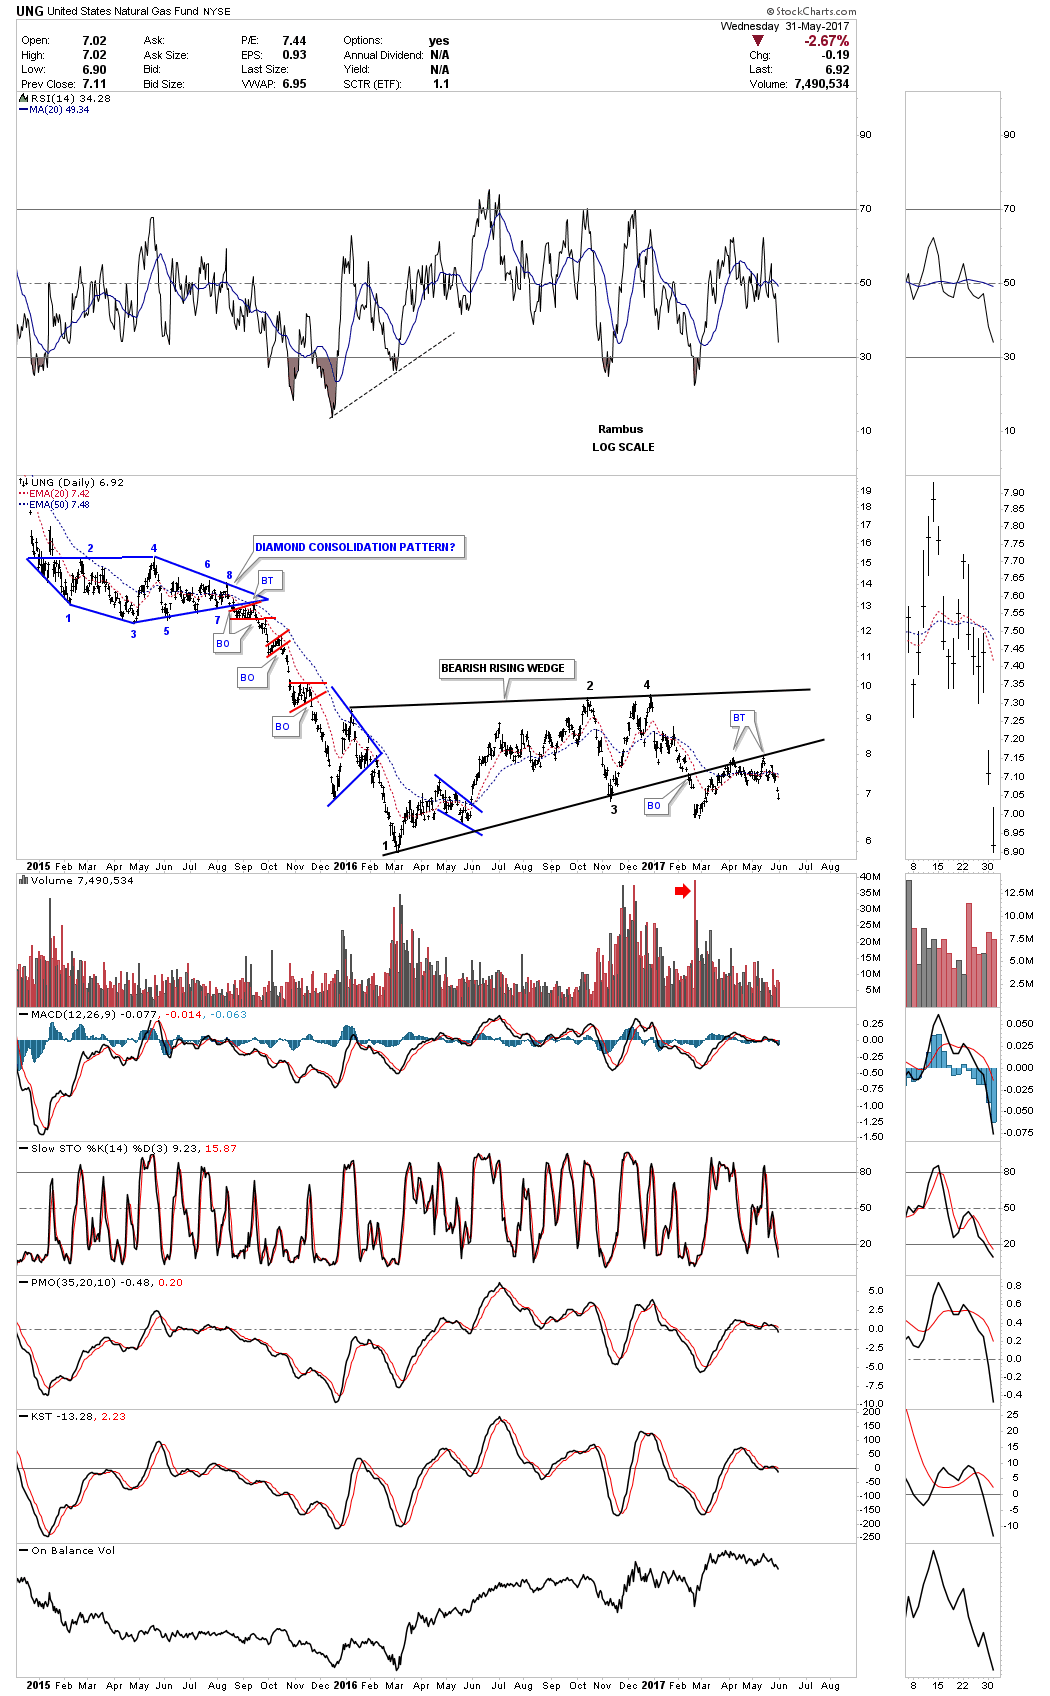
This longer term daily chart picks up the price action once the 8 point diamond consolidation pattern broke down. The smaller red consolidation patterns are what you want to see in a strong impulse move down, one forming just below the previous one. The move was so strong you can see a parabolic decline out of the blue diamond.
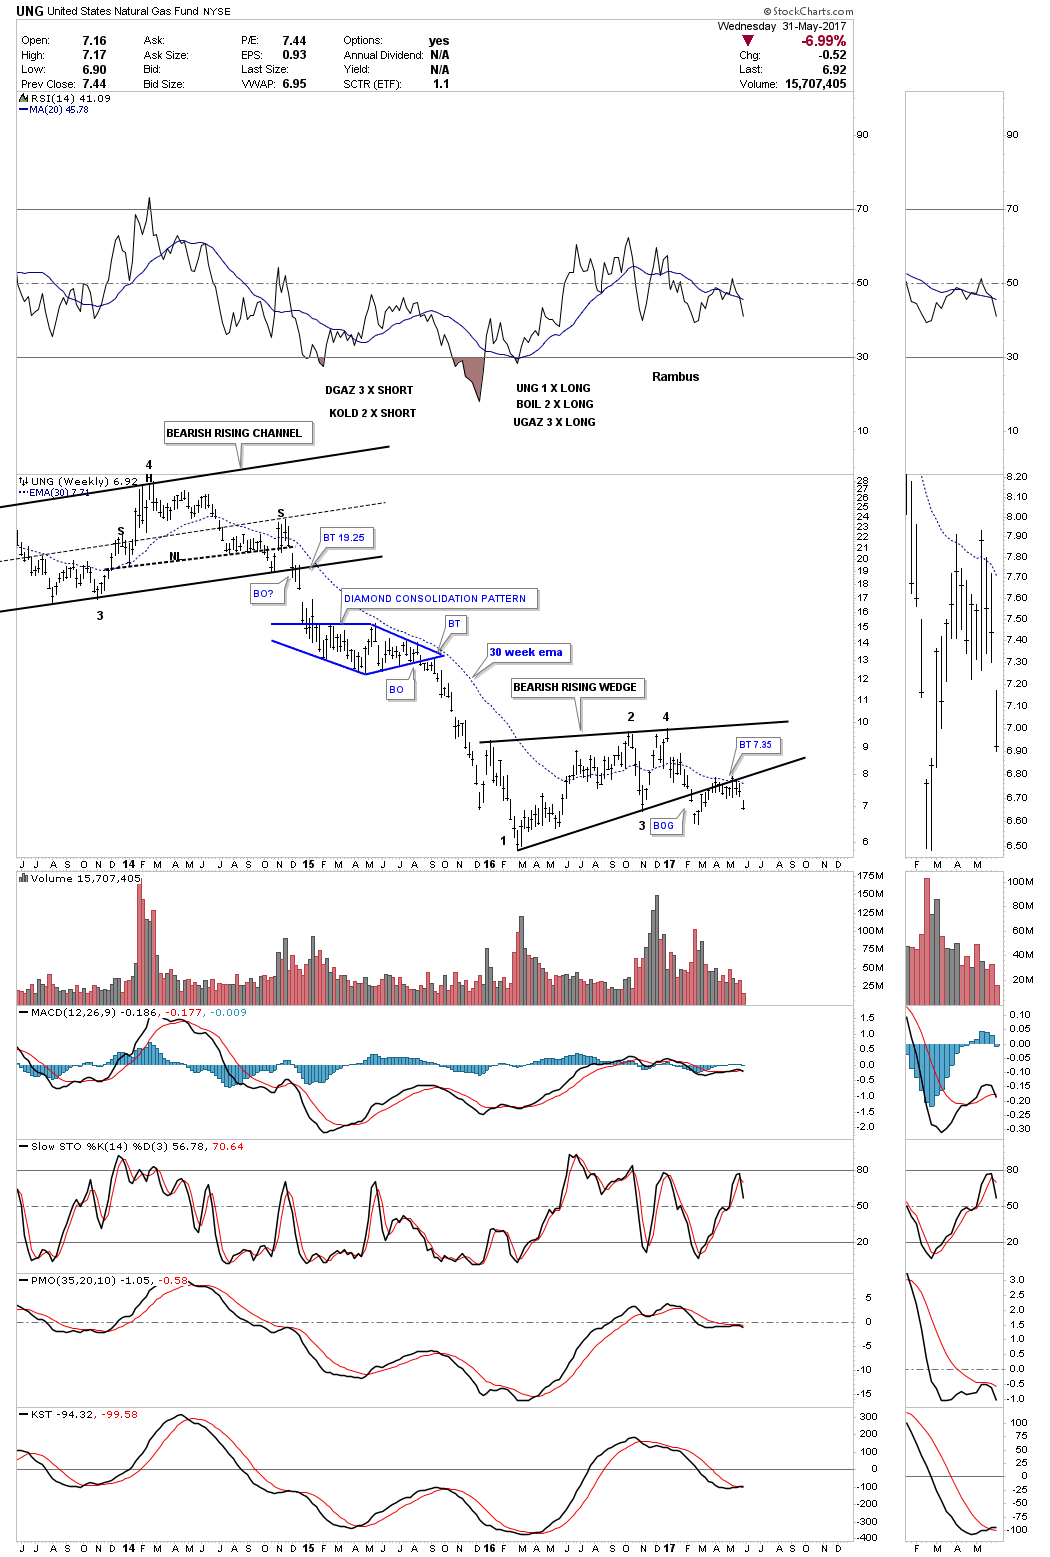
This weekly chart puts the big picture in perspective which shows the end of a very big rising channel with a H&S top that finally finished off the reversal pattern. The blue diamond is basically a halfway pattern that formed in the middle of that massive decline. At the top of the chart I listed 2 short efts, DGAZ which is a 3 X short etf and KOLD is a 2 X short etf for natural gas.
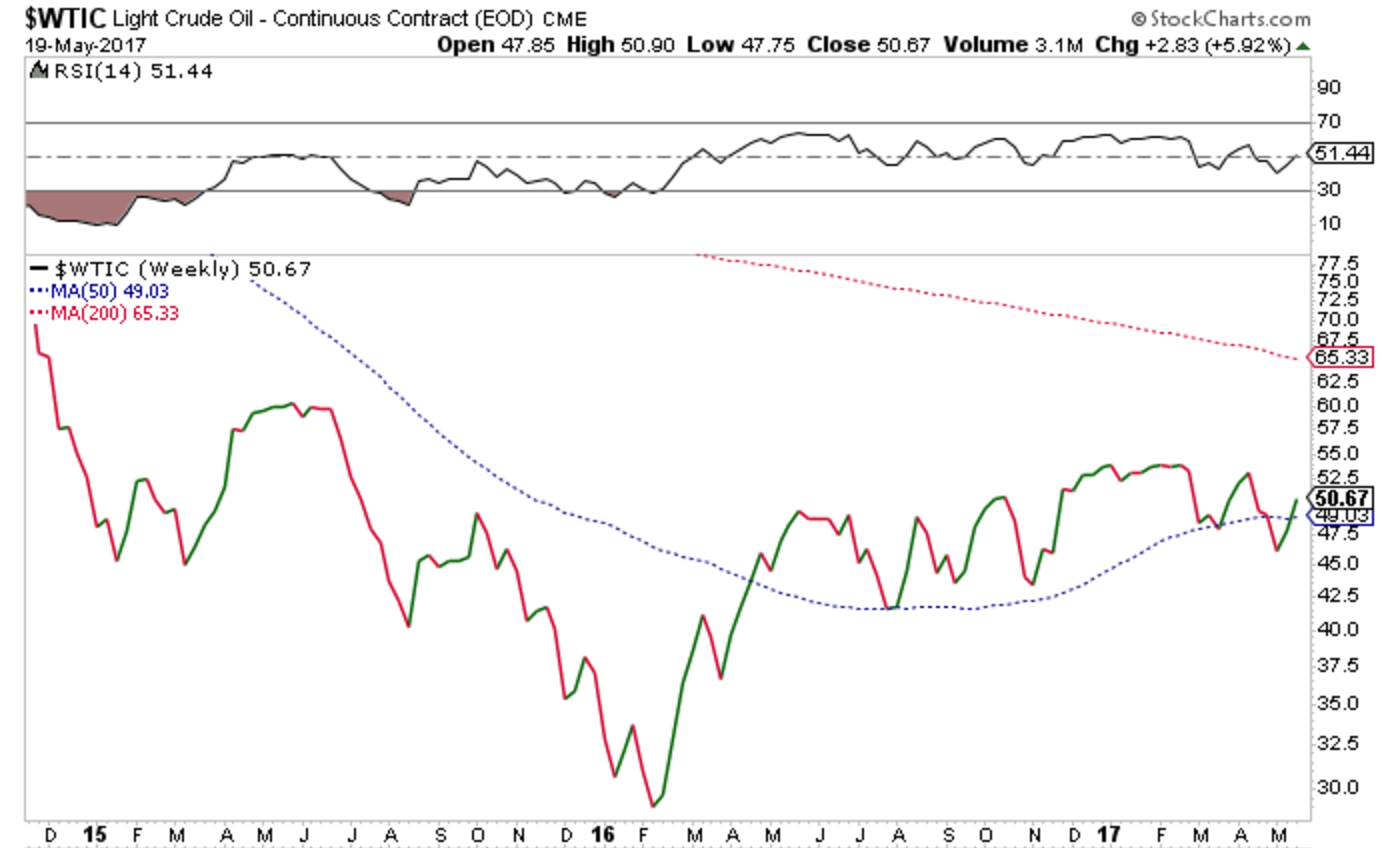
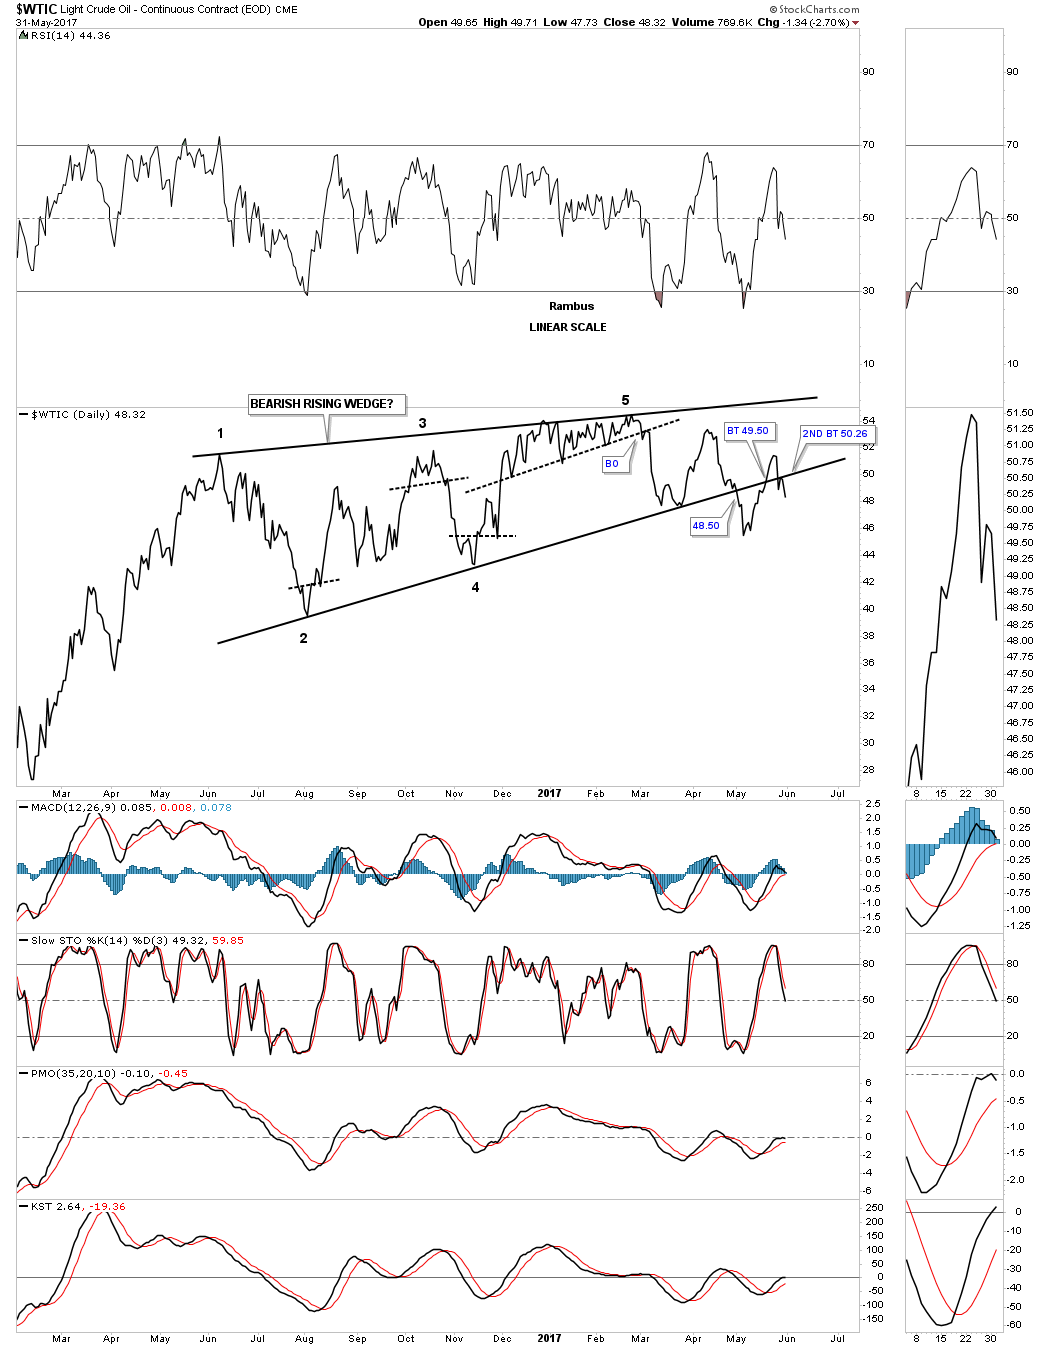
Now lets turn our attention to the $WTIC, oil index, which had a massive decline into the early 2016 low. Initially it looked like oil was going to build out an inverse H&S bottom, but as time went on the price action failed to move much higher than the neckline and began trading sideways. After nearly a year of sideways chopping action it looks like oil has built out a bearish rising wedge. There are several ways we can draw in the rising wedge, with the first one starting at the 2016 low. It’s not the prettiest rising wedge I’ve ever seen, but it does fit the bill as the backtest found resistance right where one would be looking, the underside of the bottom rail. There was a smaller bearish rising wedge which formed in 2015 which had a breakout followed by a backtest.

The 2nd way we can draw in a rising wedge is by starting the first reversal point, not at the bottom, but at the first reaction high. This rising wedge gives us 5 reversal points which we would need as the rising wedge is forming above the previous low. Note how the price action has interacted with the bottom rail of the one year black rising wedge. The initial backtest I was looking for was a little strong at 49.50. After petering out just above the bottom rail oil declined once again and broke below the bottom rail with another bactest to 50.26 which so far is holding.
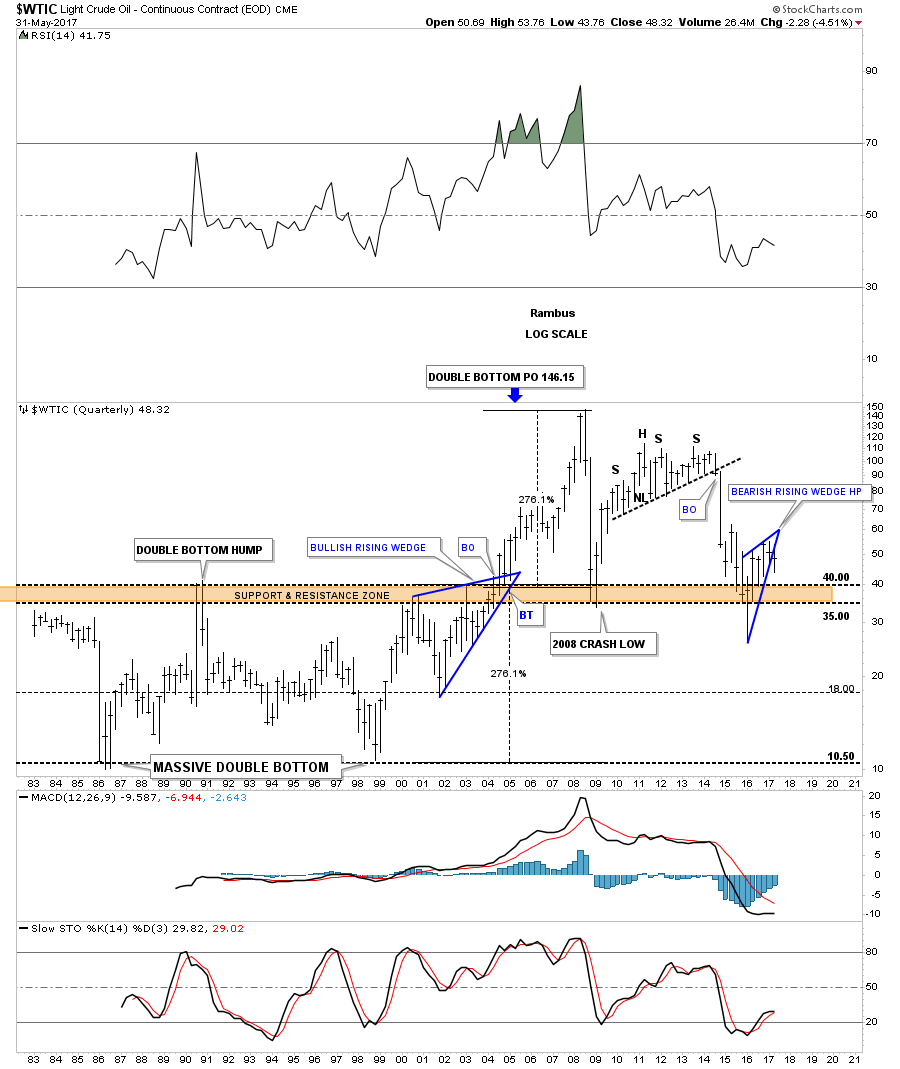
This next chart for oil is a 35 year quarterly chart which shows the entire history going all the way back to 1983. For 20 years oil bounced between support at 10.50 and resistance at 40.00. Starting in 2000 oil built out a massive blue bullish rising wedge that when broken to the upside propelled oil up to its all time high at 147. Once the price action took out the old all time high at 40, I labeled the massive trading range from 10.50 to 40.00 as a double bottom which was 276%. I added that 276% to the breakout point above 40 and got a price objective up to 146.
We may be seeing a similar setup, only this time it will be to the downside if our current blue bearish rising wedge plays out as a halfway pattern. I have many more oil charts I could show you but it’s getting late and I need to get this posted. The bottom line is Natural gas and oil may have finally completed their one year plus trading ranges that may offer us a good opportunity go short. All the best…Rambus