
Energy & Commodities
Future global economic growth is in serious trouble as oil discoveries fell to historic lows last year. The International Energy Agency (IEA) reported that the sharp downturn in capital spending by the conventional oil sector was due to extremely low oil prices.
As the oil price fell to $30 in 2016, oil companies cut their exploration and capital expenditures by 25-40%. For example, ExxonMobil, the largest oil company in the United States, cut their capital expenditures by 26% in 2016, from $26 billion in 2015 to $16 billion last year. This had a profound impact on new oil discoveries.
According to the IEA report:
Oil discoveries declined to 2.4 billion barrels in 2016, compared with an average of 9 billion barrels per year over the past 15 years. Meanwhile, the volume of conventional resources sanctioned for development last year fell to 4.7 billion barrels, 30% lower than the previous year as the number of projects that received a final investment decision dropped to the lowest level since the 1940s.
By taking the IEA’s oil discovery data and comparing it to the total amount of conventional oil consumed by the world in 2016, here is the following chart:
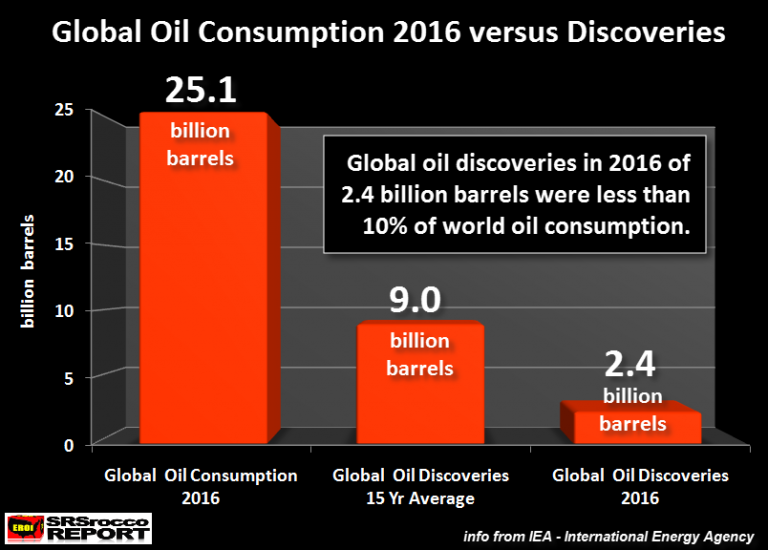
The world consumed 69 million barrels per day of conventional oil last year, which equaled a total of 25 billion barrels (source: IEA report above). Which means, conventional global oil discoveries of 2.4 billion barrels were less than 10% of total world conventional oil consumption. This is extremely bad news.
To understand the breakdown in the different oil types, the IEA provided the following data:
Conventional oil production of 69 mb/d represents by far the largest share of global oil output of 85 mb/d. In addition, 6.5 mb/d come from liquids production from the US shale plays, and the rest is made up of other natural gas liquids and unconventional oil sources such as oil sands and heavy oil.
Global Conventional oil production was 69 million barrels per day (mbd) of the total 85 mbd, which included natural gas plant liquids and other unconventional sources such as shale oil (U.S.), heavy oil and tar sands. Typically, conventional oil is the higher quality, cheaper to produce oil.
Now, what is even more alarming, is that global oil discoveries have been much lower than production for quite some time. The IEA also stated that the amount of world conventional oil discoveries averaged about 9 billion barrels for the past 15 years. If we assume that the world was producing 65 mbd of “conventional oil” for the past 15 years (it was likely higher), the world was only replacing about 38% of its annual oil consumption.
Here are the oil figures:
65 mbd X 365 = 24 billion barrels
9 billion average annual barrels oil discovery / 24 billion barrels consumed = 38%
So, not only did the world only discover 10% of the conventional oil it consumed last year, it has only been replacing a little more than a third of what it has been consuming for in the past 15 years. This is extremely bad news and it is starting to catch up to us.
I will be writing more energy articles showing how the situation is becoming more dire for the U.S. and global oil industries. I am waiting for the top U.S. oil companies to release their detailed SEC quarterly results in a week to provide more information, but they have already released some results.
For example, ExxonMobil cut its capital expenditures another 19% during Q1 2017 versus the same period last year. Falling exploration and capital expenditures will grind to a halt future oil discoveries. Investors need to understand that this will impact global economic growth quite negatively in the future.
Check back for new articles and updates at the SRSrocco Report.

“It’s been very, very bad for our companies and for our workers, and we’re going to make some very big changes or we are going to get rid of NAFTA once and for all,” President Donald Trump said in a speech last week.
Today, White House readies order on withdrawing from NAFTA.
The Trump administration is considering an executive order on withdrawing the U.S. from NAFTA, according to two White House officials.
A draft order has been submitted for the final stages of review and could be unveiled late this week or early next week, the officials said. The effort, which still could change in the coming days as more officials weigh in, would indicate the administration’s intent to withdraw from the sweeping pact by triggering the timeline set forth in the deal.
Peter Navarro, the head of Trump’s National Trade Council, drafted the executive order in close cooperation with White House chief strategist Steve Bannon. The executive order was submitted this week to the staff secretary for the final stages of review, according to one of the White House officials.
The draft executive order could be a hardball negotiating tactic designed to bring Mexico and Canada to the table to renegotiate NAFTA. But once Trump sets the withdrawal process in motion, the prospects for the U.S. pulling out of one of the largest trade deals on the globe become very real.
Some internally see the drafting of the executive order as a win for the “nationalist” faction within the White House led by Bannon, who has been sidelined in recent weeks since he was removed from the National Security Council.
NAFTA Running Out of Time
CNNMoney reports Trump’s NAFTA is Already Running Out of Time
President Trump wants a new trade deal with Mexico and Canada soon. But he’s running out of time.
Trump has said he wants a deal that benefits US workers, but hasn’t said exactly what he wants in a new deal.
If Trump decides to stay in and renegotiate, time isn’t on his side.
His trade team, led by Commerce Secretary Wilbur Ross, must trigger a 90-day consultation period before trade talks can begin. At the earliest, talks could start in August.
Edward Alden, a senior fellow at the Council on Foreign Relations, said “it’s completely unrealistic” to get a deal done this year.
“The notion that you’re going to have a negotiation that’s both fast and productive is just an illusion,” Alden added.
It’s also worth noting that the original NAFTA agreement, which became law in 1994, took years to put together.
Mexican leaders want negotiations done by early 2018 because Mexico has presidential elections in July of next year. There’s no telling whether the next Mexican president will cooperate with Trump on NAFTA.
Very Bad Idea
Killing NAFTA is a terrible idea. I have talked about this before buts here are some pictures of the allegedly “terrible trade deal”
Manufacturing Employment
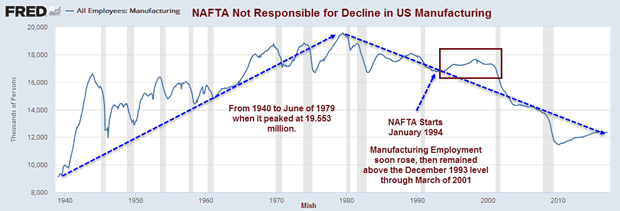
Trump and Navarro moan about NAFTA causing a loss of US manufacturing jobs. If anything, NAFTA stabilized or increased US manufacturing jobs for six or seven years thanks to an increase in bilateral trade.
The demise of US manufacturing jobs started in June of 1979, long before anyone could blame either Mexico or China.
US Balance of Trade in Goods with Mexico

Goods Trade with Mexico

It’s impossible to make a realistic case that NAFTA hurt the US.
Explaining Balance of Trade

The seeds of trade imbalances were sewn in 1971 when Nixon closed the gold window. The trade deficit rose, then skyrocketed.
Total Credit Market Debt Owed

Following Nixon closing the gold window on August 15, 1971, credit soared out of sight to the benefit of the banks, CEOs, the already wealthy, and the politically connected.
Scapegoating
- Trump blames Mexico and China.
- Larry Summers blames “Secular Stagnation”.
- Ben Bernanke blames a “Savings Glut”.
Scapegoating Mexico and China helped get Trump elected. Scapegoating also allows the Fed and central banks to blame anything and everything but lack of a gold standard.
“Our Currency but Your Problem”
The source of global trading imbalances, soaring debt, declining real wages, and the massive rise of the 1% at the expense of the bottom 90% is Nixon closing the gold window.
At that time, Nixon’s treasury secretary John Connally famously told a group of European finance ministers worried about the export of American inflation that the “dollar is our currency, but your problem.”
Balance of trade issues, soaring debt, declining real wages, and the demise of the US middle class are now our problem.
Before doing something stupid, Trump should take a look at this chart.

Ready, Willing, Able
So far, Trump has backed away, reversed positions, or failed in nearly everything he has tried to do or stood for in the election: Russia policy, Syria, getting Mexico to pay for a wall, and labeling China a currency manipulator are key examples.
Perhaps this is another negotiation ploy, but Trump fired a warning shot yesterday that he is ready, willing, and able to do something majorly stupid.
For details, please see Lumber Trade Idiocy: Trump Hits Canada with Proposed 20% Tariff on Lumber
 Oil prices took another dip on Monday, and with WTI down to $49 per barrel, crude oil has given up most of the gains that it had made so far this month, taking prices down to their lowest levels since late March.
Major investors are also losing a bit of confidence in oil’s comeback. Hedge funds and other money managers took a breather in the buildup, buying up long positions in the most recent week for which data is available. Much of the rally in oil prices between the end of March and mid-April occurred as investors closed out short positions and took on bullish bets. Since then, however, hedge funds have slowed their net-long builds, a sign of waning confidence in higher oil prices.
Also, the futures market no longer looks all that encouraging.
…related:
After the Primary Silver Mining Industry enjoyed a brief increase in productivity over the past two years, it fell to the lowest ever in 2016. The reason the primary silver mining industry’saverage yield increased in 2014 was due to the addition of Tahoe Resources high-grade Escobal Silver Mine.
Tahoe’s Escobal Silver Mine’s average yield in 2014 was an astonishing 16.3 ounce per ton (oz/t). Not only did Escobal Mine enjoy one the highest silver yields in the world, it produced over 20 million oz (Moz) in 2014. Thus, the addition of Tahoe to the Top Silver Miners pushed their average yield to 7.8 oz/t in 2014 versus 7.6 oz/t in 2013:
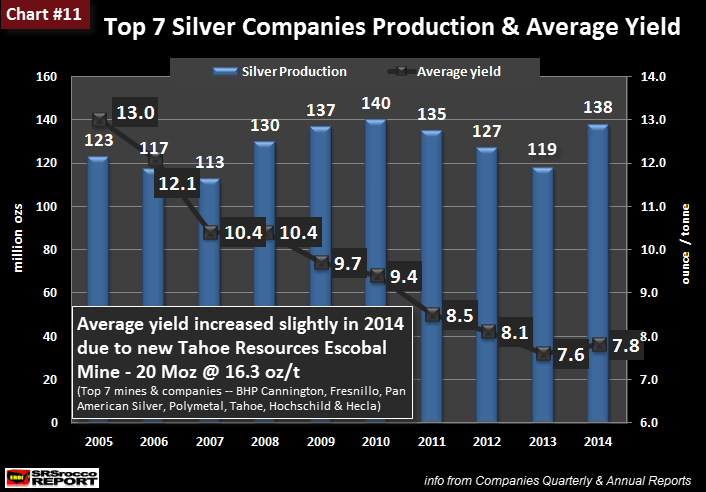
Now, what is very interesting about adding Tahoe’s Escobal super high-grade mine to the group, it didn’t move the average yield up that much…. only 0.2 0z/t to 7.8 oz/t.
I didn’t update this chart for 2015. However, I have now added the data for 2015 and 2016. As we can see in the updated chart below, the group’s silver production has increased over the past two years from 138 Moz in 2014 to 158 Moz last year. The majority of this increase was due to the ramp up of Fresnillo LLC’s Saucito Mine:

Even though the top 7 Primary Silver Mining Companies increased their production to 158 Moz in 2016, the amount of ore they processed also reached a record high. For example, these silver mining companies processed a record 21.3 million tons of ore in 2016 compared to 19.9 million tons in 2015. Furthermore, the top silver miners only processed 9.4 million tons of ore in 2005 to produce 123 Moz of silver… yielding 13 oz/t.
The falling average yield in the silver mining industry seems to be overlooked by the majority of analysts. As we can see in the chart above, the primary silver miner’s average yield has fallen from 13 oz/t in 2005 to 7.4 oz/t in 2016. This is a 43% decline in just 12 years.
Lastly, Tahoe Escobal Mine’s average silver yield will continue to fall over the next ten years. Thus, the global silver mining industry will continue to process more ore to produce the same or less silver in the future. While the cost of energy has declined over the past few years, falling ore grades will continue to put pressure on the silver mining industry going forward.
Check back for new articles and updates at the SRSrocco Report.

The big trade of this year positions oneself for the upcoming US recession. In speculating and investing if one can get the main concept right everything else falls into place. Various trades will branch off from this theme. The trade is not priced into the market at all since we are betting against the accepted narrative. We can use various proxies to play the trade, as just about anything economically sensitive may qualify. Base metal producers, car companies, sub prime financiers, retail establishments, the list goes on. The main vehicle I have chosen to execute the trade is the oil price. I have chosen this because both fundamentals and technicals indicate to me it is over priced and due for a fall. It trades deep and has a record of falling under distressed economic conditions.
“All that we see or seem is but a dream within a dream”- Edger Allan Poe
That’s what we have lived over the past 8 years, an economic mirage. A historic FED fueled reflation rally, that was just a dream. Central banks led by Phd academics applied their unproven pet theories of substituting credit conjured from thin air in place of accumulated savings to stimulate demand. We are now going to see if their theories worked. Von Mises explained in “Human Action” that a credit-fueled boom ends in one of two ways:
“Either the banks continue the credit expansion without restriction and thus cause constantly mounting price increases and an ever growing orgy of speculation, which, as in all other cases of unlimited inflation ends in a “crack-up boom” and in a collapse of the money and credit system. Or the banks stop before this point is reached, voluntarily renounce further credit expansion and thus bring about the crisis.”
That is where we are right now, at the beginning of the credit restriction, the crisis will then follow. Its time to take the trade before its begins to be priced into the market. The oil market is rife with false understandings that should soon be exposed. Chief among them is that OPEC is in control. A belief in an OPEC put reminds me of the belief in the central bank put which existed in 2008. That dream was soon blown away. The false idea that producers will simply shut down production once they reach their all in costs is simply wrong. Sovereigns and independents have bills to pay, the costs of infrastructure can be written off.
Diego Parrilla has written a wonderful book “The energy world is flat”where he describes forces converging on the energy markets which ultimately work towards lower prices. These forces have converged to put crude oil on the defensive. Substitution, regional convergence, lower transportation costs have essentially made Oil into strictly a transportation fuel. Oil once the source of power generation is no more. Oil now competes at a disadvantage with virtually most other energy sources.
Consumers have defended themselves in various ways and geopolitics no longer add much of a premium into price with ample storage capacity and diverse supplies. Peak oil turns out was a very linear static view of the world. It ignored the dynamism of the market. These are forces that will exert a downward pressure on prices for years to come and when a faltering economy runs headlong into the largest spec long position of any commodity in history prices will drop.
Distressed producers and investors.
Reversion to the mean is a statistical certainty. The only question is what duration do we use to determine it? If one is to look at the oil price spanning the entire modern era (post WWII) the mean price, in today’s dollars, would be around $35. So its not hard to imagine a dip below the mean during a mean reversion cycle.

Capturing that move below $35 is what this trade is all about. As I said earlier what makes this the Big Trade is not the percentage move, but in getting the theme right and using that theme in your other investments.
Yesterdays Geniuses Tomorrows Suckers
People always invest the most money at the wrong part of the cycle. I believe this is what happened in the oil patch. The big asset players, the Blackstone’s, Carlyle’s, Blackrock’s and others bought at what they thought was the bottom. They believed they were the distressed buyers in 2015. Perhaps Jesse Livermore would say they are still suckers, but just suckers in a higher class. These private equity players all bought using debt and are highly levered. But I believe the game isn’t played out yet. If prices drop precipitously these guys will be selling at fire sale prices.
Mechanics of the trade.
This is a broad theme, hence the name The Big Trade. One could pick various entities to short. GM, Chrysler, Auto Nation, Carmax and subprime auto lending companies such as ALLY, NAVI, SC and CAR & HTZ would be a good place to start. Also energy companies with a large amount of debt are also prime candidates. But let’s for now focus on oil.
I have taken an initial short position using an option spread on the USO. I have also shorted outright the 3X ETF UWT. One can taylor ones risk reward by adapting different levels of leverage using options. These are trades I hold and am in no way giving specific advice to anyone else in constructing their own trade positions. We are all our own managers here.
When oil starts its downward impulse I will likely buy a direct put on one of the oil ETFs and buy DWT or SCO. But I will try to time the moment to reduce the amount of decay that one carries while holding that instrument.
Back to the Big Picture
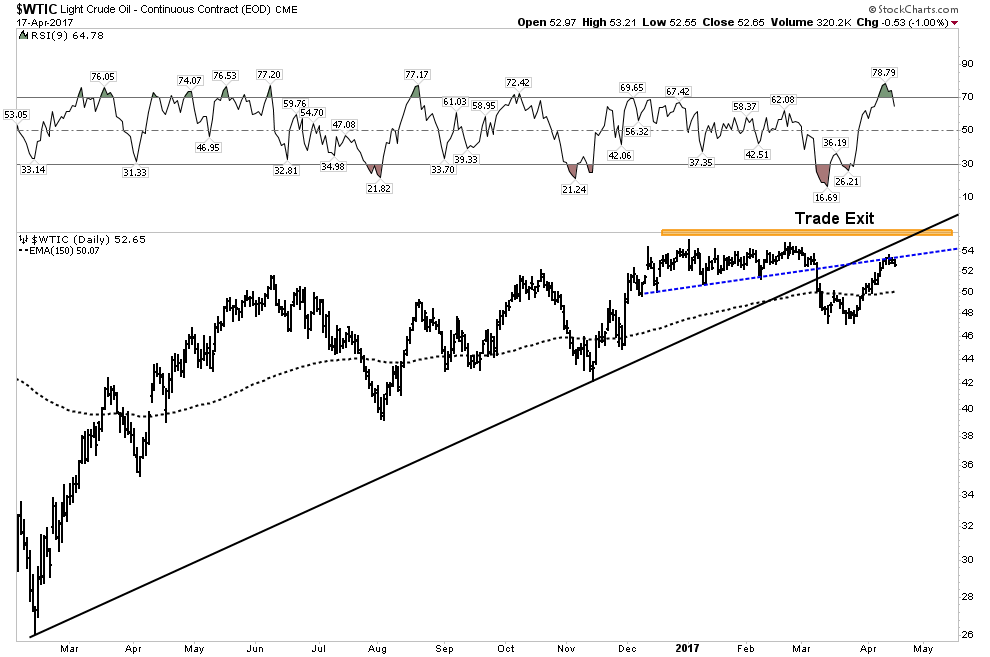
Looking again at the big picture phase chart we see below I believe we are in phase II of the secular bear market which started in 2008. I suspect it wont be over until the end of the next recession. I have no idea how low oil could go, but I presume the 2015 lows will be tested as a minimum.
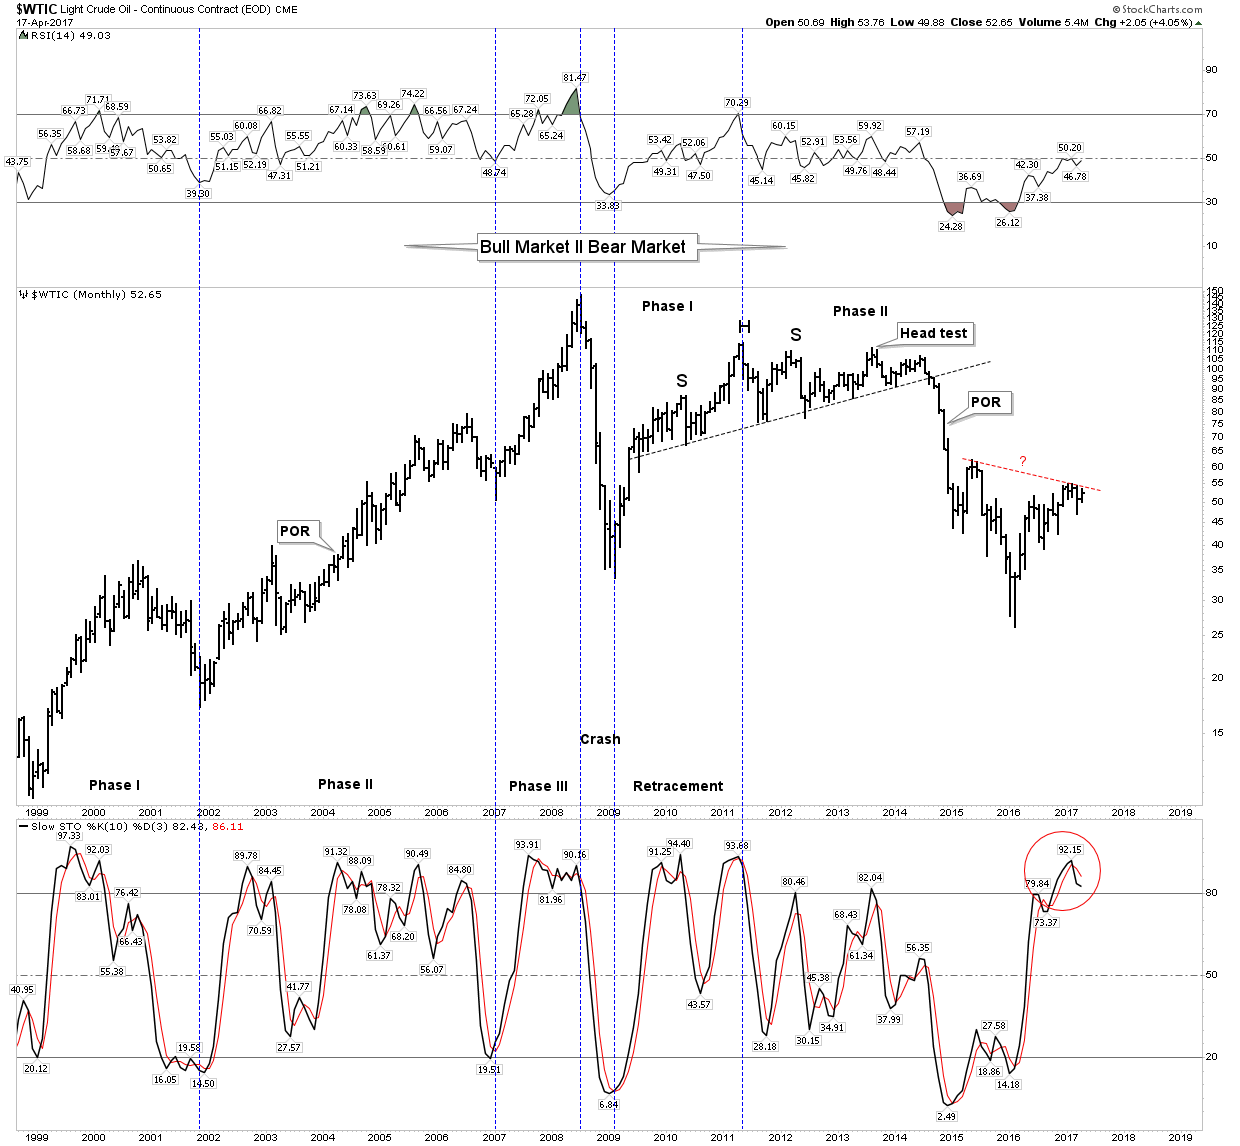
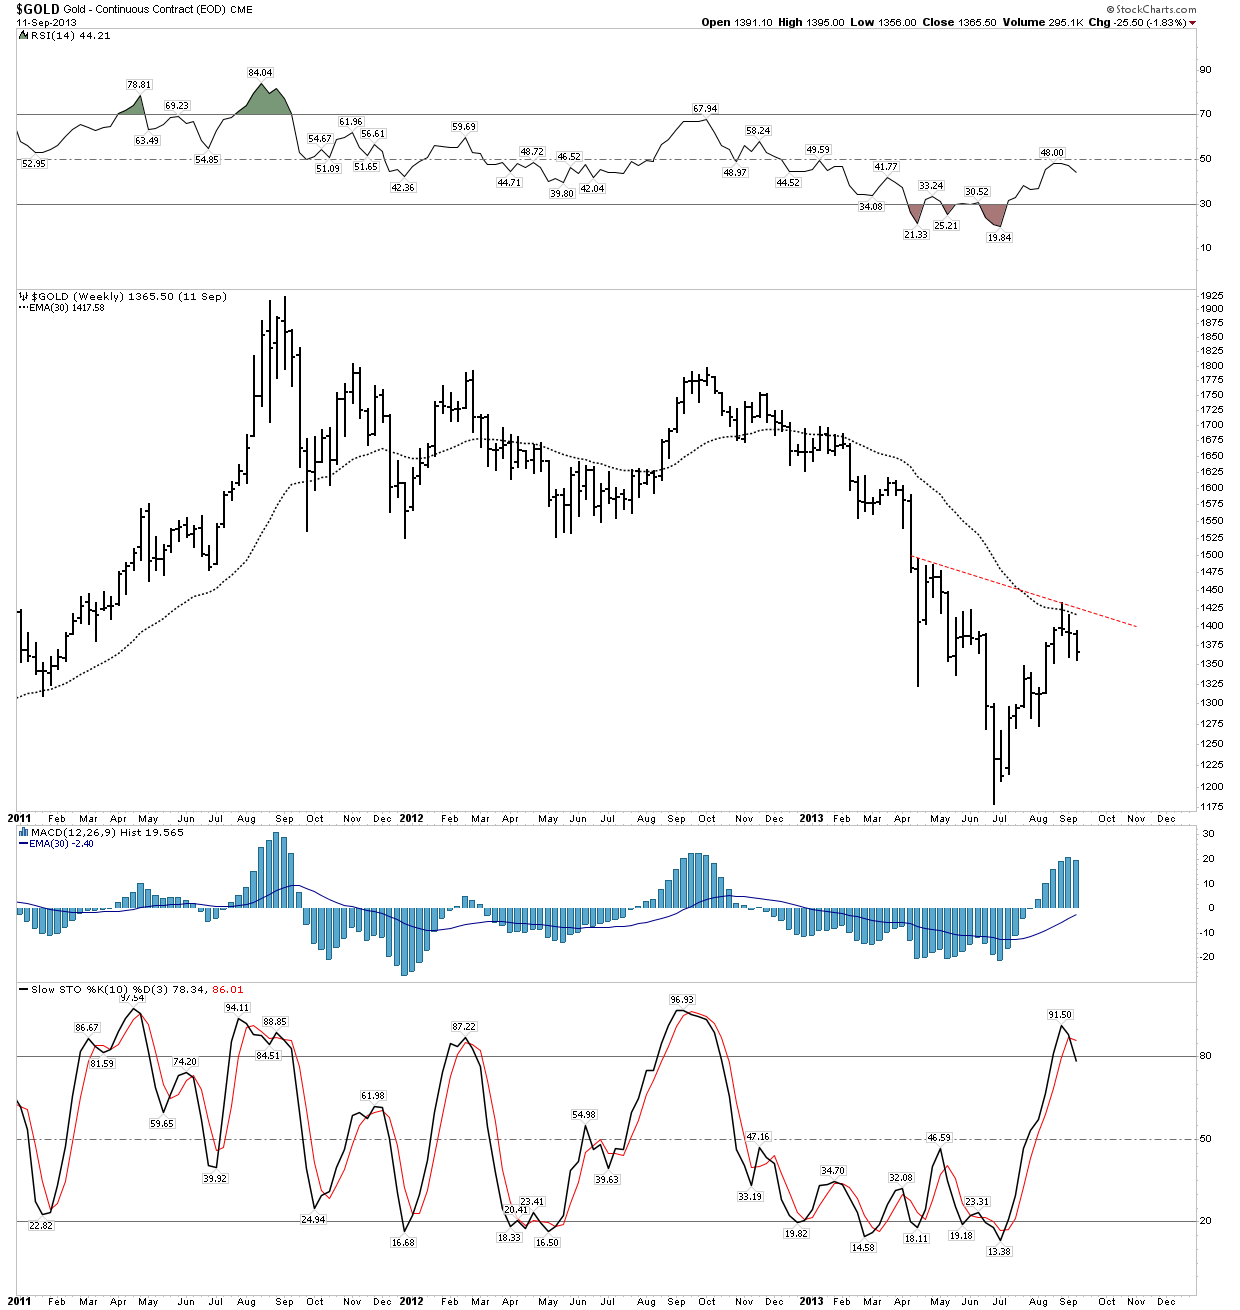
We all know that gold’s price just kept on going down and the H&S was never was valid. I suspect the same thing will play out with oil.
Another Retracement in an ongoing bear market
What we have witnessed over the past year in the oil market is likely just another retracement of the decline from $114. Oil got bombed out at the bottom just like gold did in 2015. All the sellers had left, it could only bounce up. Mr. Bear needed a recharge so he put on a cyclical bull to draw in the usual suspects… the oil bugs, close cousins to the gold bugs.
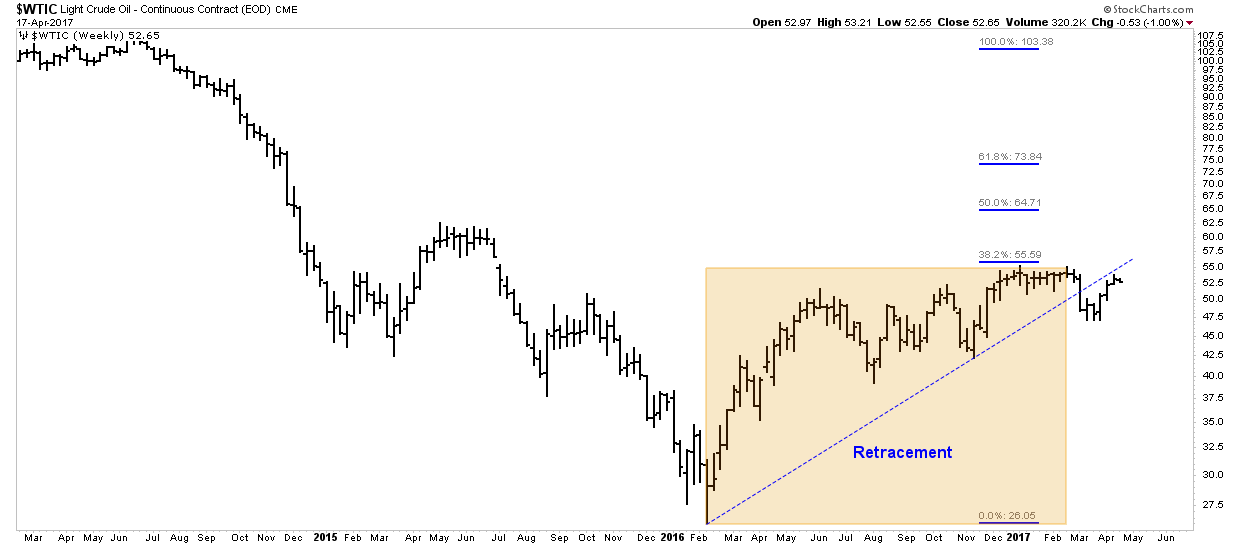
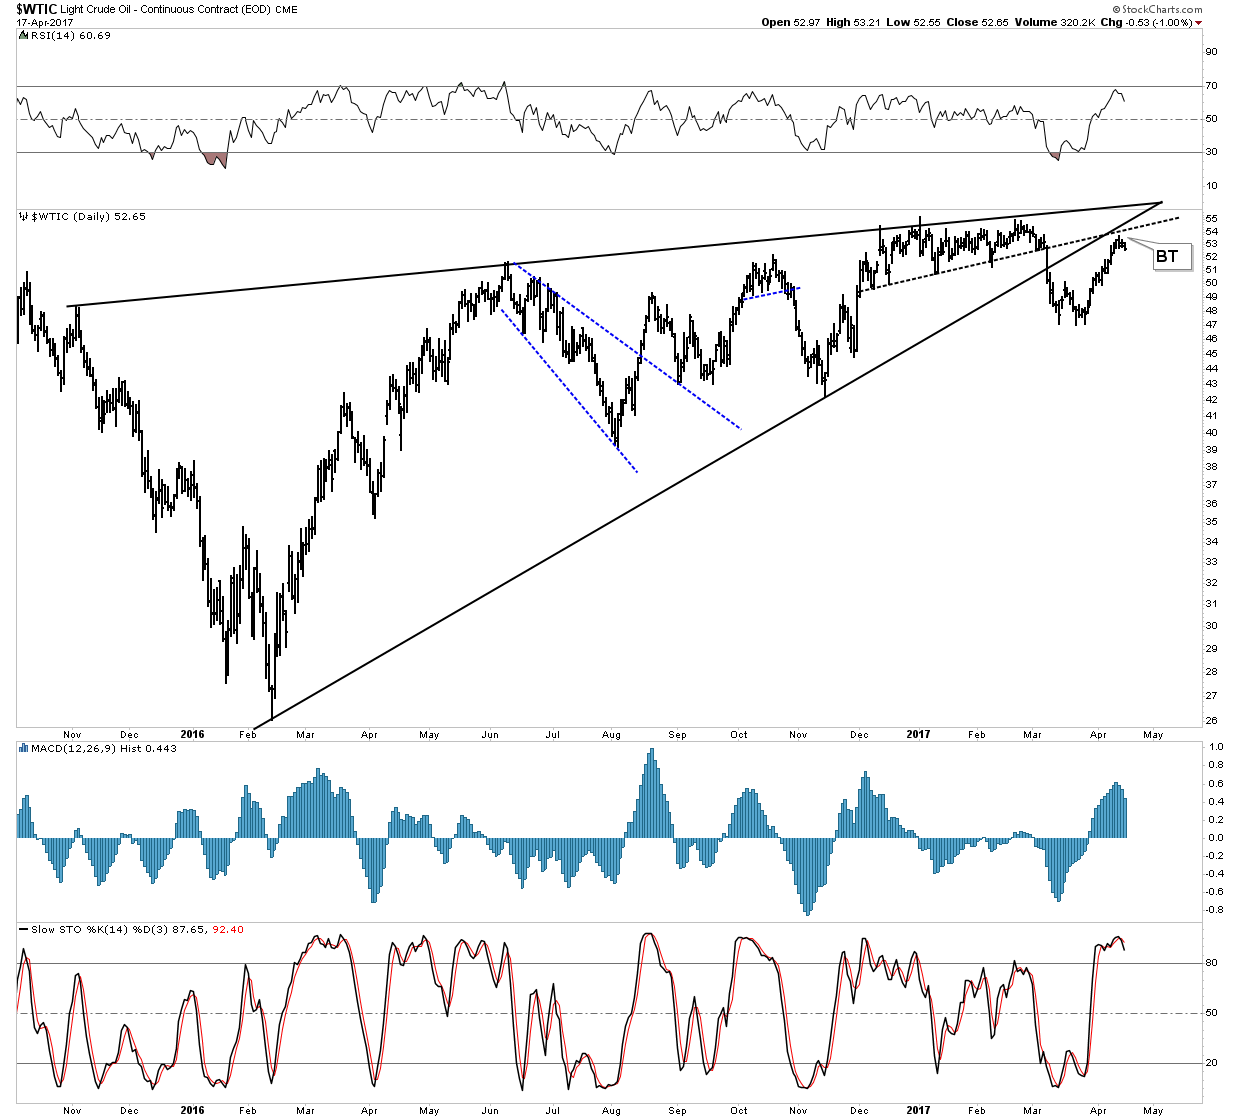
But according to chartology the bounce took the form of a giant bearish rising wedge which lasted about one year and recently broke down out of the wedge. It is now in an aggressive backtest which offers a low risk short entry.
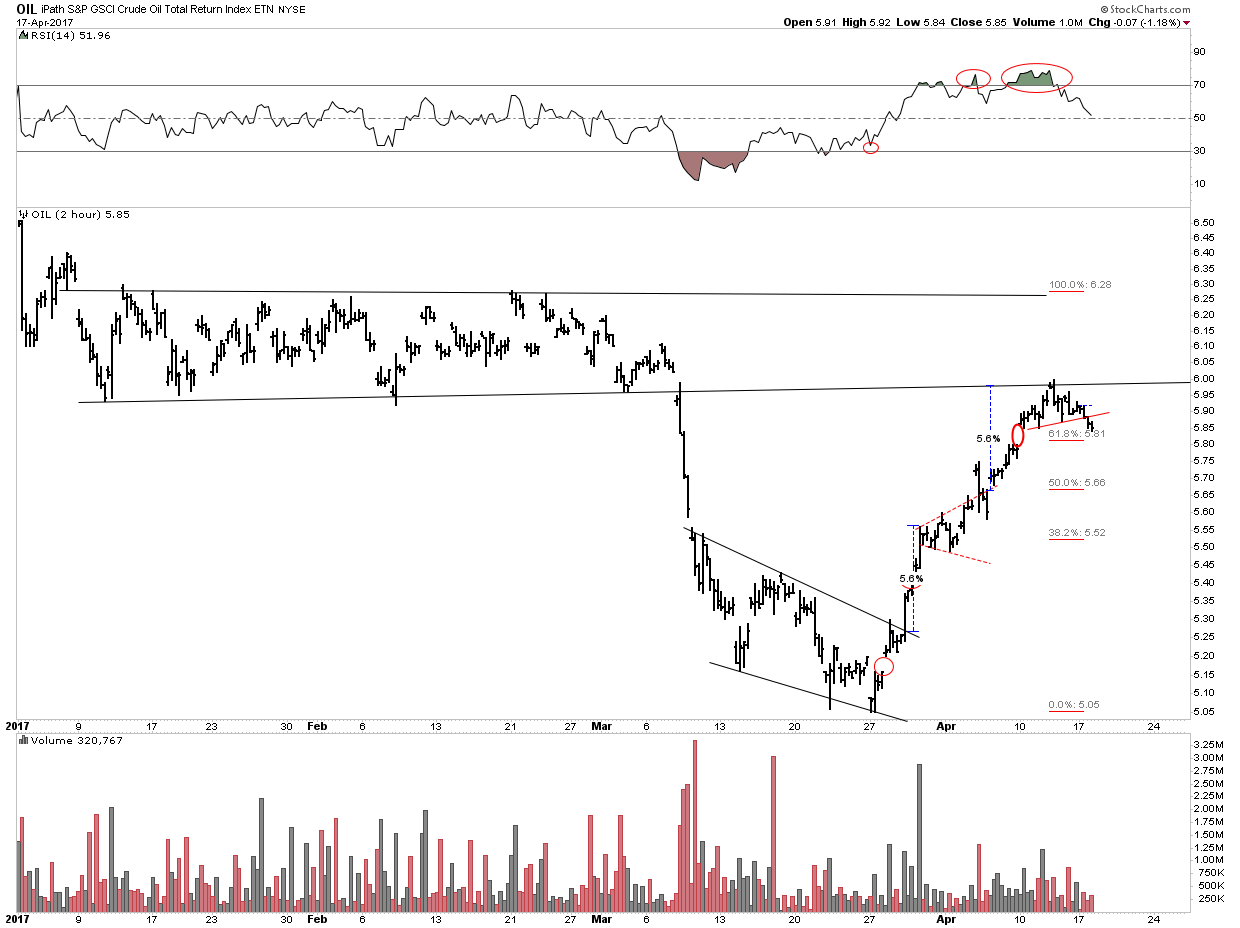
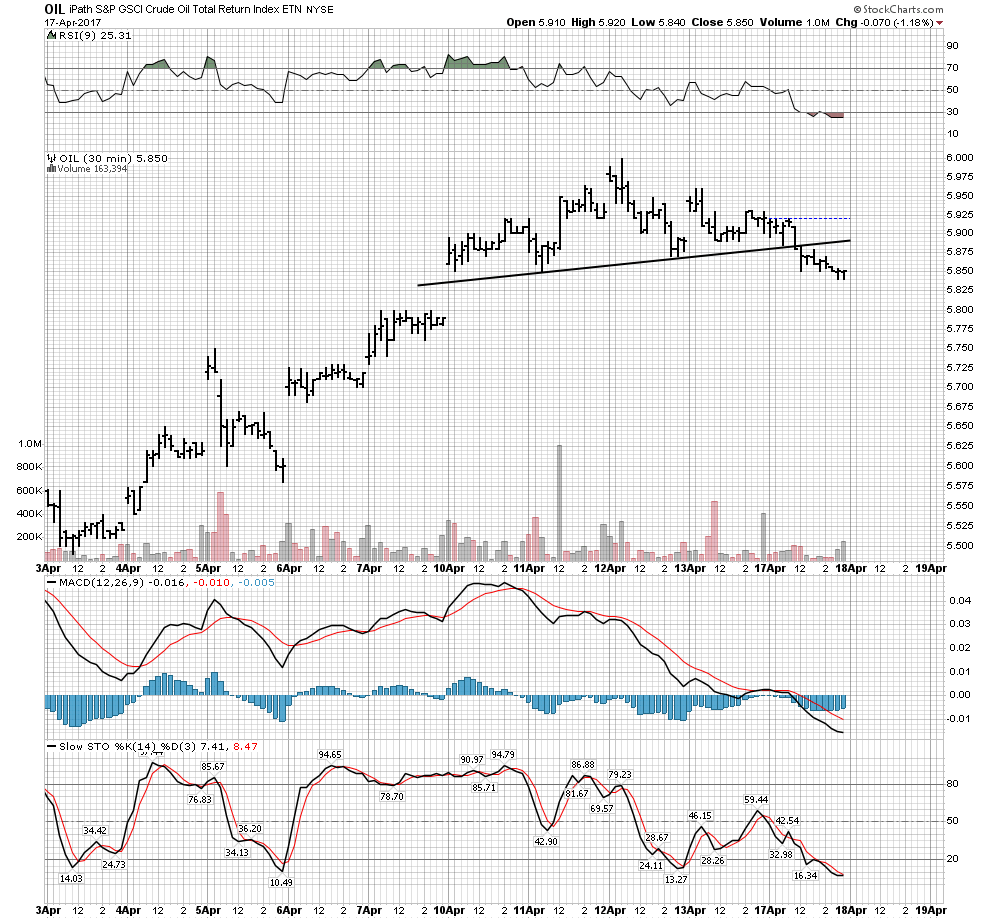
Here is a close-up 2-hour duration chart depicting OIL ETF in its recent retracement after falling out of its massive one year retracement wedge. IMO this recent bounce over the past 3 weeks was fueled by initial bearish psychology. Several newsletter writers advised their flocks to short oil using leveraged vehicles after the initial breakdown had occurred. I am on record of entering my short, using UWT right at the initial break. I closed out the trade after the second bounce on March 23rd. The aggressive bounce starting on March 27th I view as a short squeeze jacking all the Johnny come lately’s. That’s how initial breakdowns often develop, Mr Market needs to squeeze out the shorts and retest the original breakdown level.
The run up to resistance since Mar 27 has several interesting features. Note the three running gaps in the chart. These are caused by urgency and cry out to be filled. Also price was projected precisely to the point of overhead resistance by the blue breakout to breakout 5.6% measurements. Finally, I found it interesting that price retraced just above FIB 61.8%. If you go back to Part I and look at the chart labeled the great retracement you will see the oil price retracement from 2009 to 2011 retraced exactly the same amount, just above the 61.8% level. All of these points lend credence that the bounce may now be over and its time to enter short.
Here is todays action. There is a chance we have a top with the break of the short term NL.
Risk Factors
It’s easy to be wrong so I have controlled risk of potential loss by buying call options at higher strike prices. Waking up tomorrow to find the Iranians have blocked the straits of Hormuz would be painful, but not a wipeout. However I consider this a low risk entry because if prices close above the February highs I close out the trade. That’s only $3 per bbl of risk above today’s price. That’s limited exposure, despite leverage. Above that point we reevaluate our investing premise and if its still valid we wait for the next entry set-up.
Normally I don’t short when above a rising 30 W EMA, however I see this as a unique set-up with defined risk exit points. When weekly stochastics turn down and the 30 W EMA tilts down it would be appropriate to add to the short position. Until then its a starter entry. The plan is to ladder into the trade as the technicals improve and we increase the probability of success.
By shorting UWT and selling in the money Jan18 USO calls it aligns the decay of these vehicles in favor of the trade. This also skews the risk reward favorably.
So that’s the Big Trade. My objective is to earn 50-60% on my capital deployed over a period of 10 months. If the oil price drops to $30-35 this should be achieved. What makes the trade big is not the rate of return but the economic implications. Again, get the main theme right and other things fall into place. Other trades will be related to this central theme.
Trade aggressively but protect your capital.

-
I know Mike is a very solid investor and respect his opinions very much. So if he says pay attention to this or that - I will.
~ Dale G.
-
I've started managing my own investments so view Michael's site as a one-stop shop from which to get information and perspectives.
~ Dave E.
-
Michael offers easy reading, honest, common sense information that anyone can use in a practical manner.
~ der_al.
-
A sane voice in a scrambled investment world.
~ Ed R.
Inside Edge Pro Contributors

Greg Weldon

Josef Schachter

Tyler Bollhorn

Ryan Irvine

Paul Beattie

Martin Straith

Patrick Ceresna

Mark Leibovit

James Thorne

Victor Adair